

Compact Muon Solenoid
LHC, CERN
| CMS-BPH-11-026 ; CERN-PH-EP-2013-167 | ||
| Observation of a peaking structure in the $ \mathrm{J}/\psi\phi$ mass spectrum from $ \mathrm{ B }^\pm \to \mathrm{J}/\psi \phi \mathrm{K}^\pm$ decays | ||
| CMS Collaboration | ||
| 26 September 2013 | ||
| Phys. Lett. B 734 (2014) 261-281 | ||
| Abstract: A peaking structure in the J/$\psi \phi$ mass spectrum near threshold is observed in $B^\pm \to J/\psi \phi K^\pm$ decays, produced in pp collisions at $\sqrt{s}$ = 7 TeV collected with the CMS detector at the LHC. The data sample, selected on the basis of the dimuon decay mode of the J/psi, corresponds to an integrated luminosity of 5.2 inverse femtobarns. Fitting the structure to an S-wave relativistic Breit-Wigner lineshape above a three-body phase-space nonresonant component gives a signal statistical significance exceeding five standard deviations. The fitted mass and width values are m=4148.0 +/- 2.4 (stat.) +/- 6.3 (syst.) MeV and $\Gamma = 28_{-11}^{+15}$ (stat.) +/- 19 (syst.) MeV, respectively. Evidence for an additional peaking structure at higher J/$\psi \phi$ mass is also reported. | ||
| Links: e-print arXiv:1309.6920 [hep-ex] (PDF) ; CDS record ; inSPIRE record ; Public twiki page ; CADI line (restricted) ; | ||
| Figures | |
png pdf |
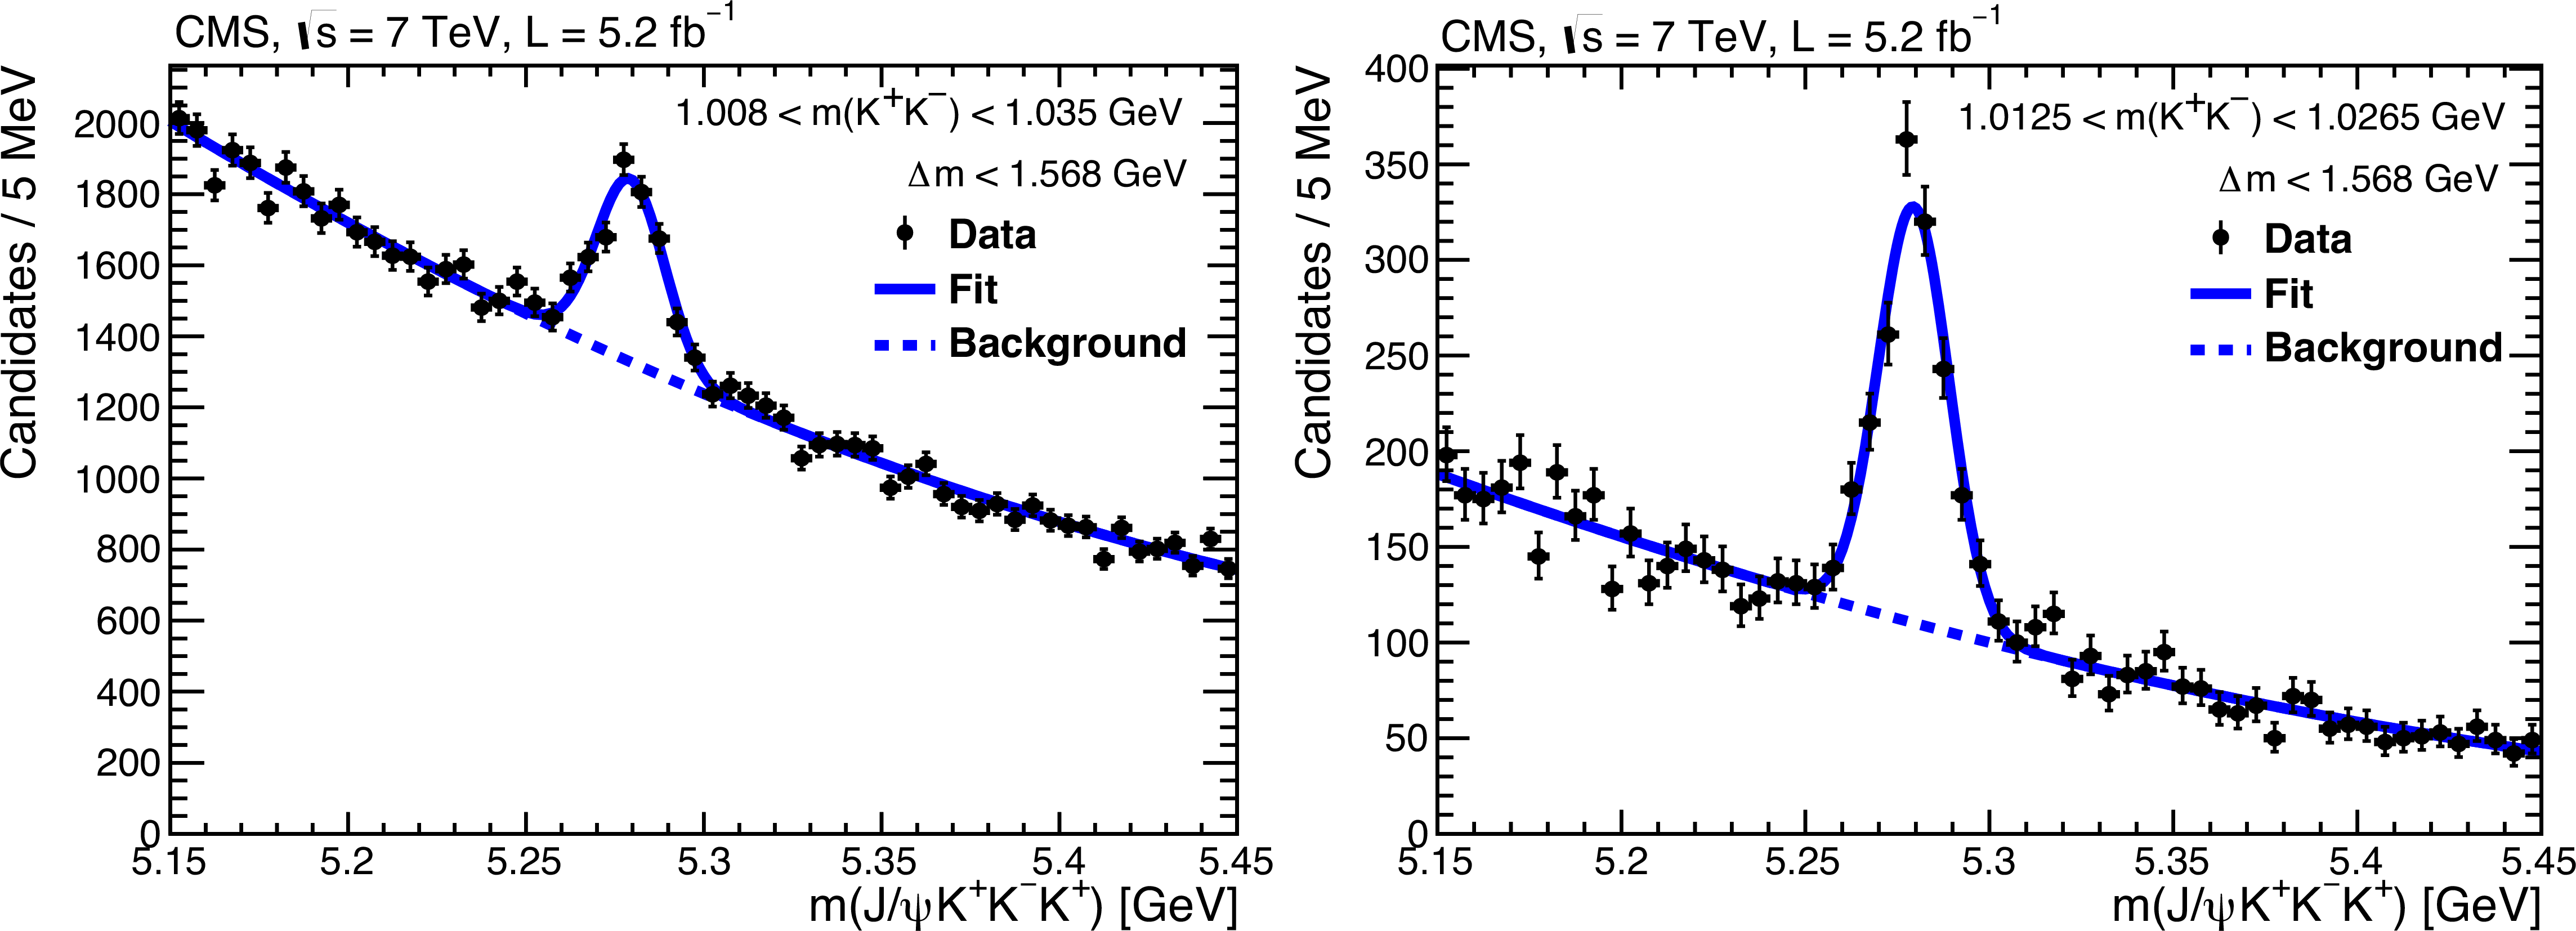
Figure 1:
The $ {\mathrm {J} \psi } \phi {\mathrm {K^+}}$ mass distribution with the standard event selection (left) and the tighter requirements (right). The solid curves show the result of fitting these distributions to a Gaussian signal and a second-degree polynomial background while the dashed curves show the background contribution. |
png pdf |
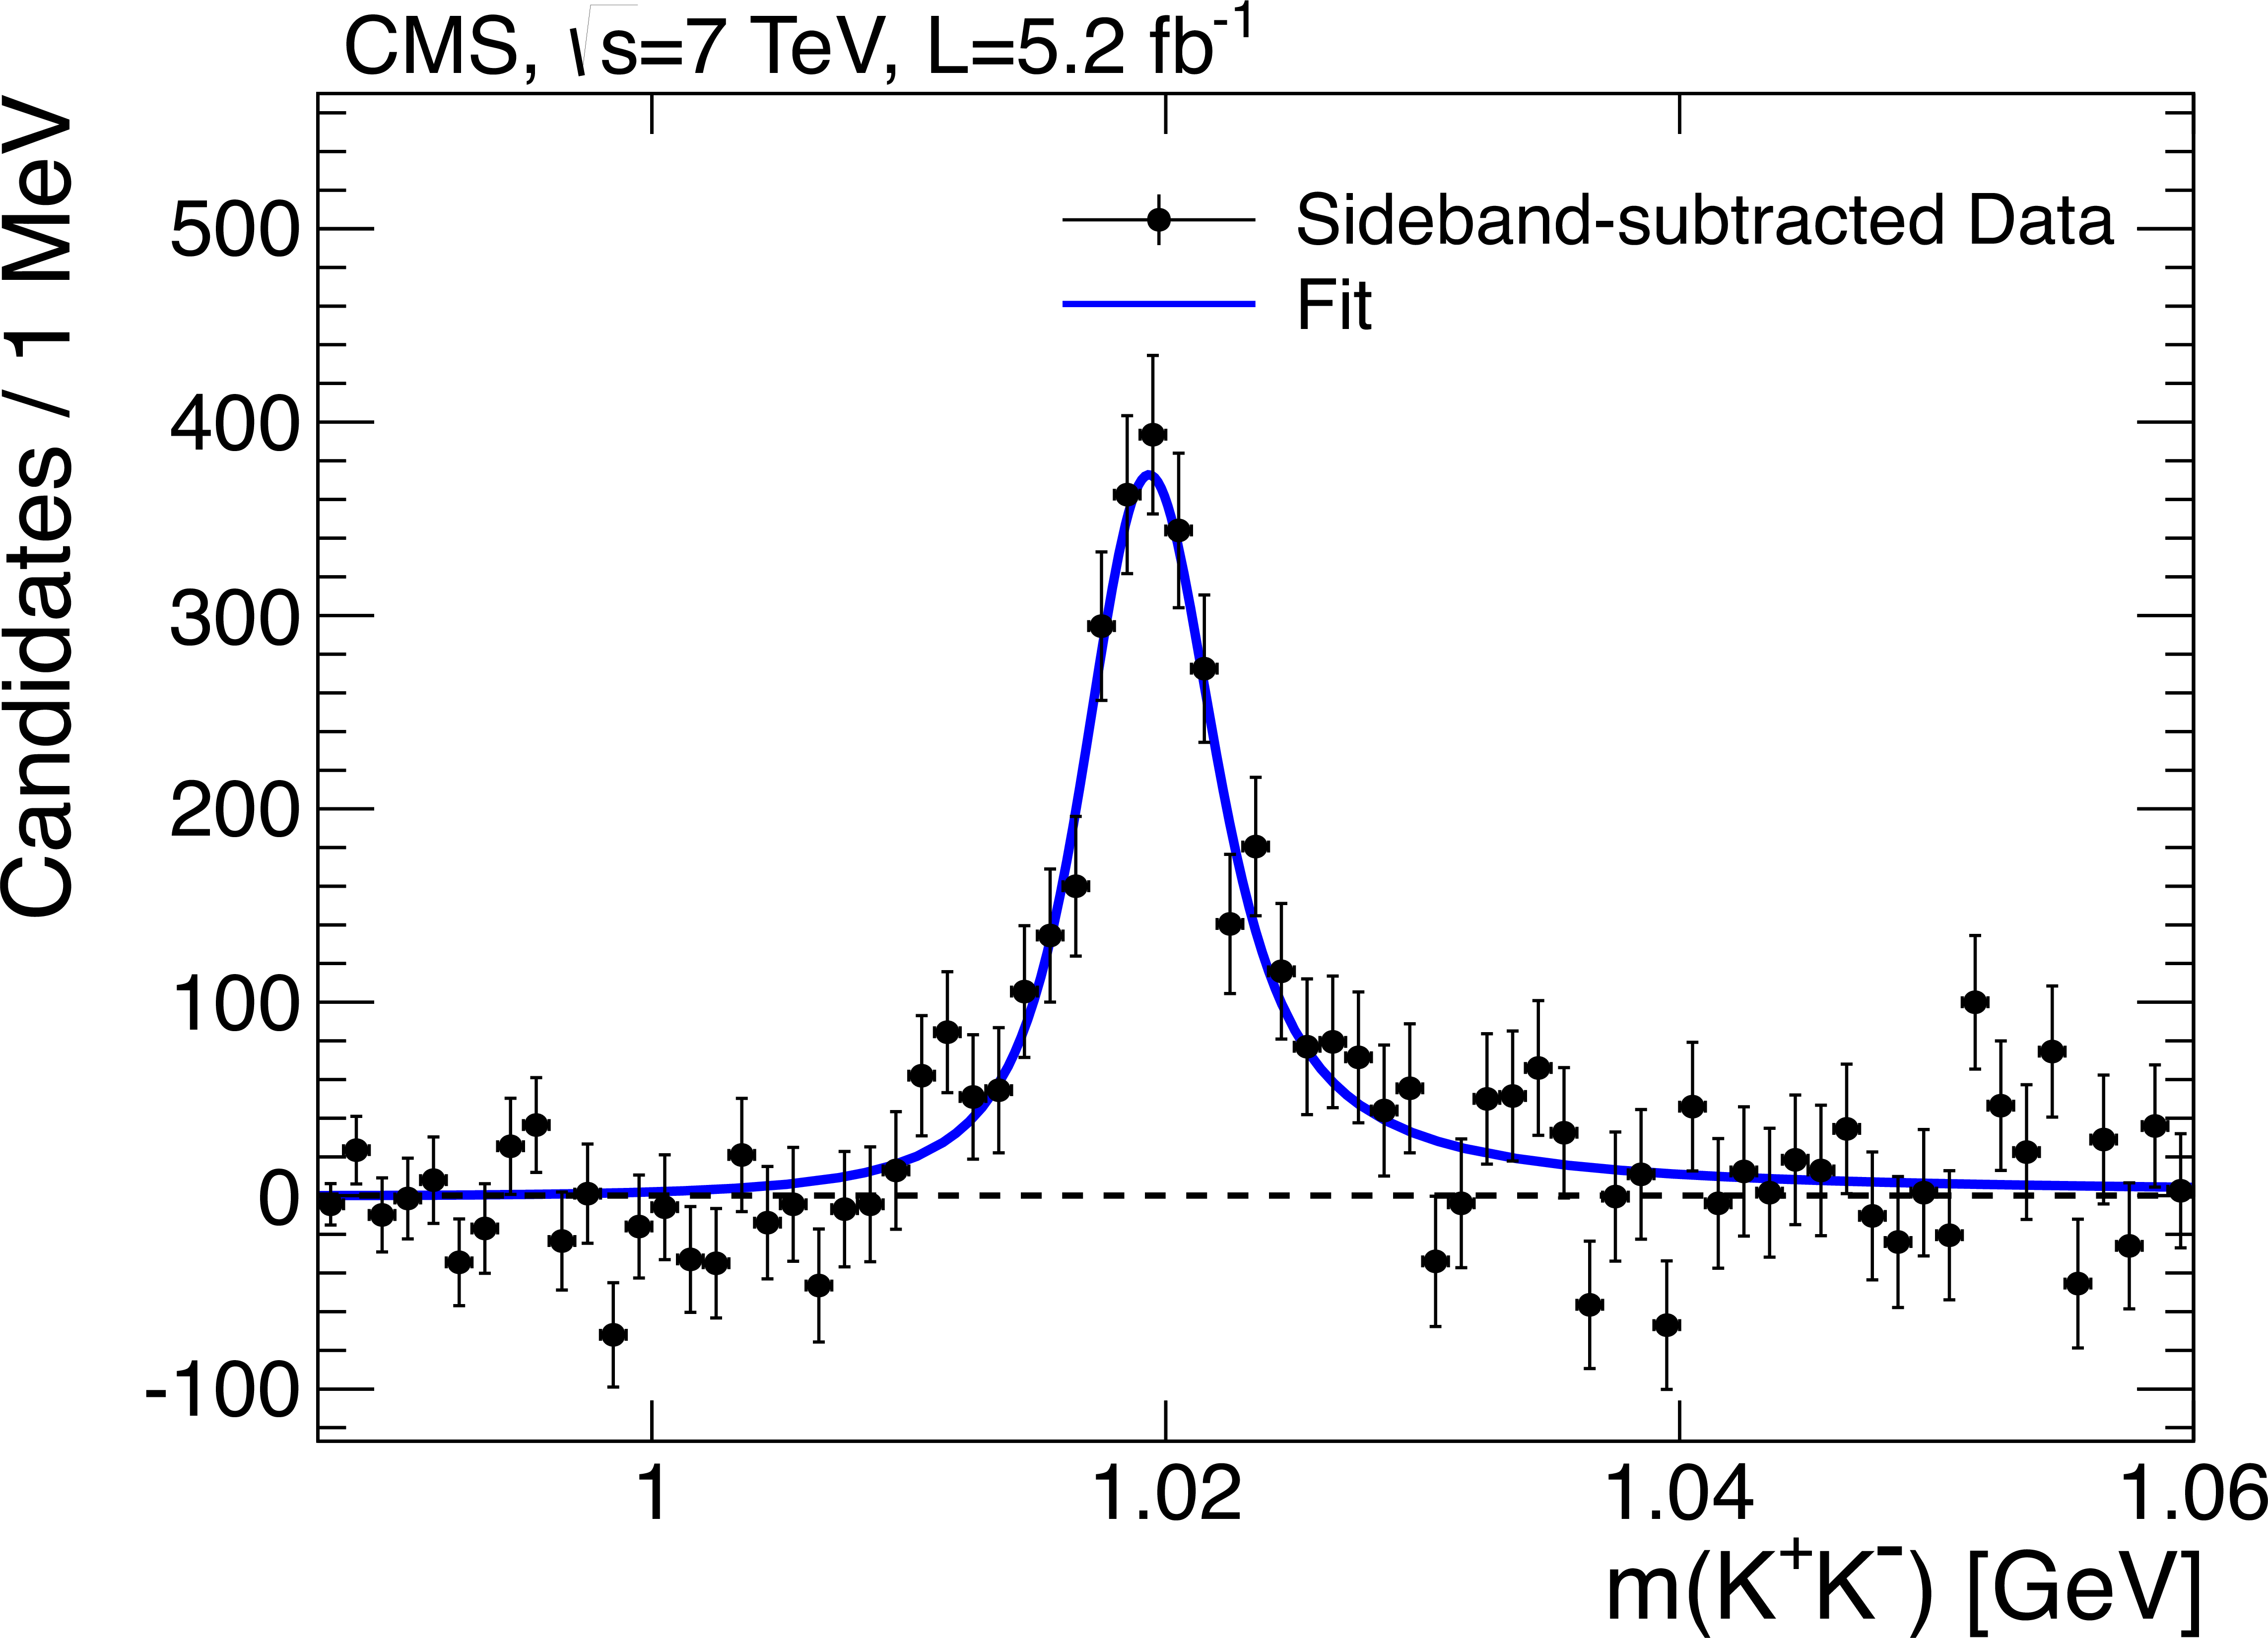
Figure 2:
The $ {{\mathrm {B}^{+}}}$ sideband-subtracted $ {\mathrm {K^+}} {\mathrm {K^-}}$ invariant-mass distribution for $ {\mathrm {J} \psi } {\mathrm {K^+}} {\mathrm {K^-}} {\mathrm {K^+}}$ candidates within $\pm 3 \sigma $ of the nominal $ {{\mathrm {B}^{+}}}$ mass. The solid curve is the result of the fit described in the text. The dashed line shows the zero-candidate baseline. |
png pdf |
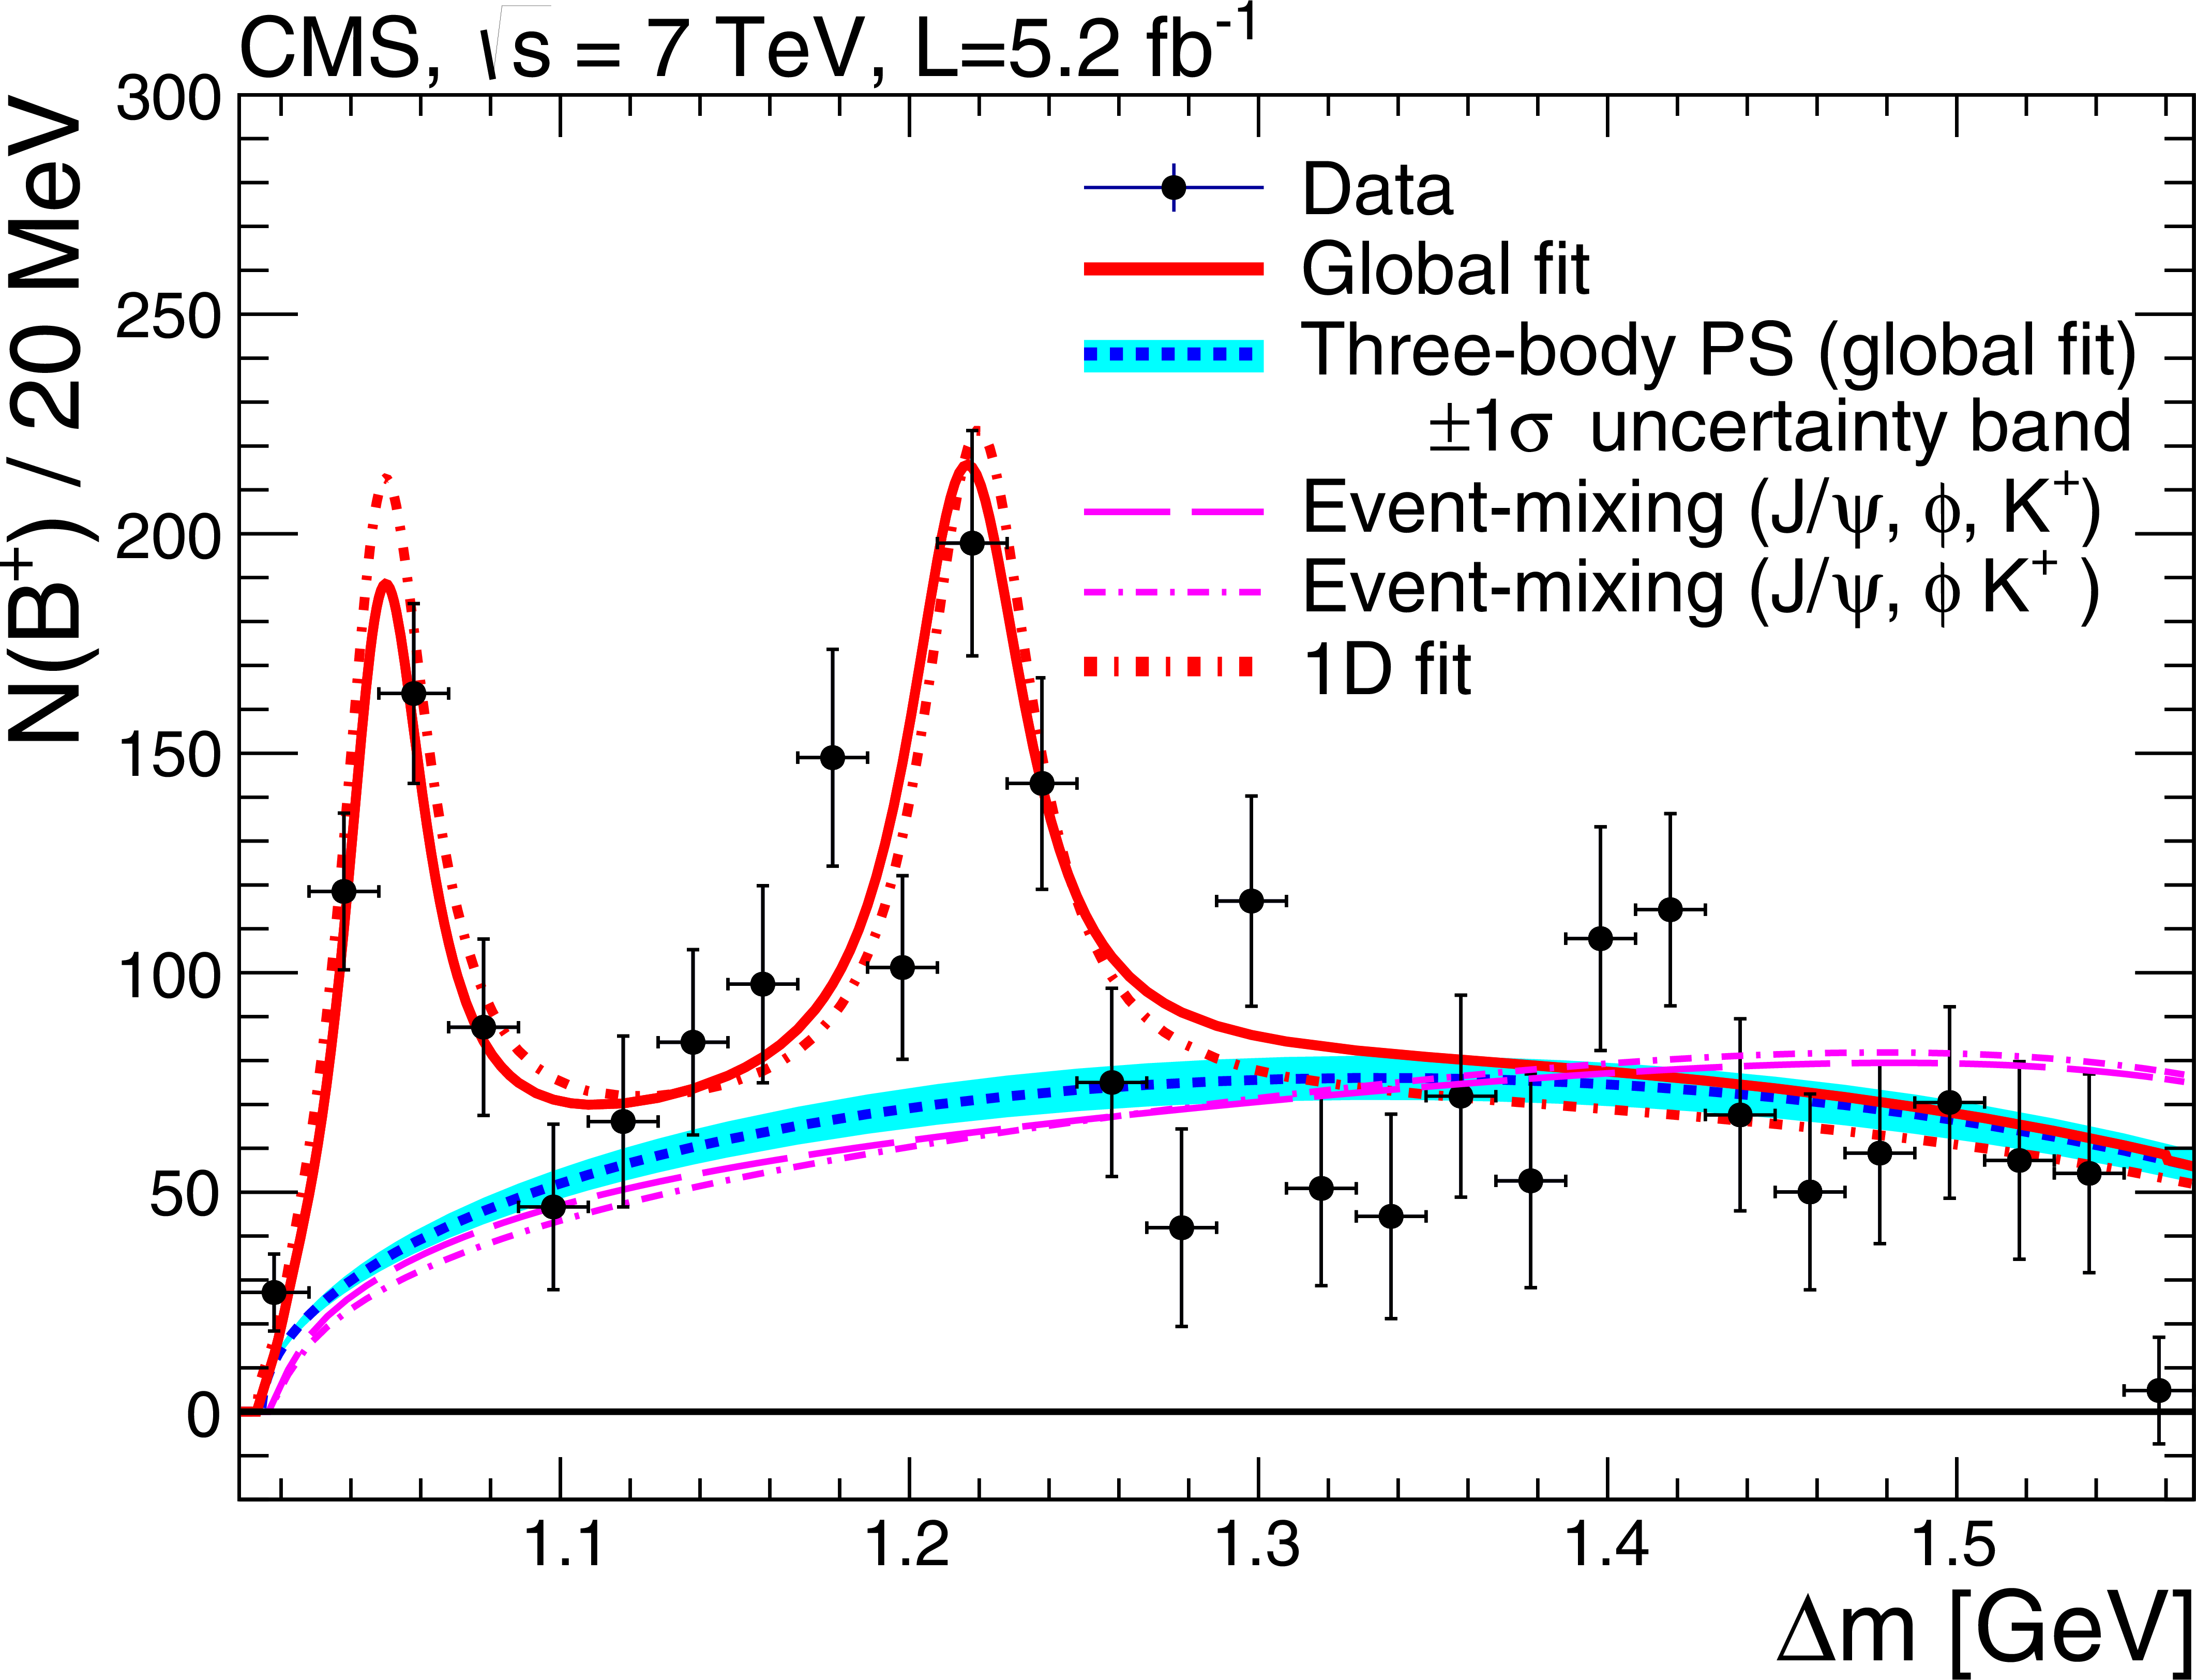
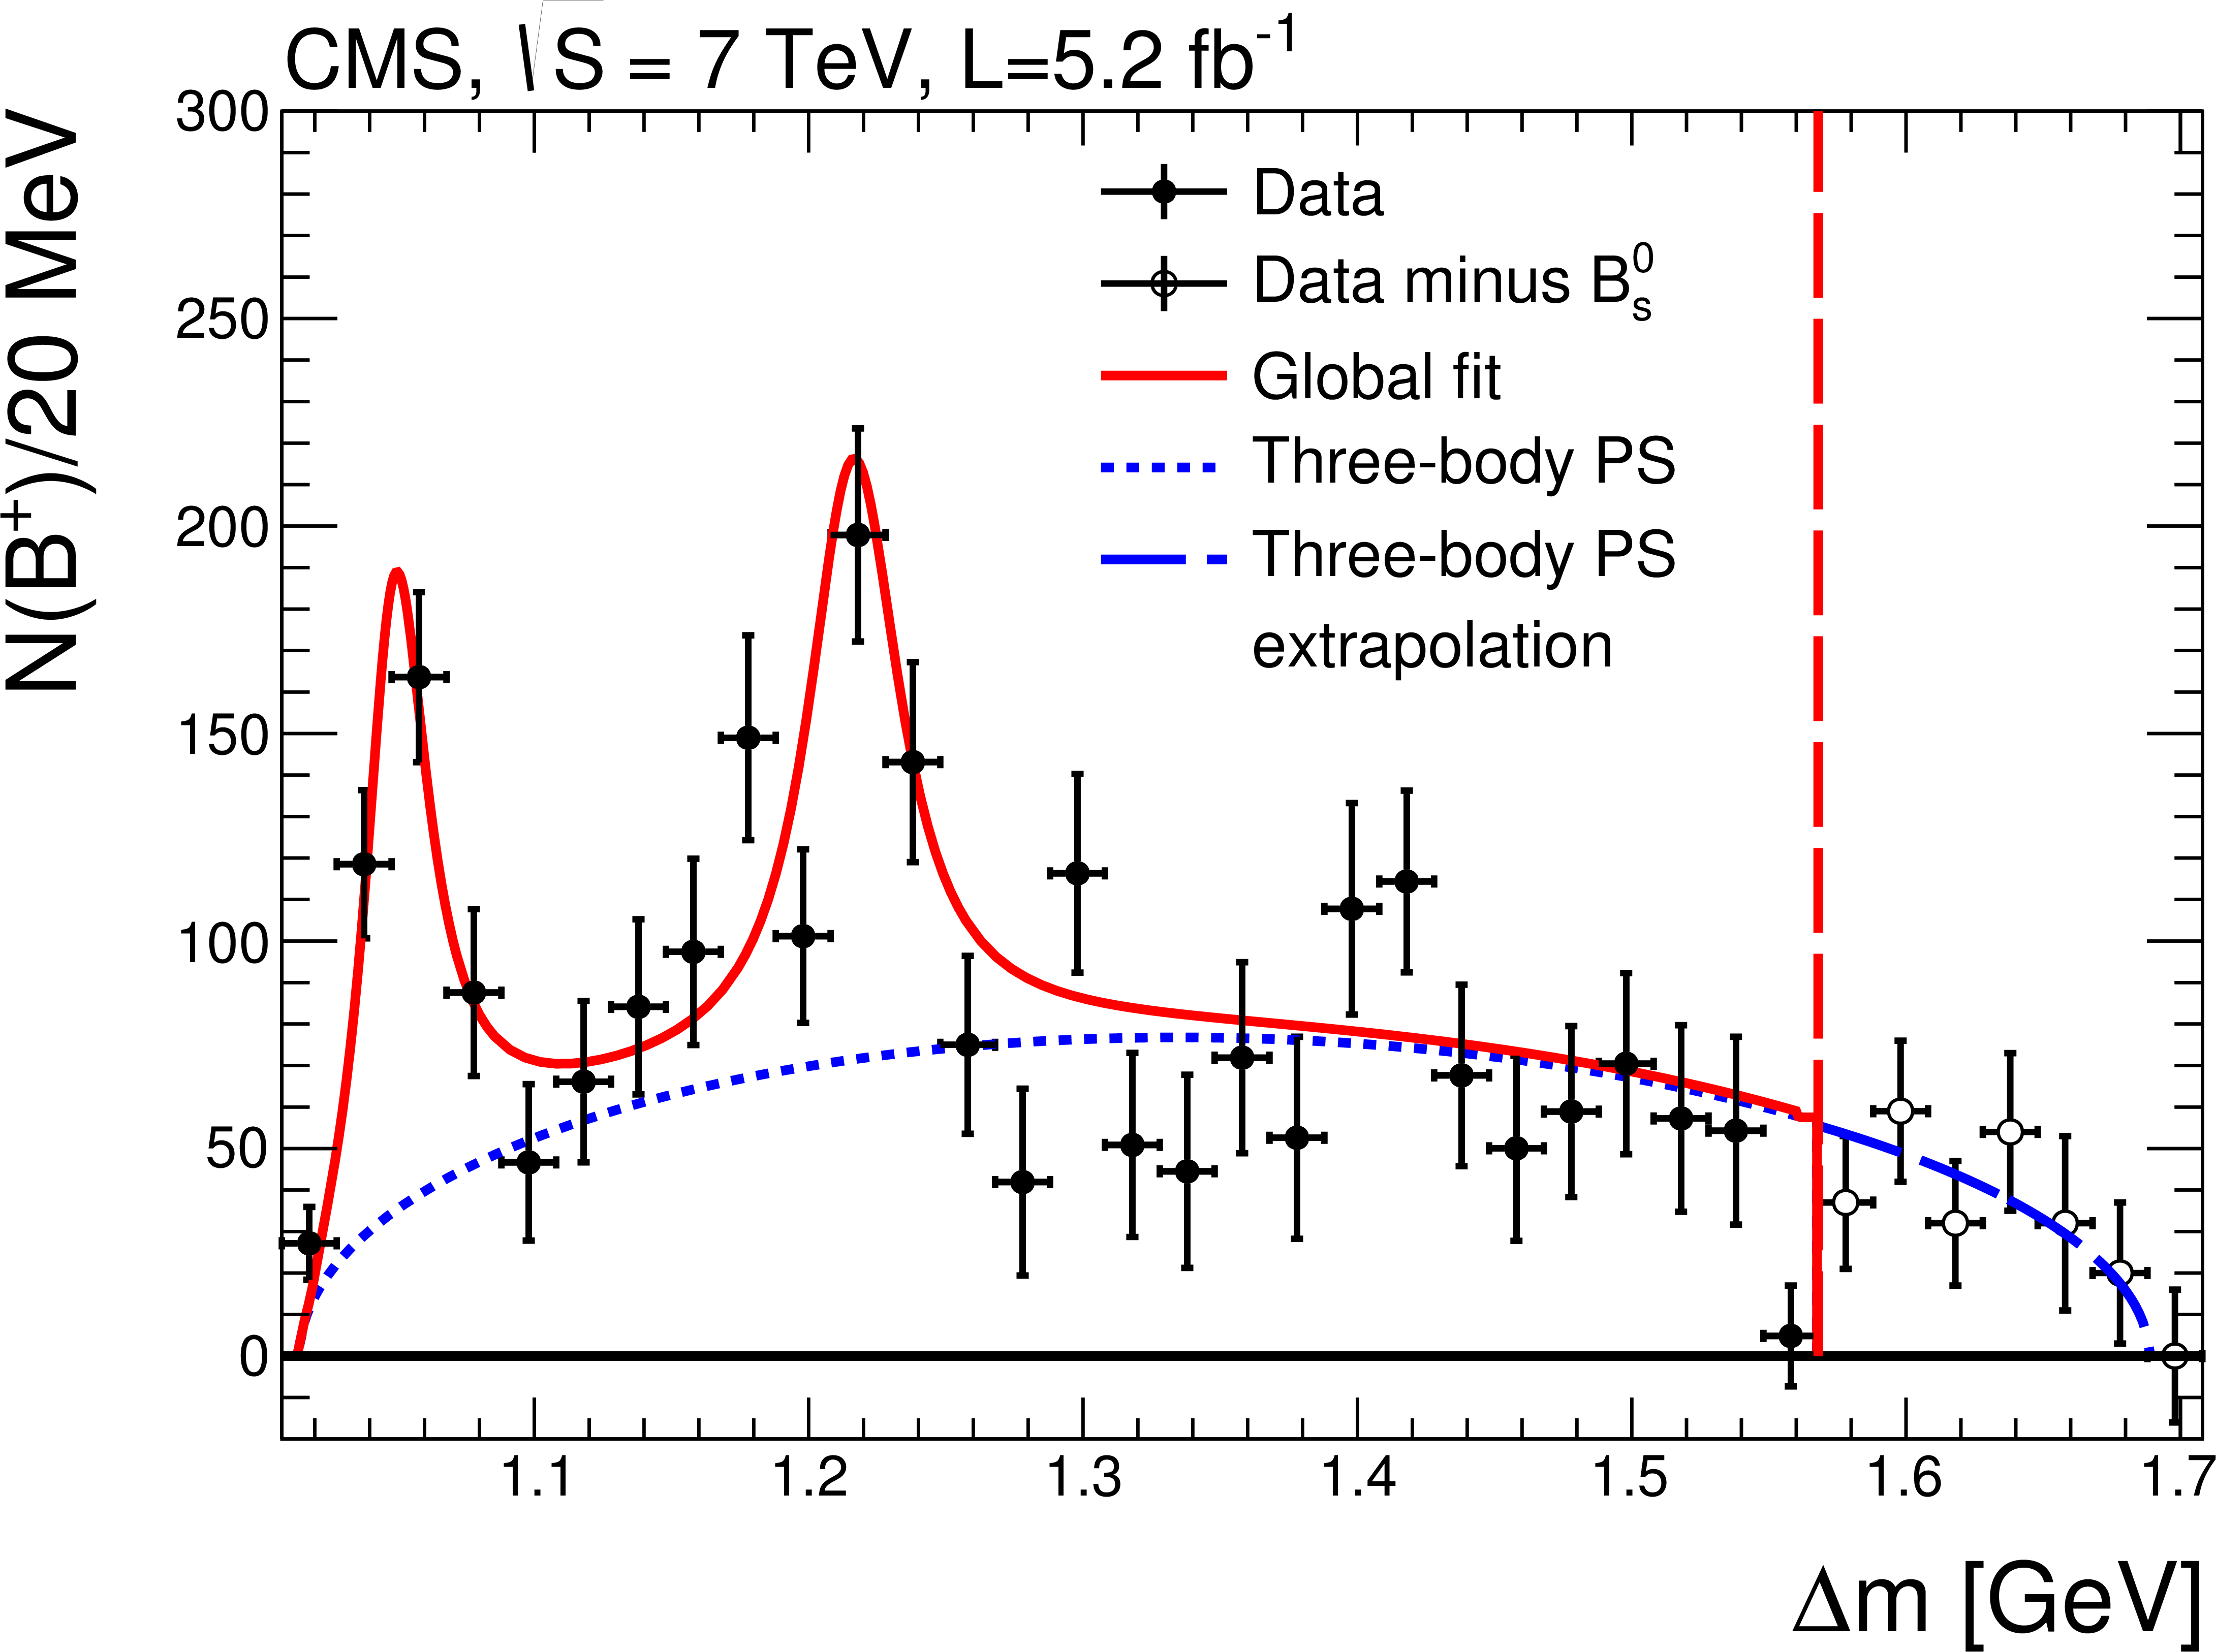
Figure 3:
The number of $ {{\mathrm {B}^{+}}}\to {\mathrm {J} \psi } \phi {\mathrm {K^+}}$ candidates as a function of $\Delta m = m( {{\mu ^+}} {{\mu ^-}} {\mathrm {K^+}} {\mathrm {K^-}})-m( {{\mu ^+}} {{\mu ^-}})$. The solid curve is the global unbinned maximum-likelihood fit of the data, and the dotted curve is the background contribution assuming three-body PS. The band is the $\pm 1\sigma $ uncertainty range for the background obtained from the global fit. The dashed and dash-dotted curves are background curves obtained from two different event-mixing procedures, as described in the text, and normalized to the number of three-body PS background events. The short dashed curve is the 1D fit to the data. |
png pdf |
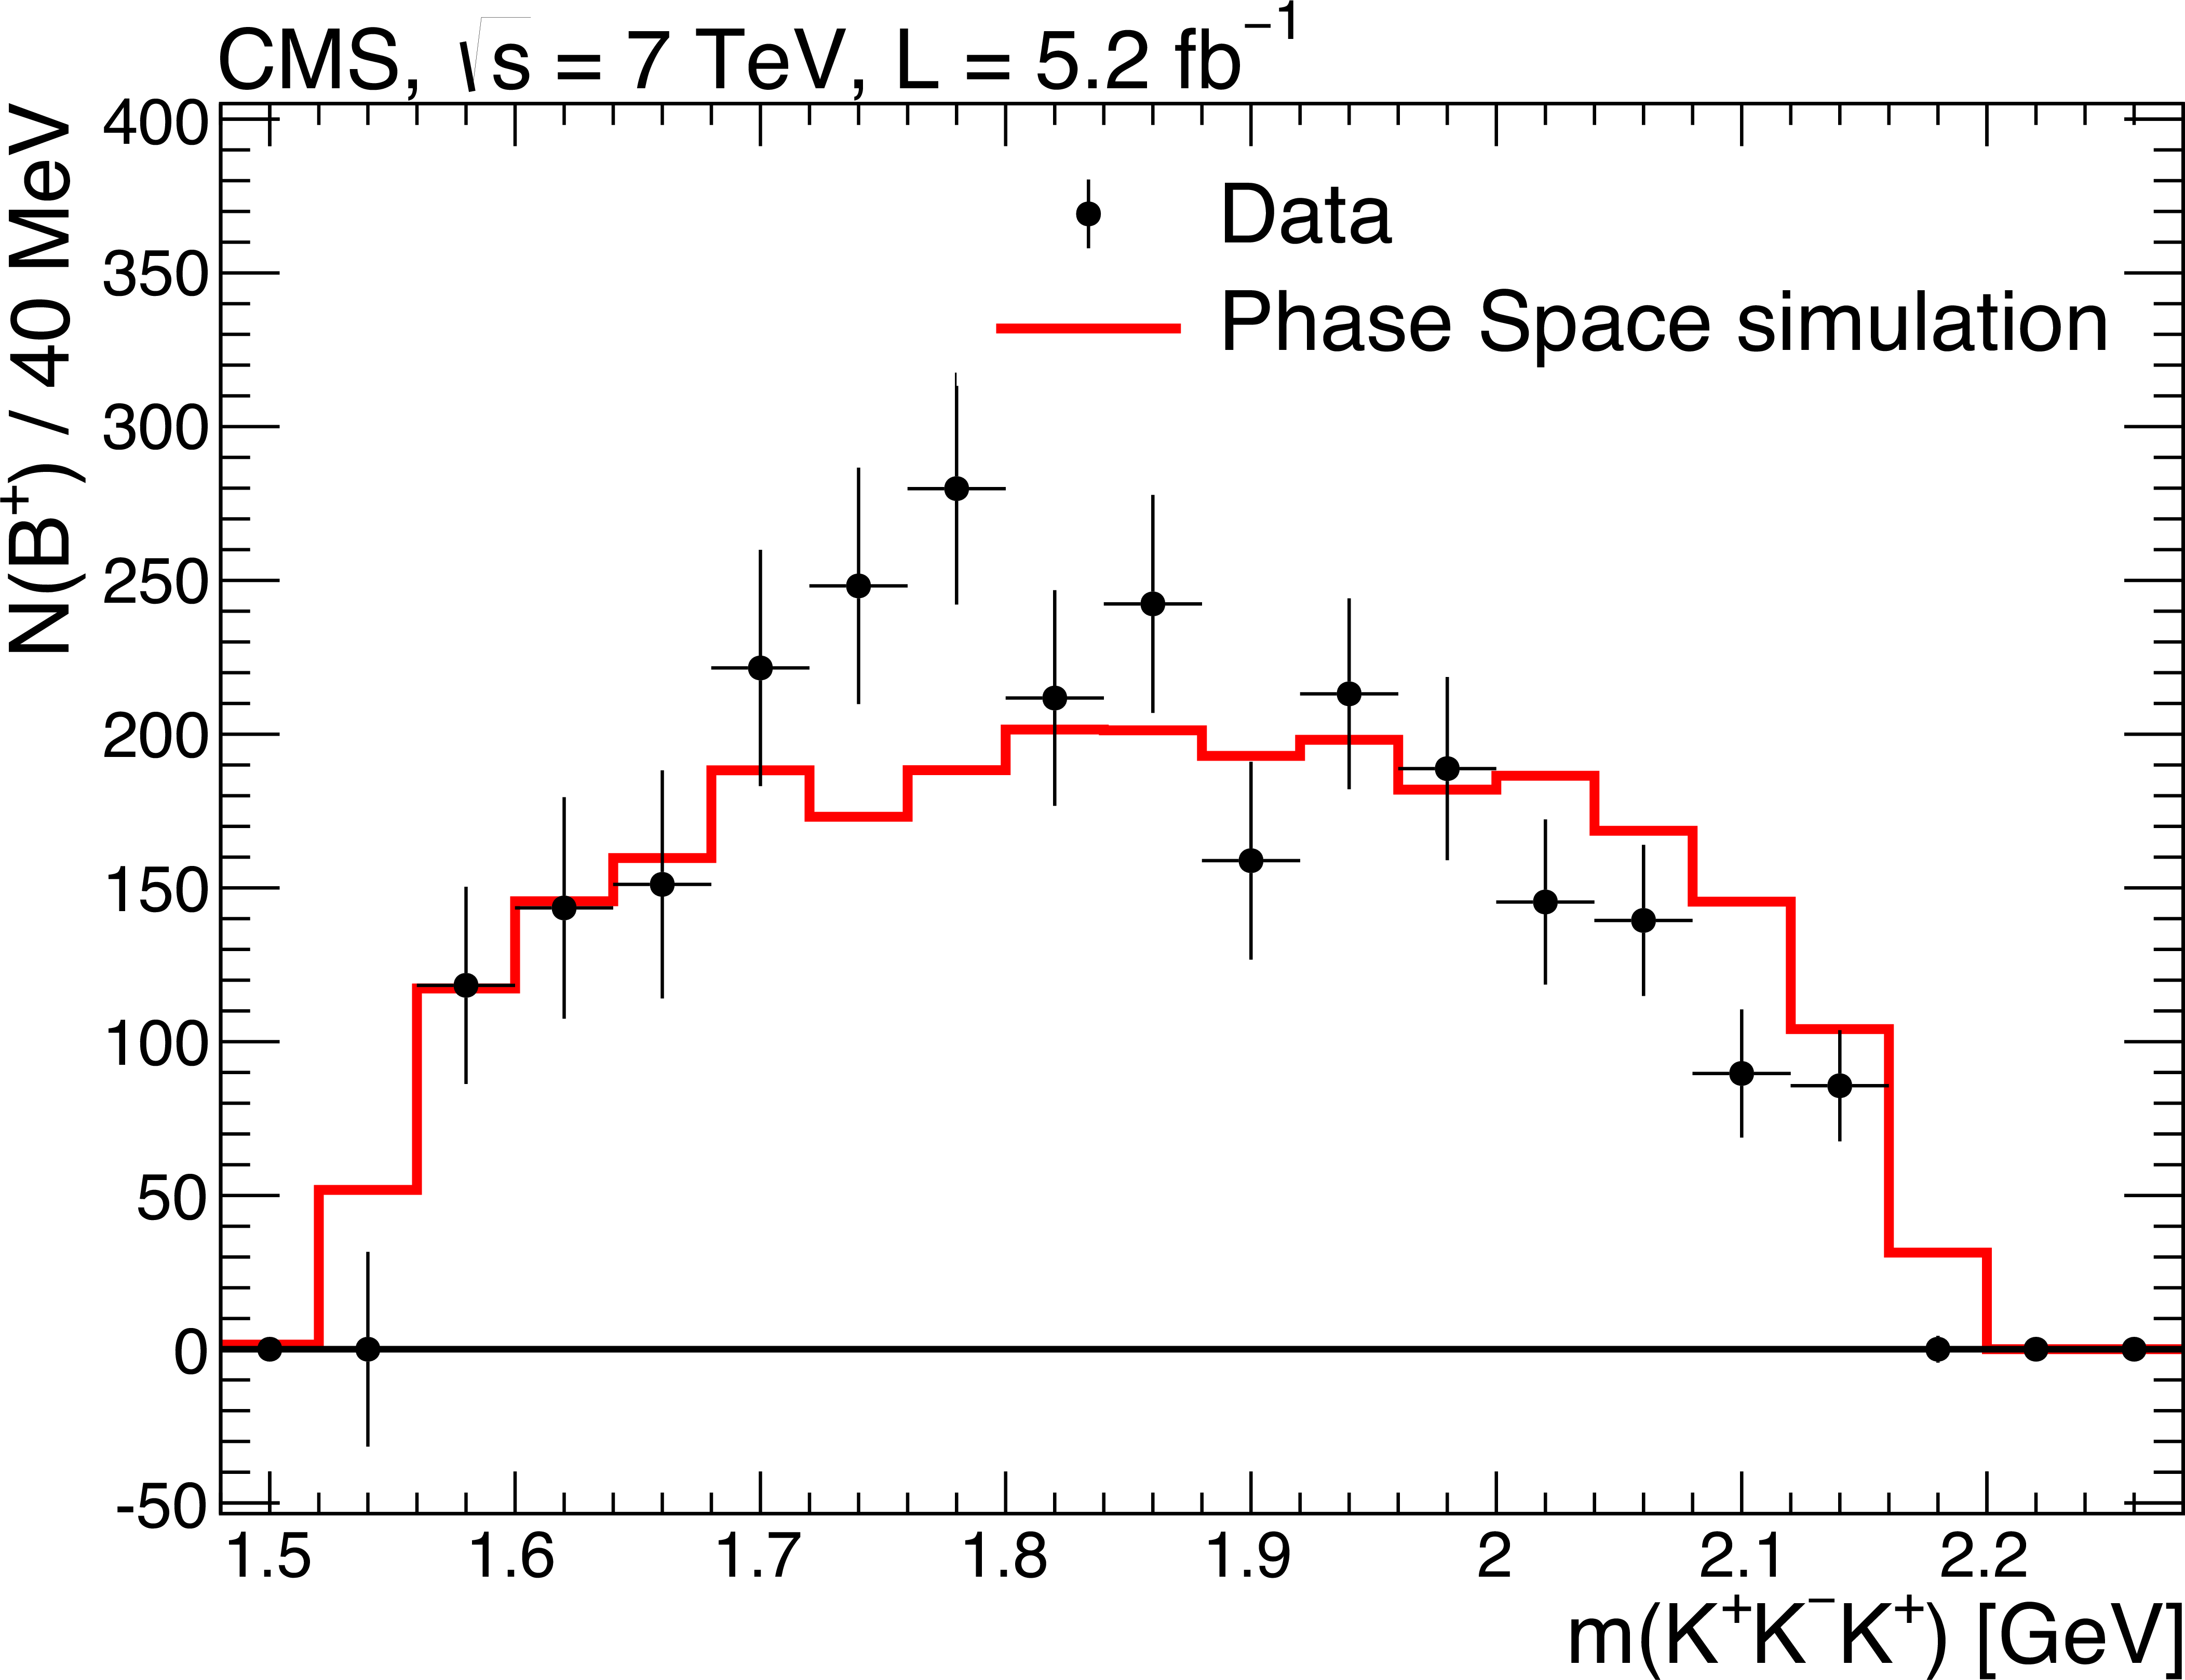
Figure 4:
The yield of $ {{\mathrm {B}^{+}}}\to {\mathrm {J} \psi } {\mathrm {K^+}} {\mathrm {K^-}} {\mathrm {K^+}}$ candidates in the data as a function of the $ {\mathrm {K^+}} {\mathrm {K^-}} {\mathrm {K^+}}$ invariant mass. The error bars represent the statistical uncertainties. The solid curve is the prediction from the PS simulation. |

png pdf |
Figure 5:
The number of $ {{\mathrm {B}^{+}}}\to {\mathrm {J} \psi } \phi {\mathrm {K^+}}$ candidates as a function of $\Delta m $ requiring either $m(\phi {\mathrm {K^+}})<1.68$ GeV or $m(\phi {\mathrm {K^+}})>1.88$ GeV (left), or $1.68 |
png pdf |
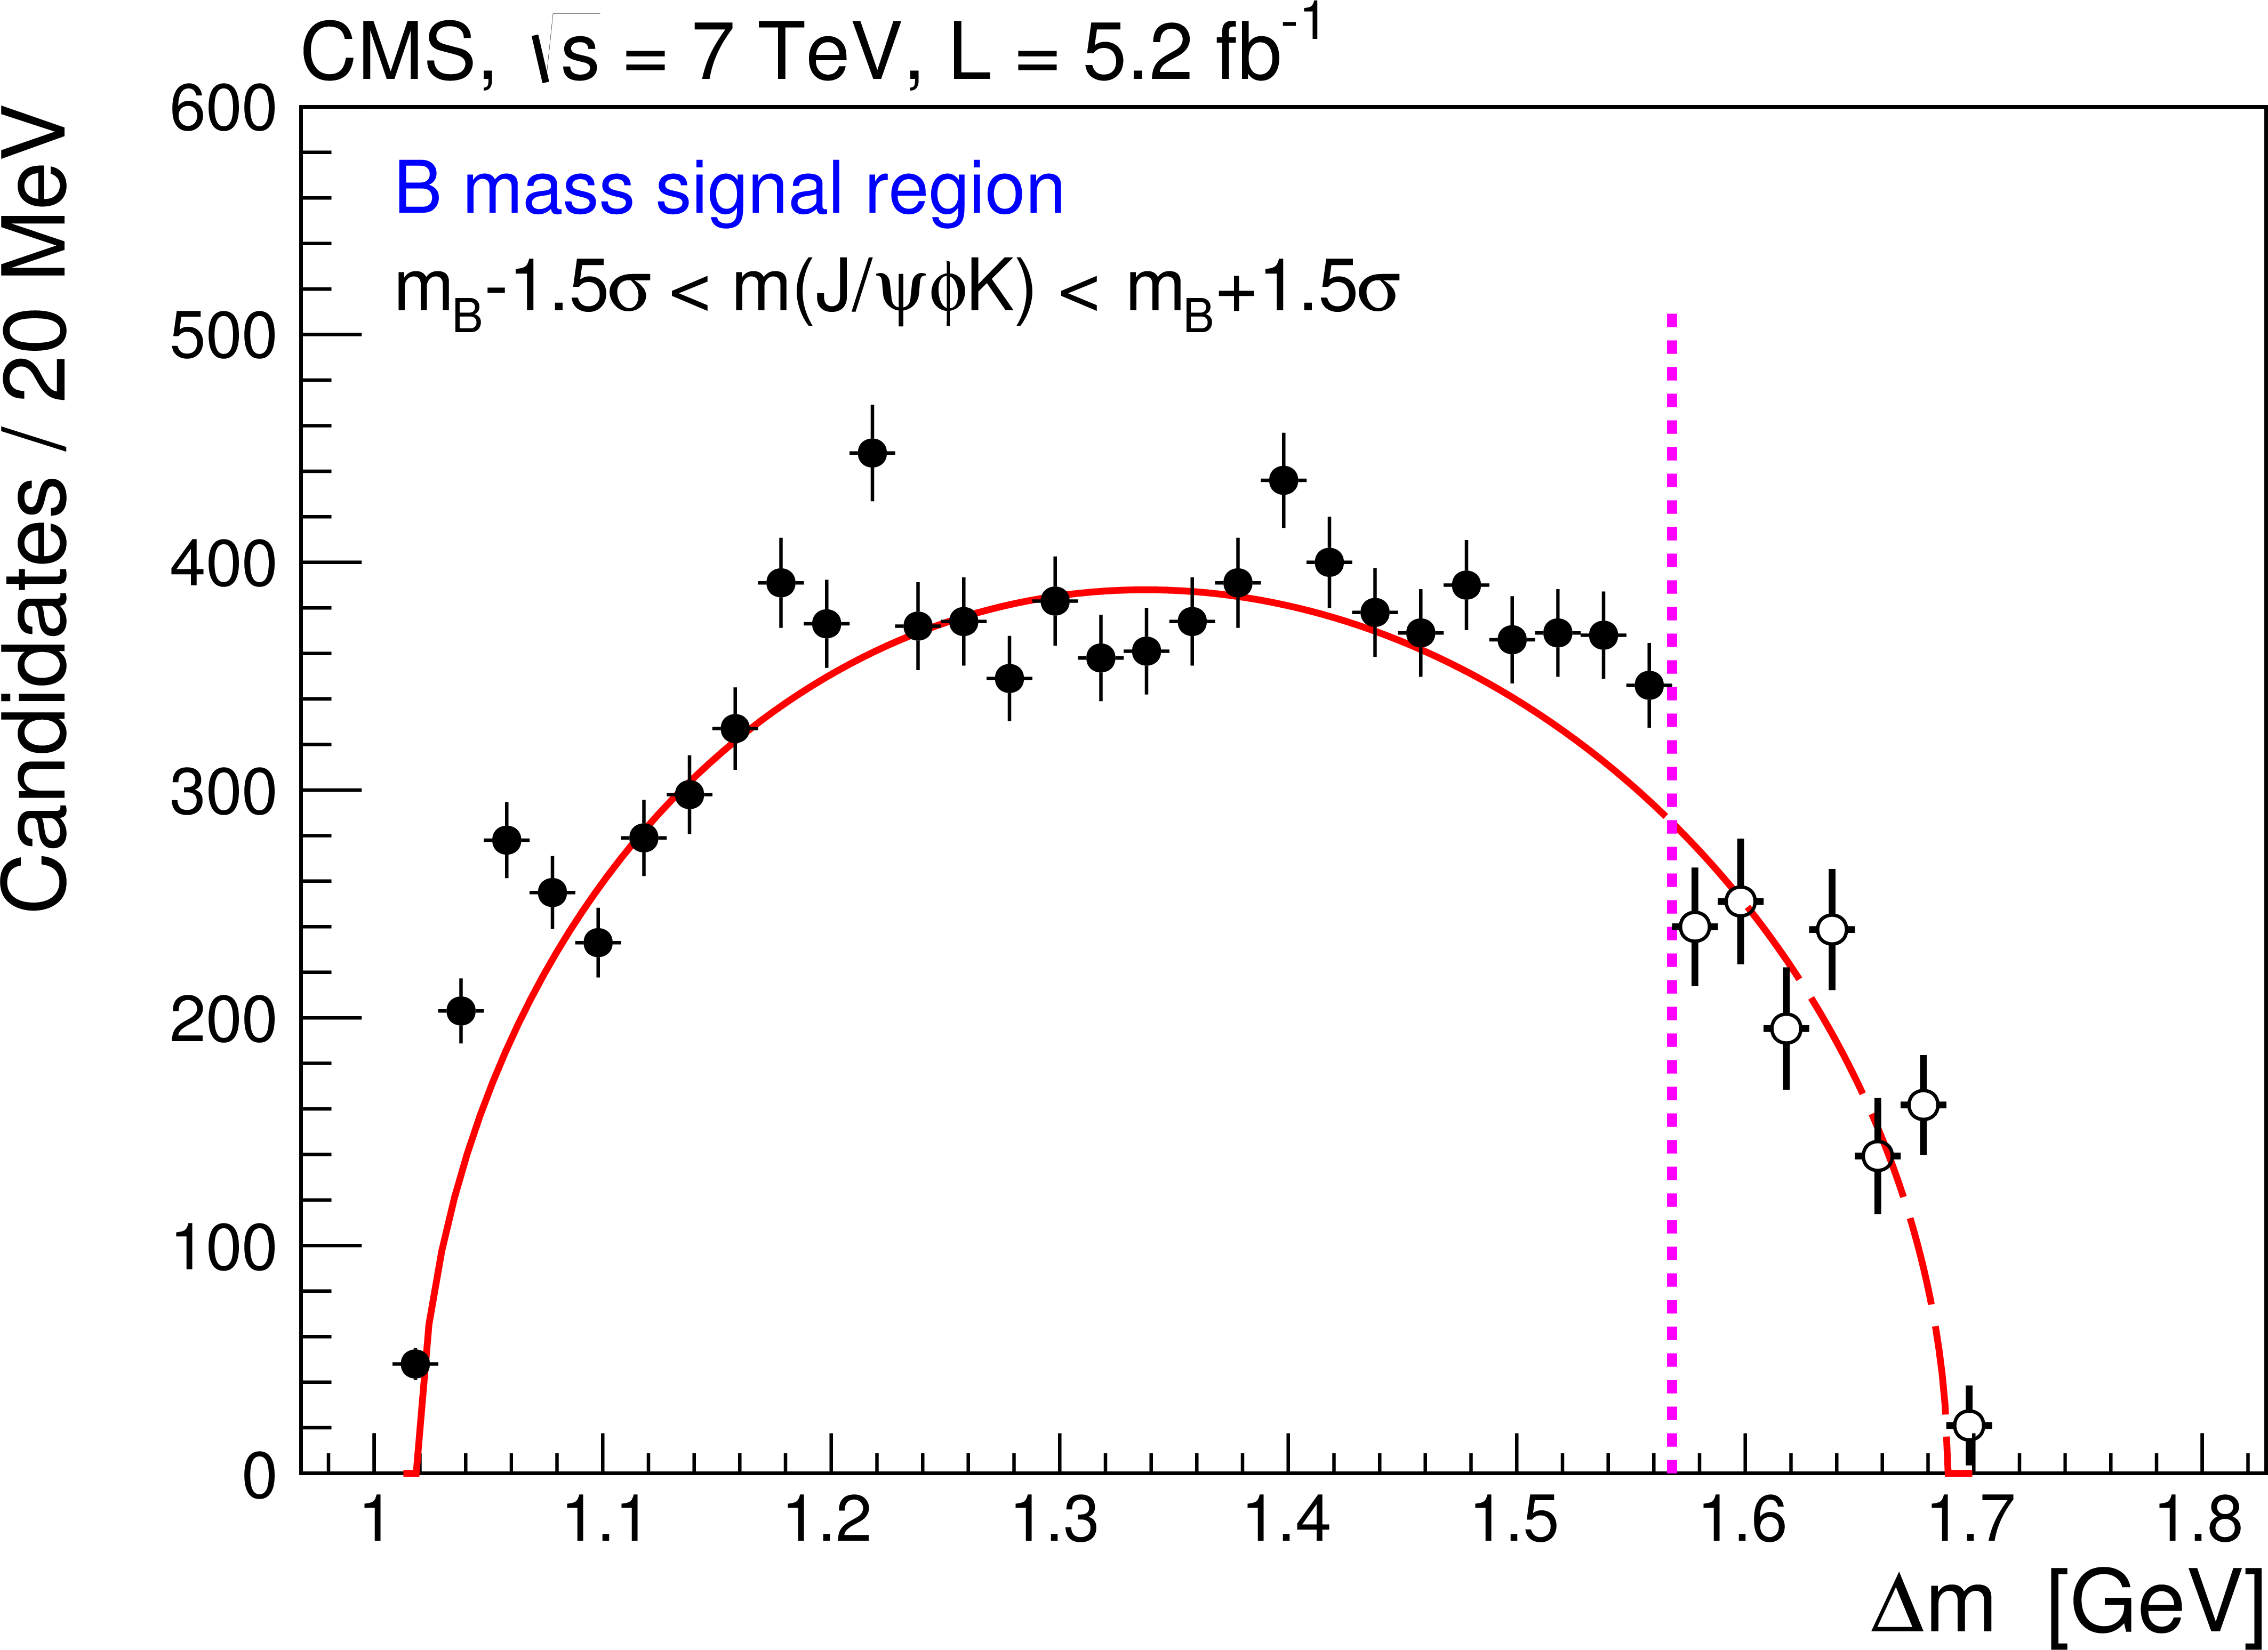
Figure 6:
The $\Delta m$ spectrum, including non-B candidates after subtracting the expected $ {\mathrm {B}^0_\mathrm {s}} $ contribution from simulation for candidate events with $ {\mathrm {J} \psi } \phi {\mathrm {K^+}}$ invariant mass within ${\pm }1.5\sigma $ ($\sigma =9.3$ MeV ) of the B nominal mass. The dashed vertical line indicates the boundary of the region eliminated from the analysis (the region to the right of the dashed line). The data points in the region to the left of the dashed line are from events used in the analysis and are represented by filled circles with error bars. The open circles in the region to the right of the dashed line are the result of subtracting the expected $ {\mathrm {B}^0_\mathrm {s}} $ background from simulation, and their uncertainties are correlated. The solid curve is the prediction for a three-body phase-space distribution, normalized to the total number of events in the left region, after subtracting the yields from the two low-mass peaking structures. The extrapolation of the phase-space prediction into the right-hand region is shown by the dashed curve. |
png pdf |
Figure 7:
The number of $\mathrm {B}^+\rightarrow {\mathrm {J} \psi } \phi \mathrm {K}^+$ candidates as a function of $\Delta m$. The filled circles to the left of the vertical dashed line are results used in the analysis. The solid curve is the result of the global fit described in the text. The points and the curve are a repeat of those in Fig.3. The open circles to the right of the vertical dashed line are extracted in the seven bins of the previously eliminated $\Delta m$ region, after subtraction of the predicted $ {\mathrm {B}^0_\mathrm {s}} $ background from simulation. The short-dashed curve represents the prediction from three-body phase-space for the nonresonant background, normalized to the number of expected background events in the region to the left of the vertical dashed line. The long-dashed curve is an extrapolation of this prediction into the previously eliminated region. |
|
|
Compact Muon Solenoid LHC, CERN |
|

|

|

|

|

|