

Compact Muon Solenoid
LHC, CERN
| CMS-EXO-12-007 ; CERN-PH-EP-2015-119 | ||
| Search for neutral color-octet weak-triplet scalar particles in proton-proton collisions at $\sqrt{s} =$ 8 TeV | ||
| CMS Collaboration | ||
| 29 May 2015 | ||
| J. High Energy Phys. 09 (2015) 201 | ||
| Abstract: A search for pair production of neutral color-octet weak-triplet scalar particles ($\Theta^{0}$) is performed in processes where one $\Theta^{0}$ decays to a pair of b quark jets and the other to a Z boson plus a jet, with the Z boson decaying to a pair of electrons or muons. The search is performed with data collected by the CMS experiment at the CERN LHC corresponding to an integrated luminosity of 19.7 fb$^{-1}$ of proton-proton collisions at $\sqrt{s} =$ 8 TeV. The number of observed events is found to be in agreement with the standard model predictions. The 95% confidence level upper limit on the product of the cross section and branching fraction is obtained as a function of the $\Theta^{0}$ mass. The 95% confidence level lower bounds on the $\Theta^{0}$ mass are found to be 623 and 426 GeV, for two different octo-triplet theoretical scenarios. These are the first direct experimental bounds on particles predicted by the octo-triplet model. | ||
| Links: e-print arXiv:1505.08118 [hep-ex] (PDF) ; CDS record ; inSPIRE record ; Public twiki page ; CADI line (restricted) ; | ||
| Figures | |
png pdf |
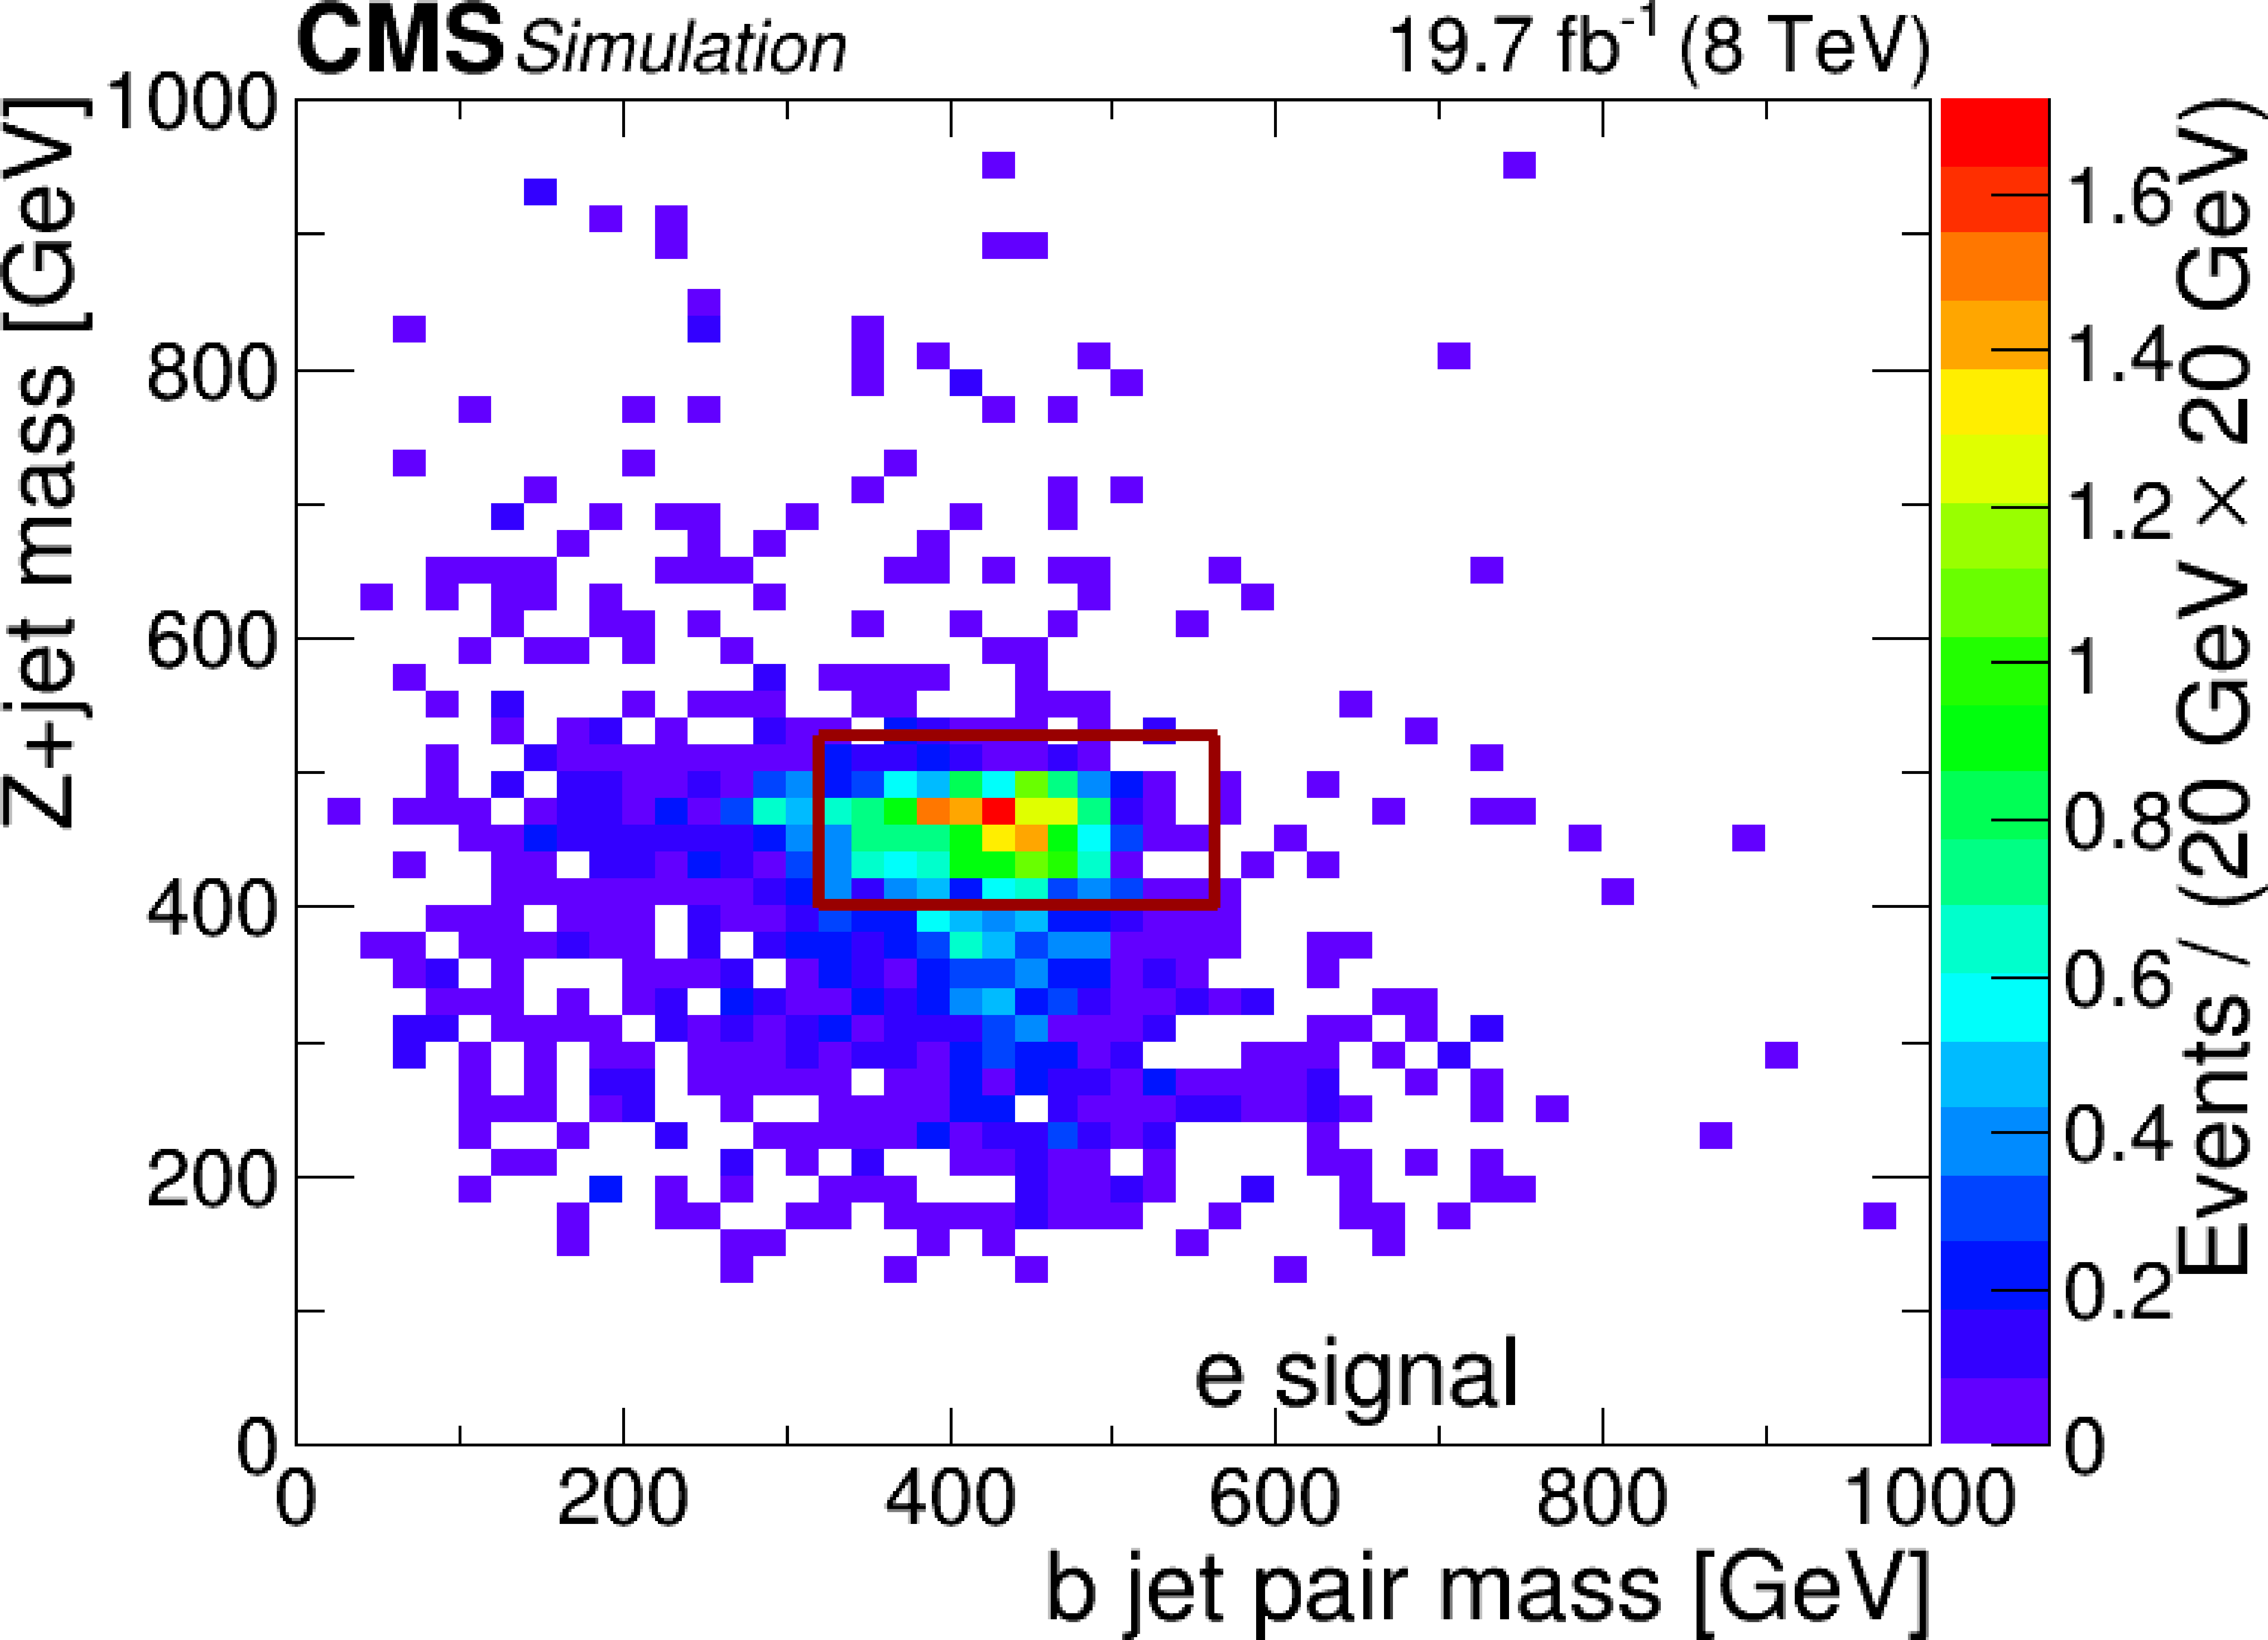
Figure 3-a:
Distributions of Z+jet mass versus b jet pair mass for signal events with $m_{G'} =$ 1100 GeV and $m_{\Theta ^{0}} =$ 478 GeV (a) and background events (b), in the electron channel (distributions are similar in the muon channel). The open red rectangle on left indicates the signal region, as described in the text. |
png pdf |
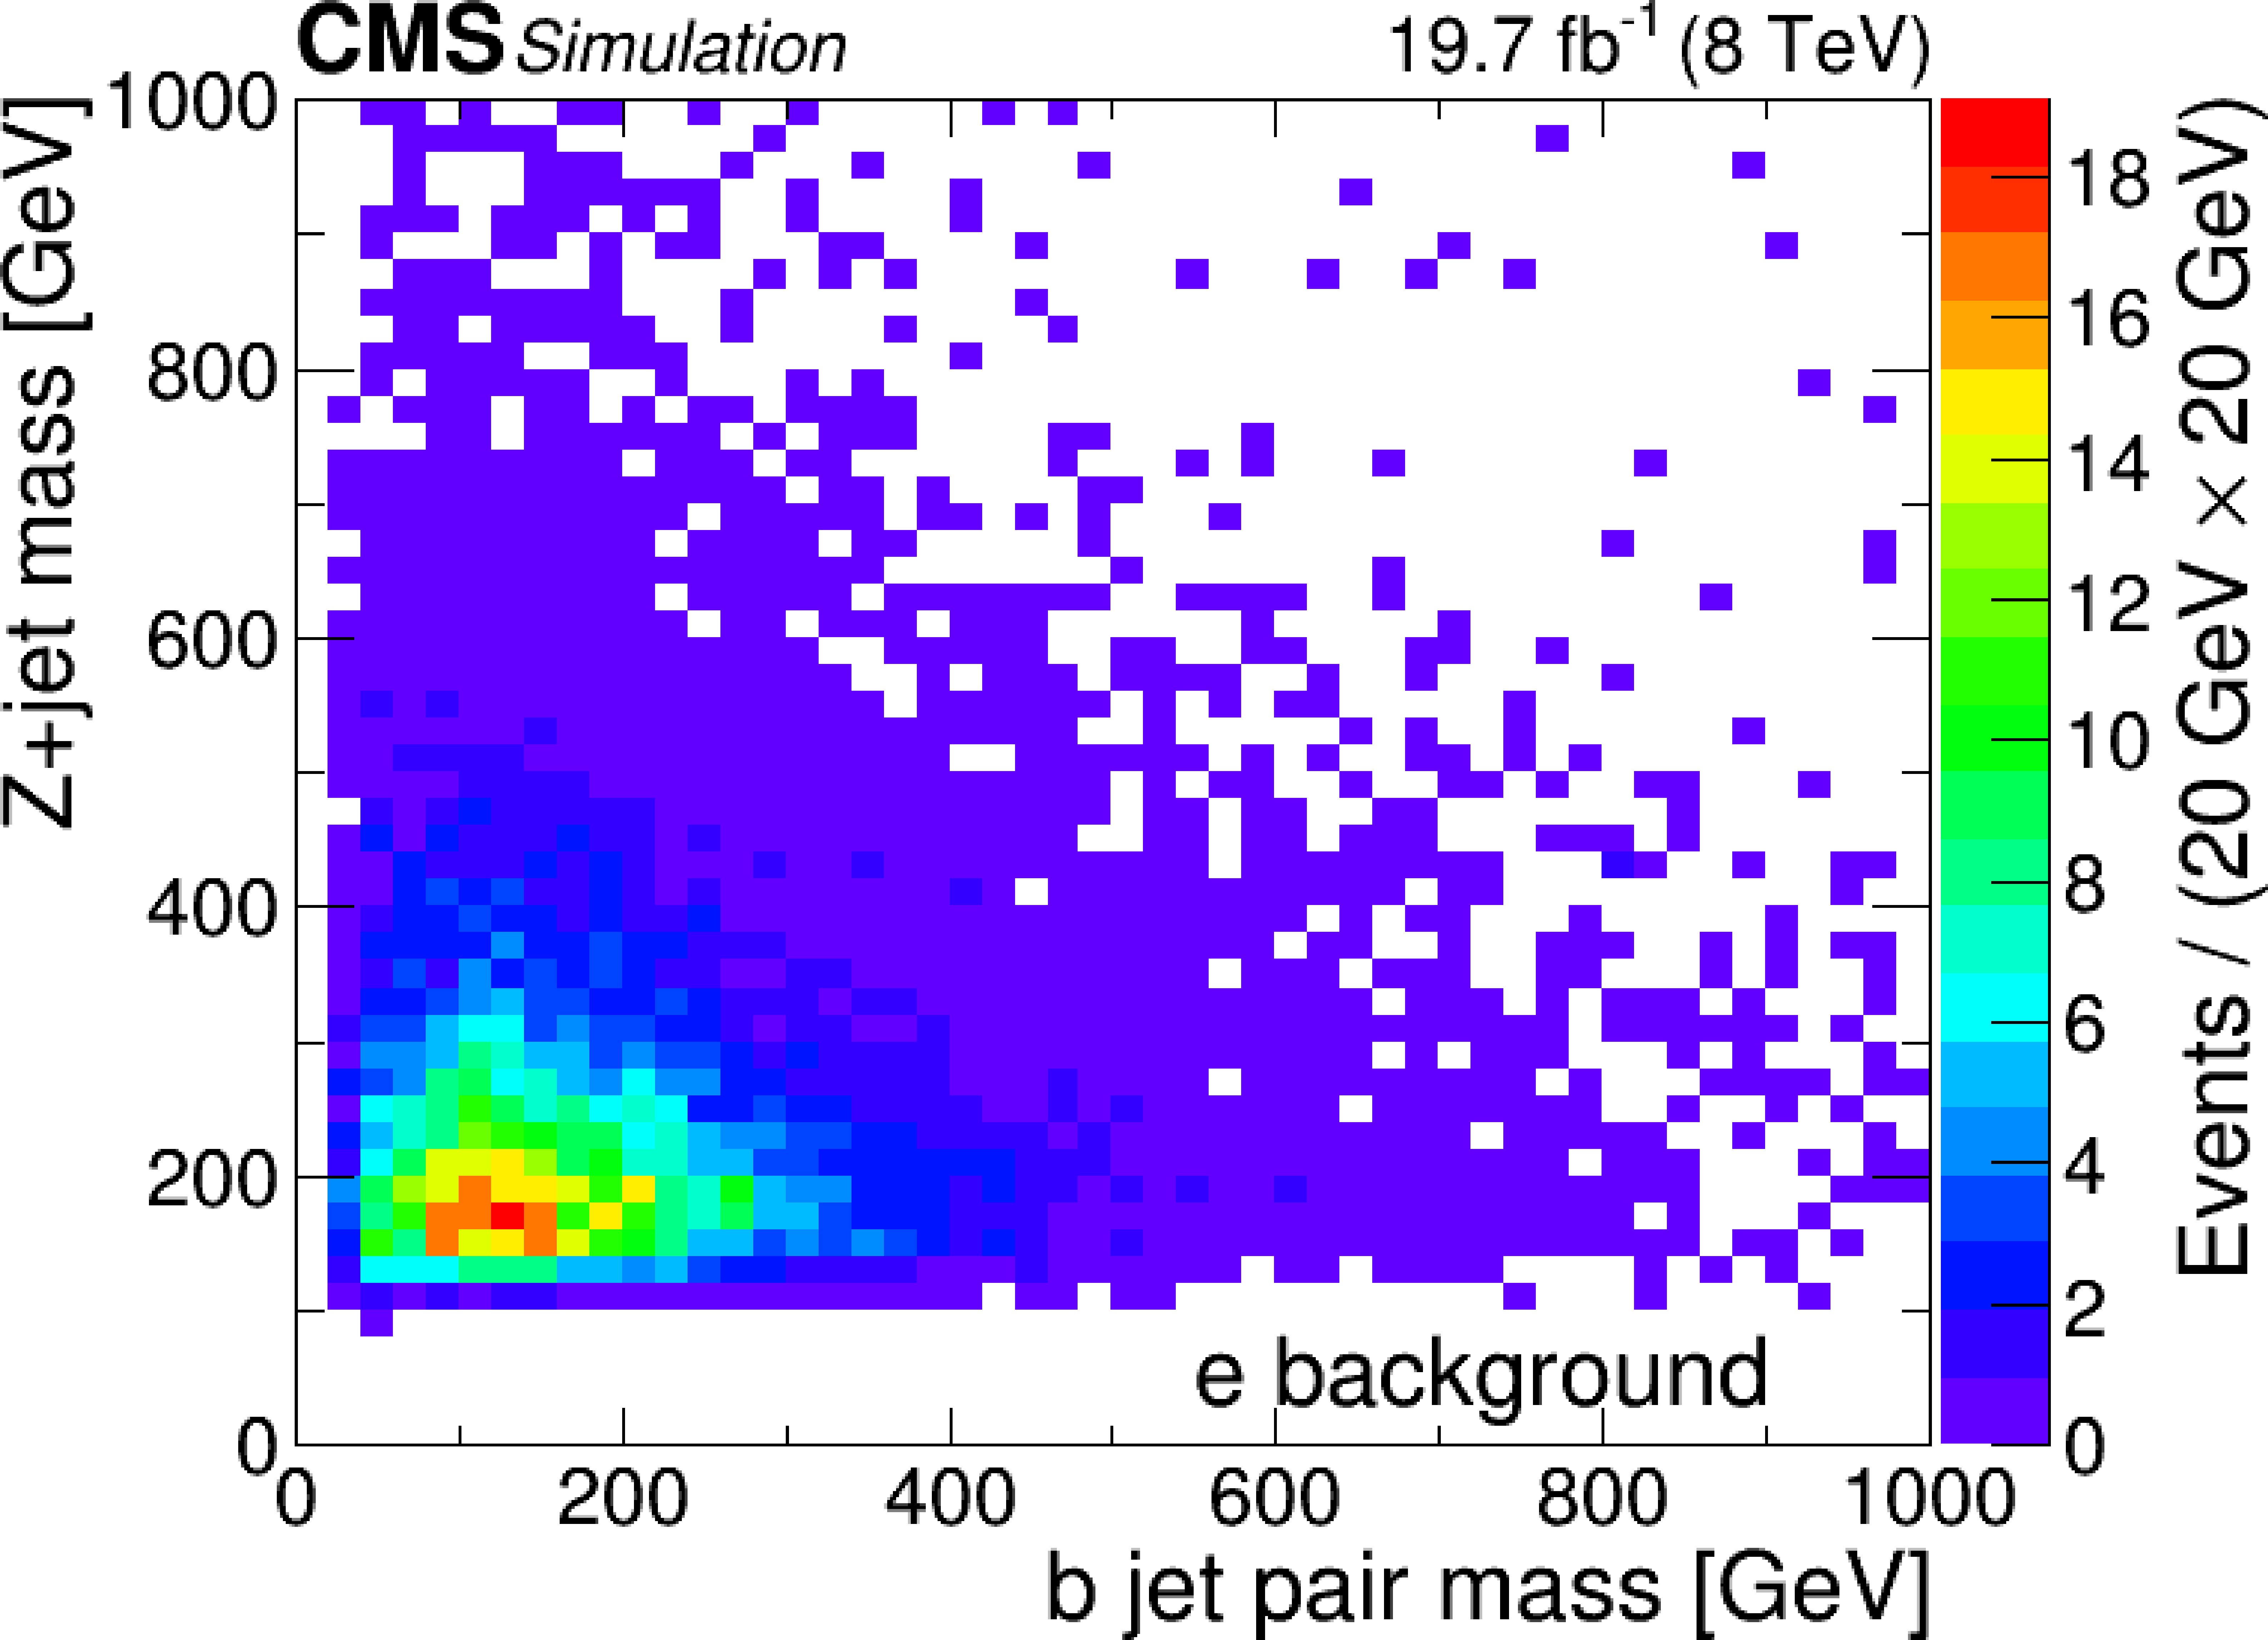
Figure 3-b:
Distributions of Z+jet mass versus b jet pair mass for signal events with $m_{G'} =$ 1100 GeV and $m_{\Theta ^{0}} =$ 478 GeV (a) and background events (b), in the electron channel (distributions are similar in the muon channel). The open red rectangle on left indicates the signal region, as described in the text. |
png pdf |
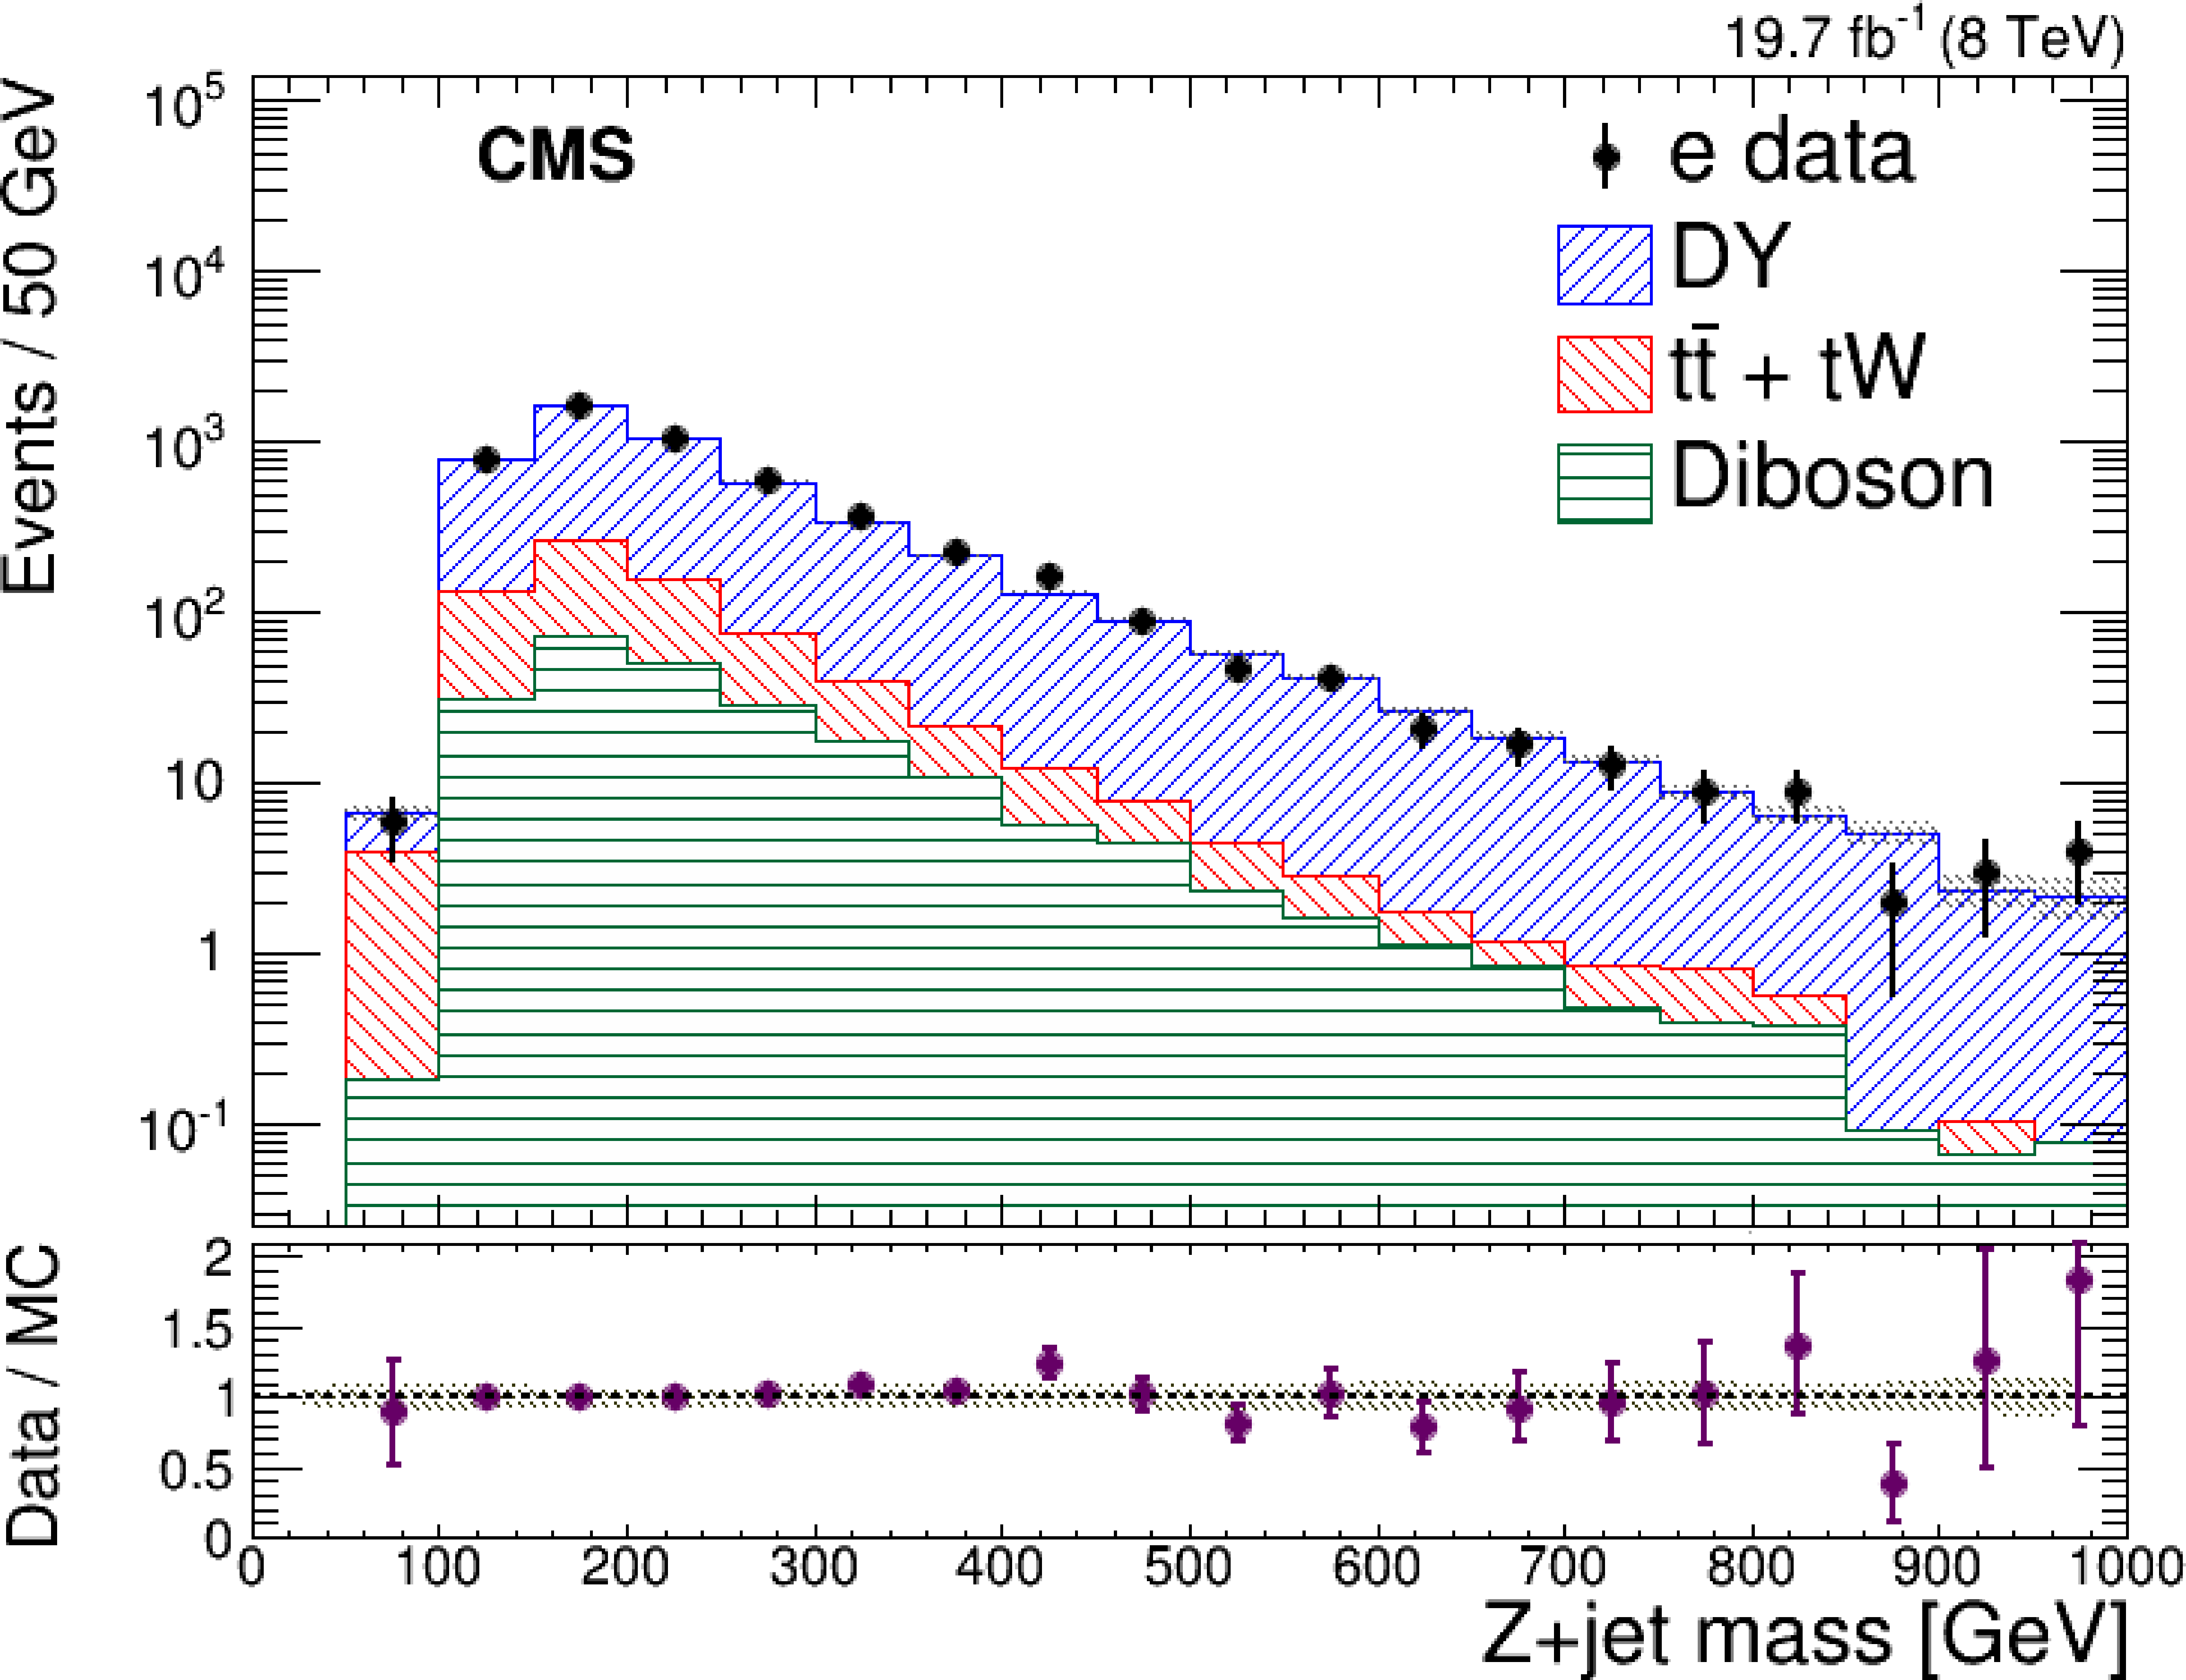
Figure 4-a:
The Z+jet mass distribution in the Z+$\ge 3$jet (one b tag) control region after the appropriate correction factor has been applied, for the electron channel (a) and muon channel (b). The panels at the bottom show the ratio of data to background simulation, with the band representing the systematic uncertainty. |
png pdf |
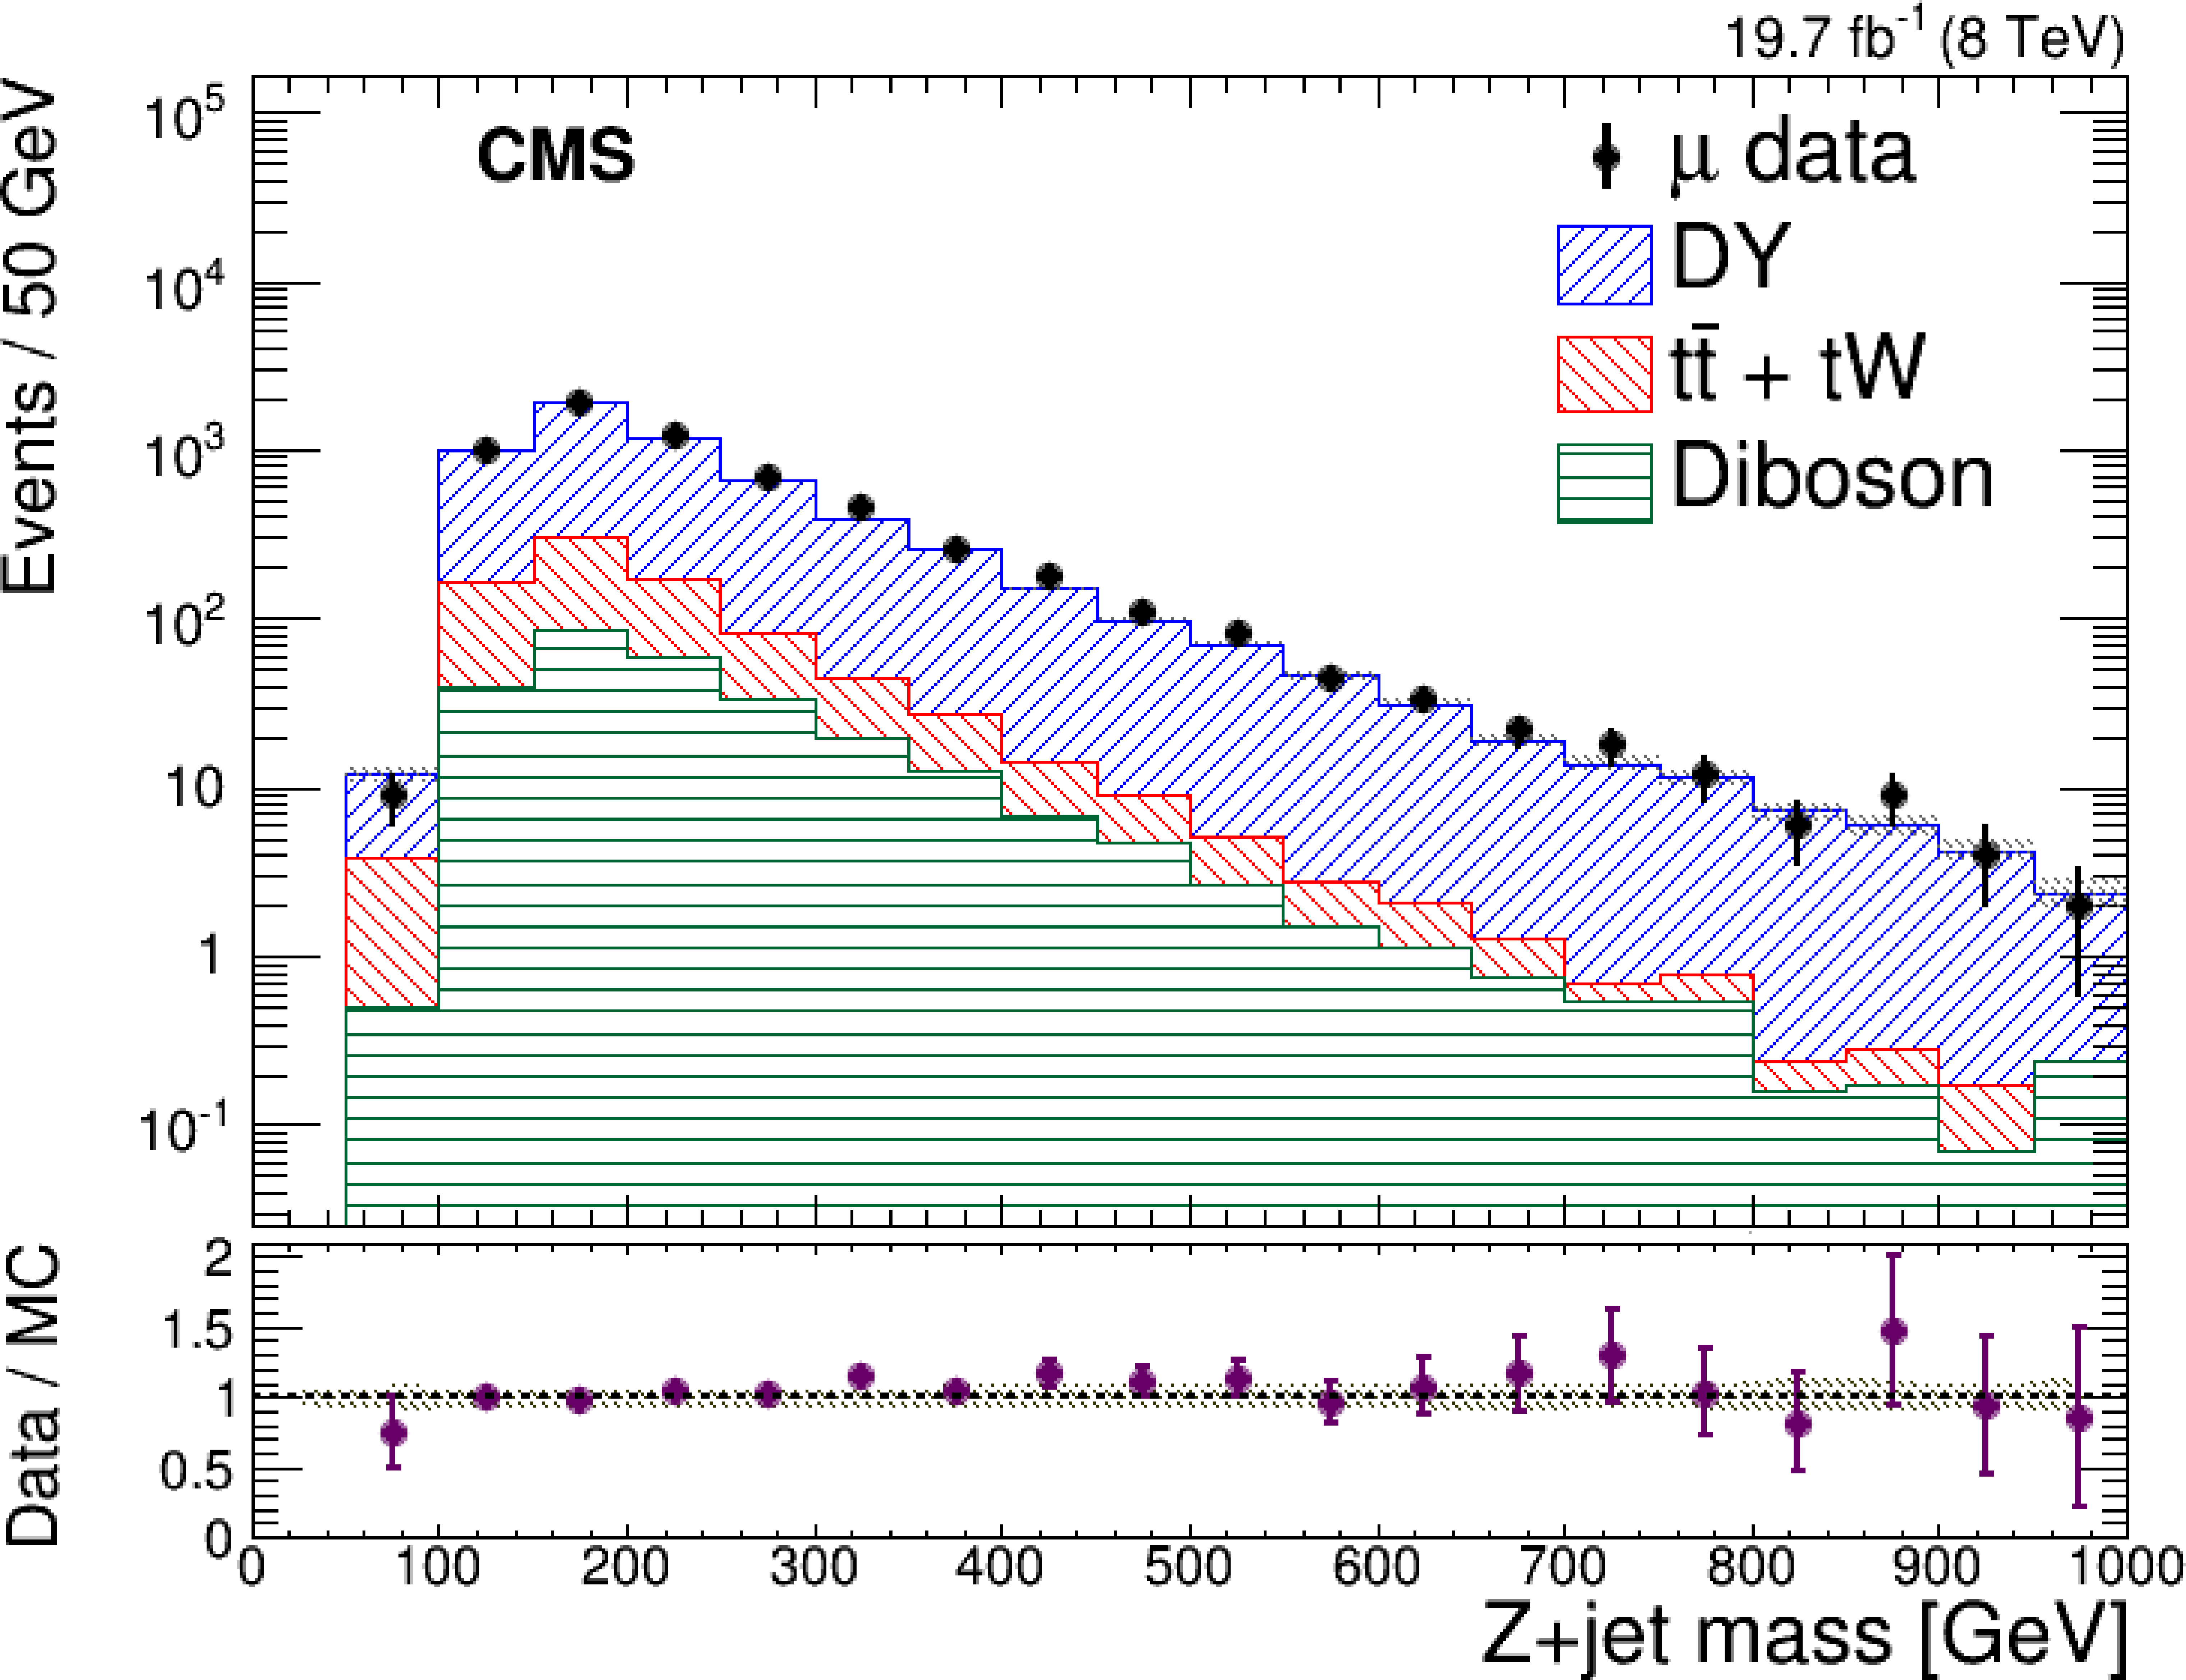
Figure 4-b:
The Z+jet mass distribution in the Z+$\ge 3$jet (one b tag) control region after the appropriate correction factor has been applied, for the electron channel (a) and muon channel (b). The panels at the bottom show the ratio of data to background simulation, with the band representing the systematic uncertainty. |
png pdf |
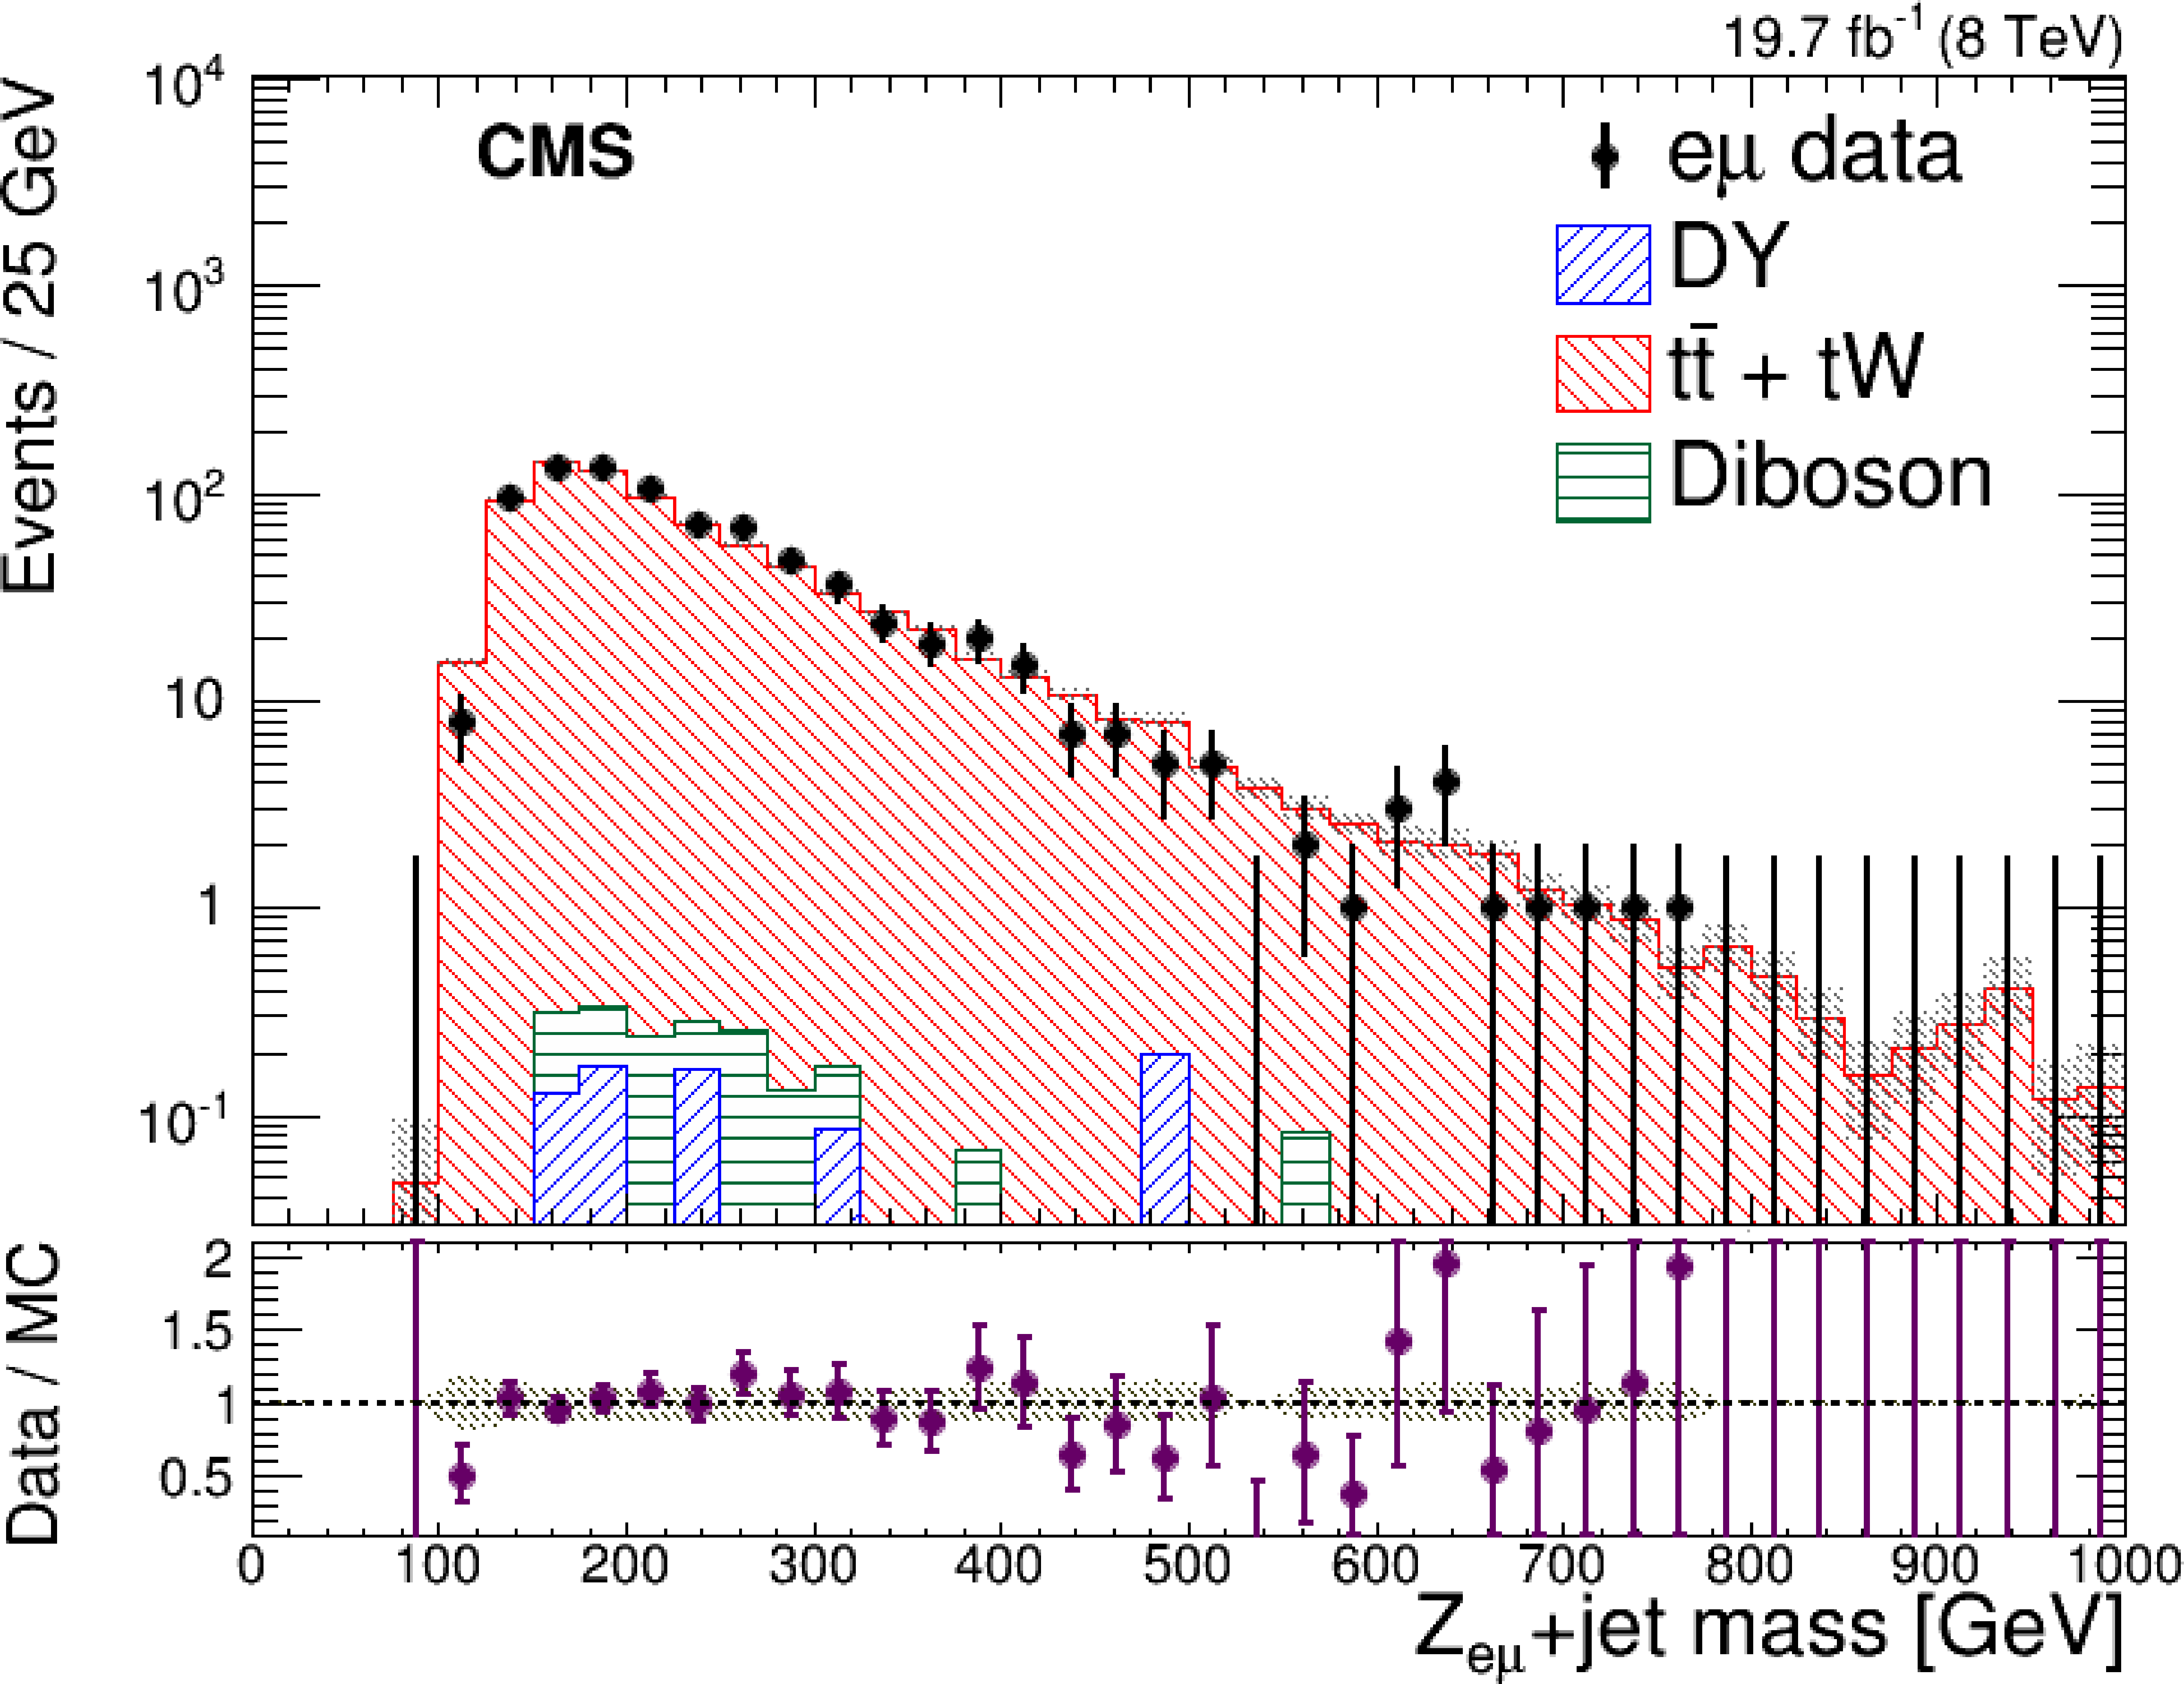
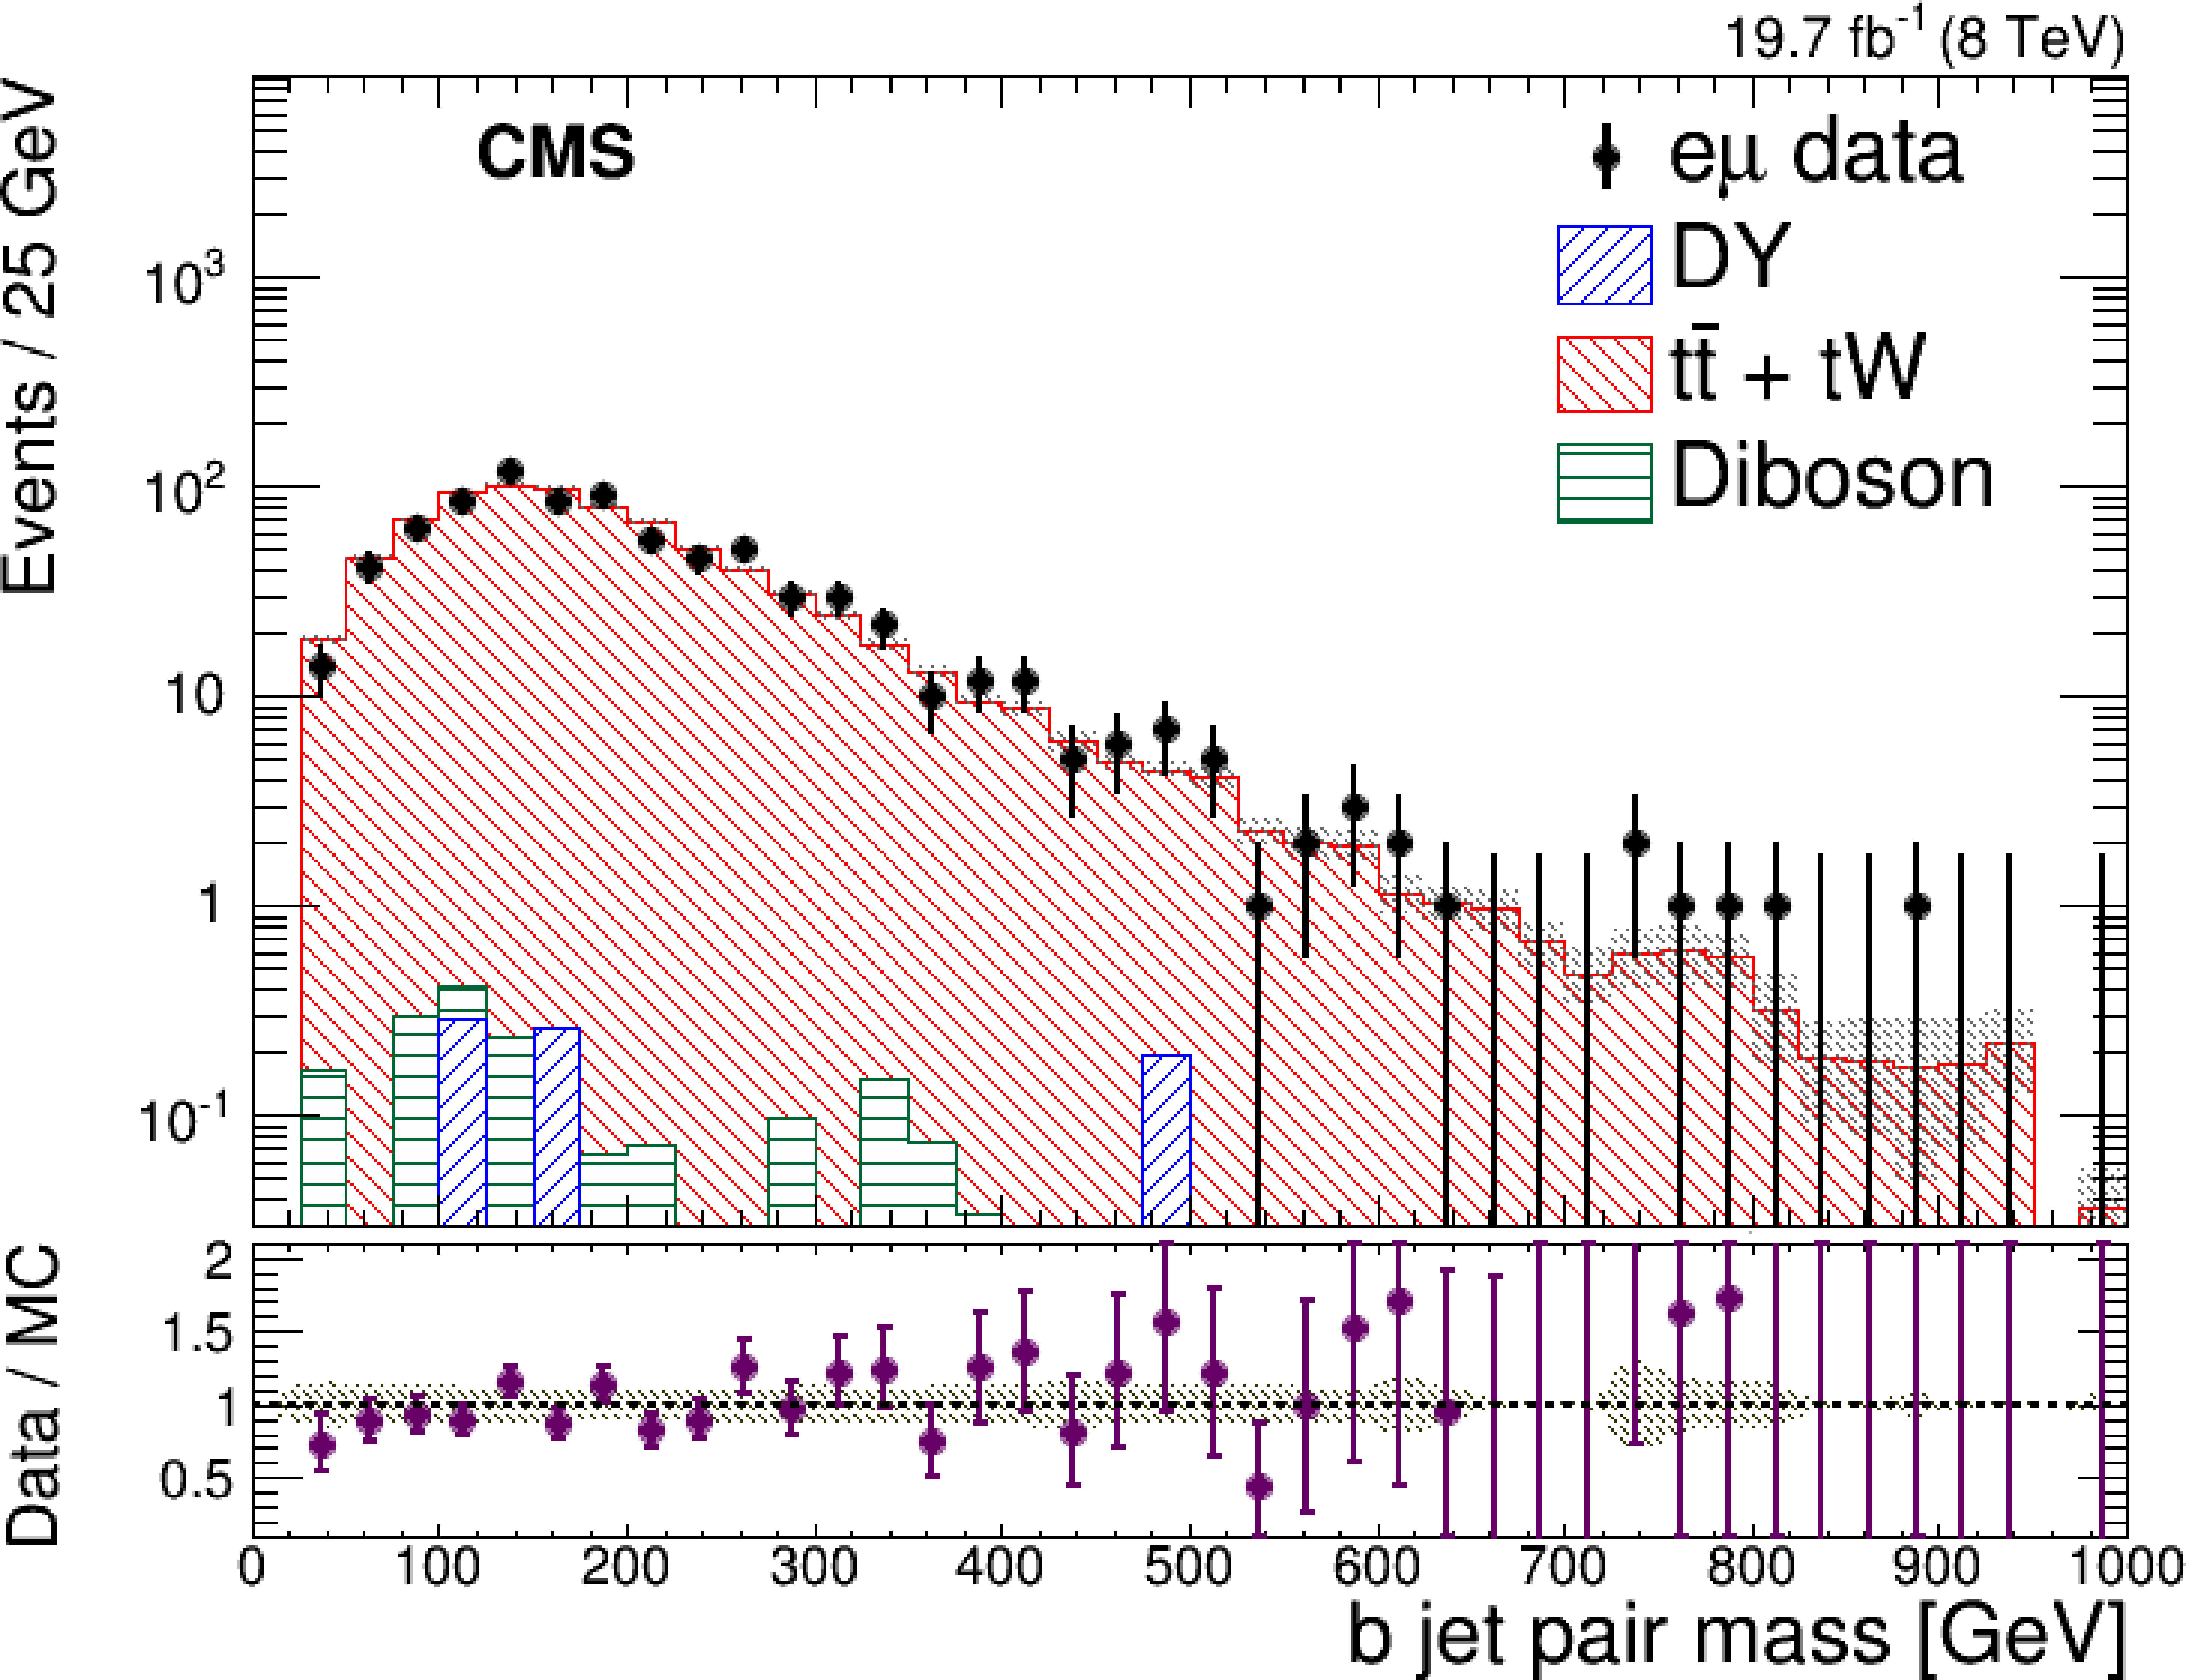
Figure 5-a:
The Z$_{ {\mathrm {e}}\mu }$+jet (a) and b jet pair mass (b) distributions in the $ \mathrm {t \bar{t}} $ control region after the appropriate correction factor is applied. The panels at the bottom show the ratio of data to background simulation, with the band representing the systematic uncertainty. |
png pdf |
Figure 5-b:
The Z$_{ {\mathrm {e}}\mu }$+jet (a) and b jet pair mass (b) distributions in the $ \mathrm {t \bar{t}} $ control region after the appropriate correction factor is applied. The panels at the bottom show the ratio of data to background simulation, with the band representing the systematic uncertainty. |
png pdf |
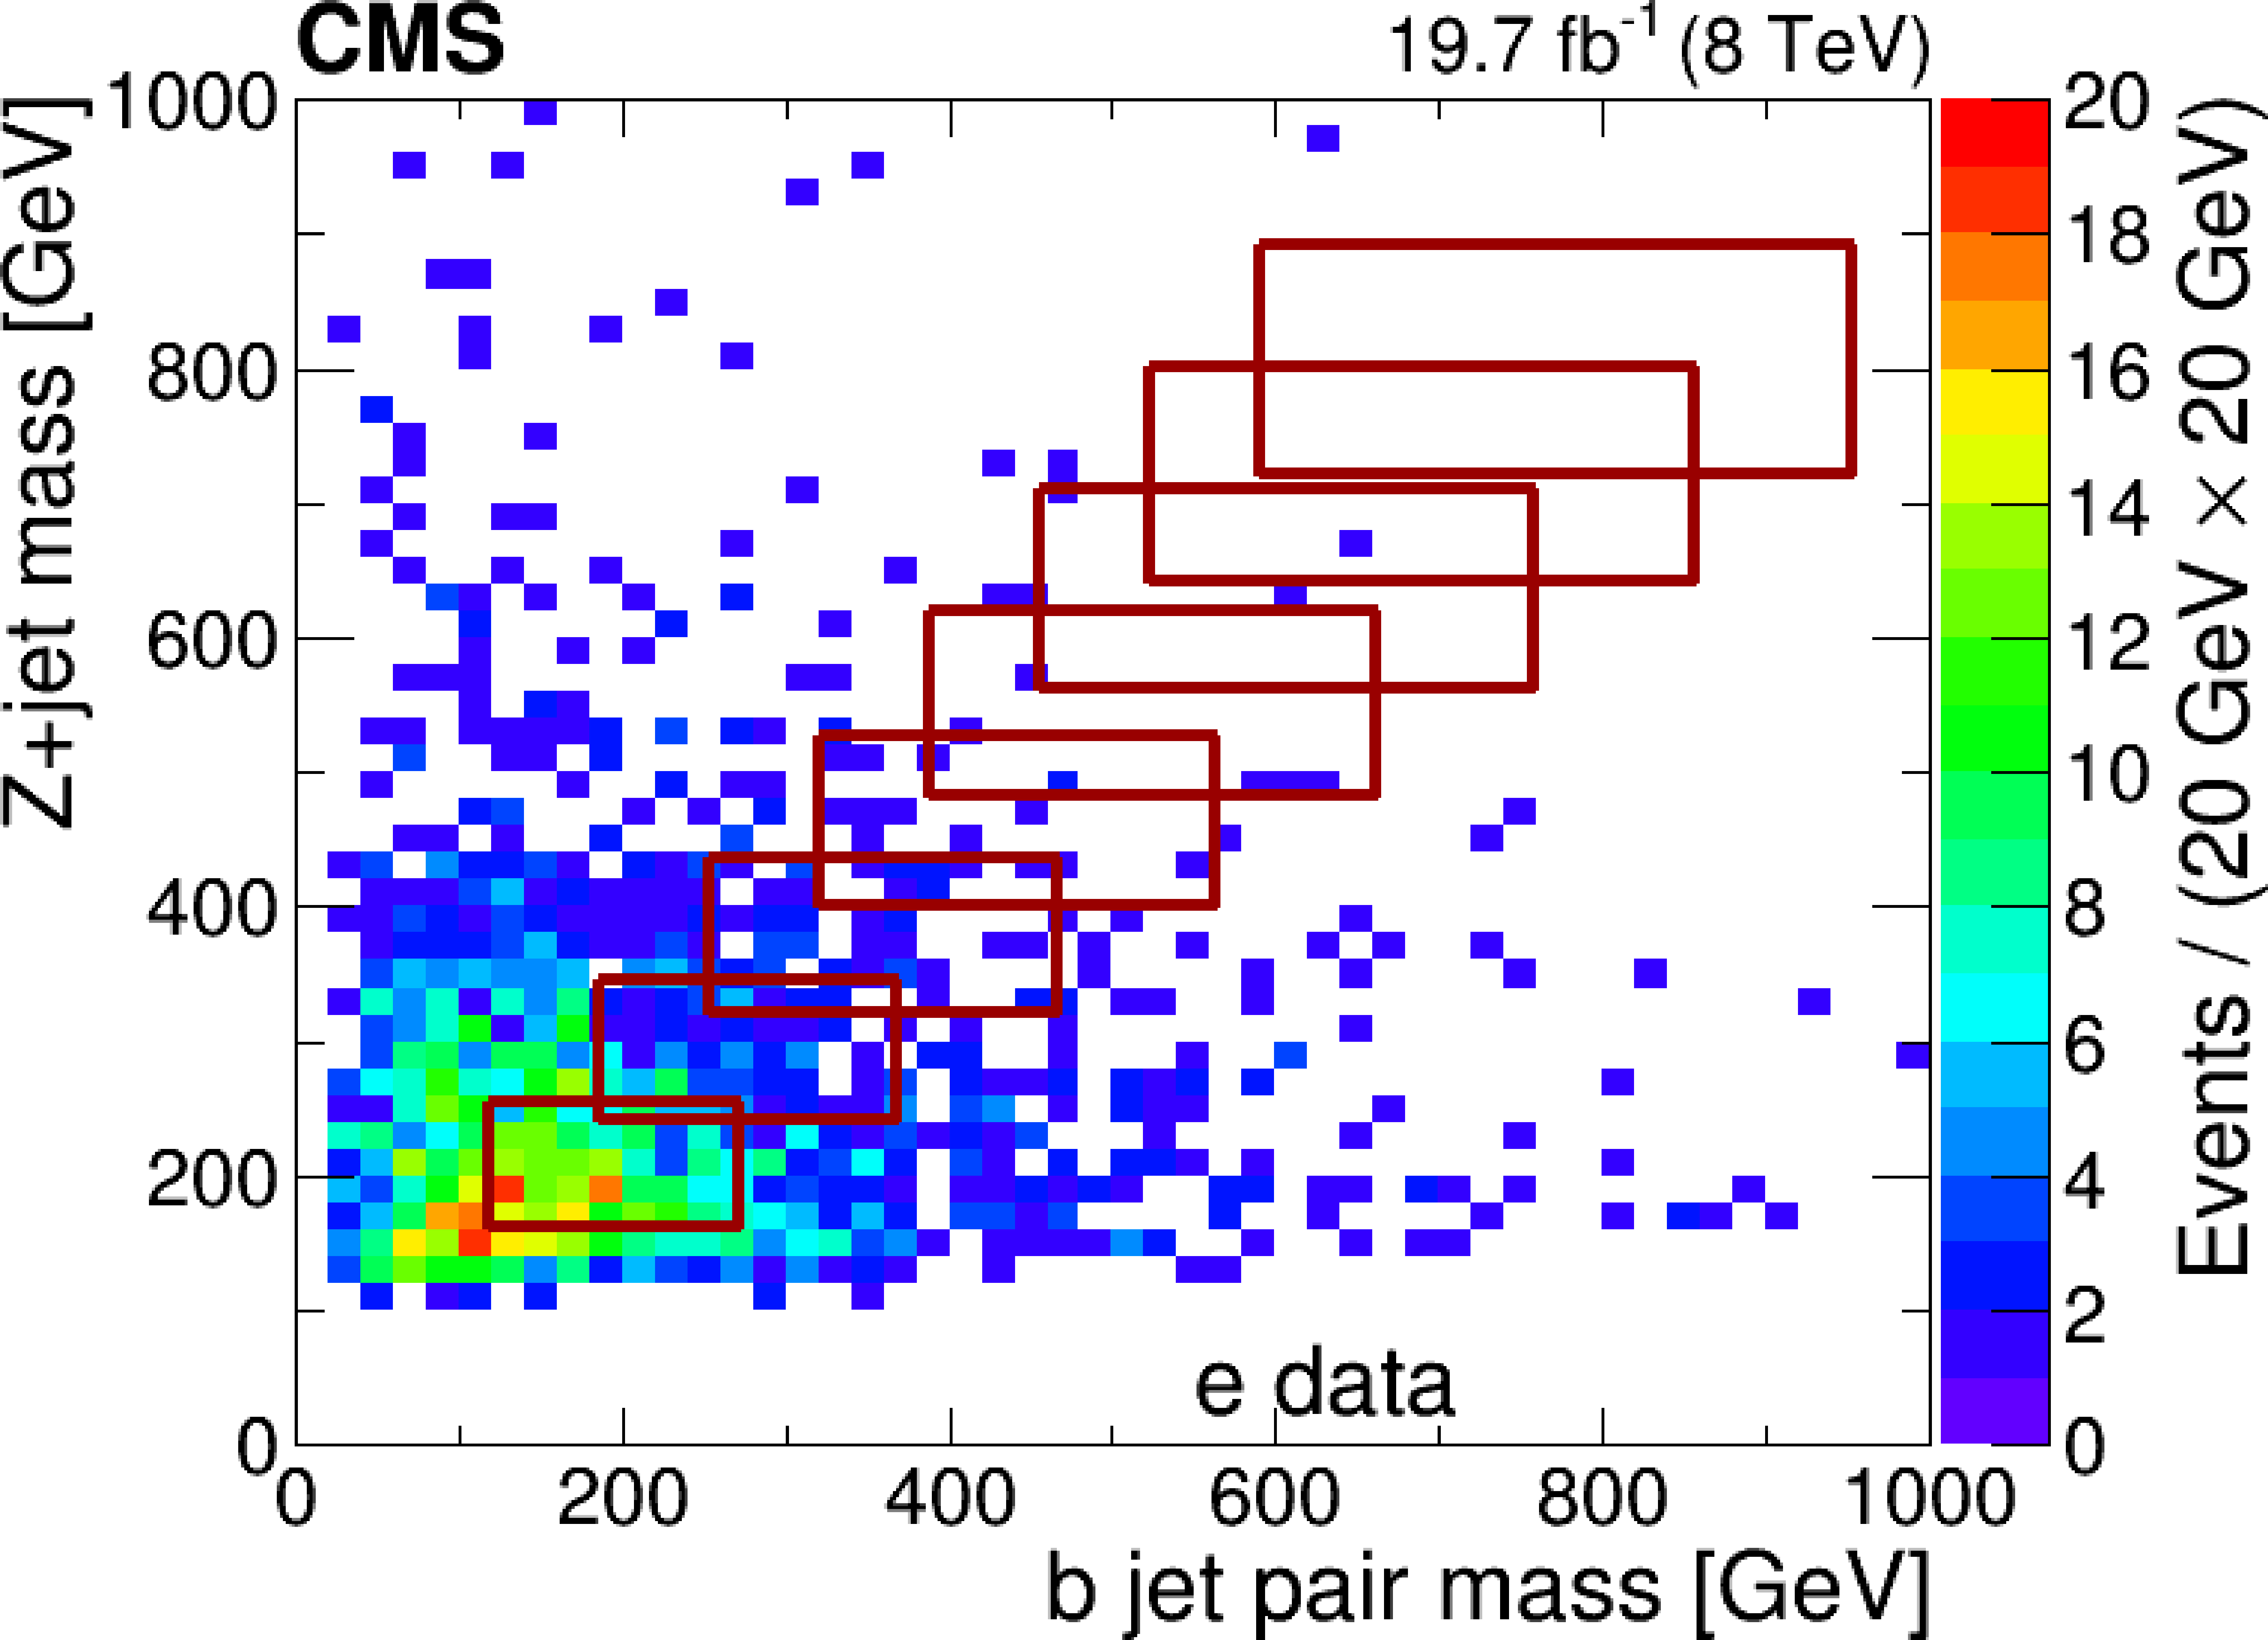
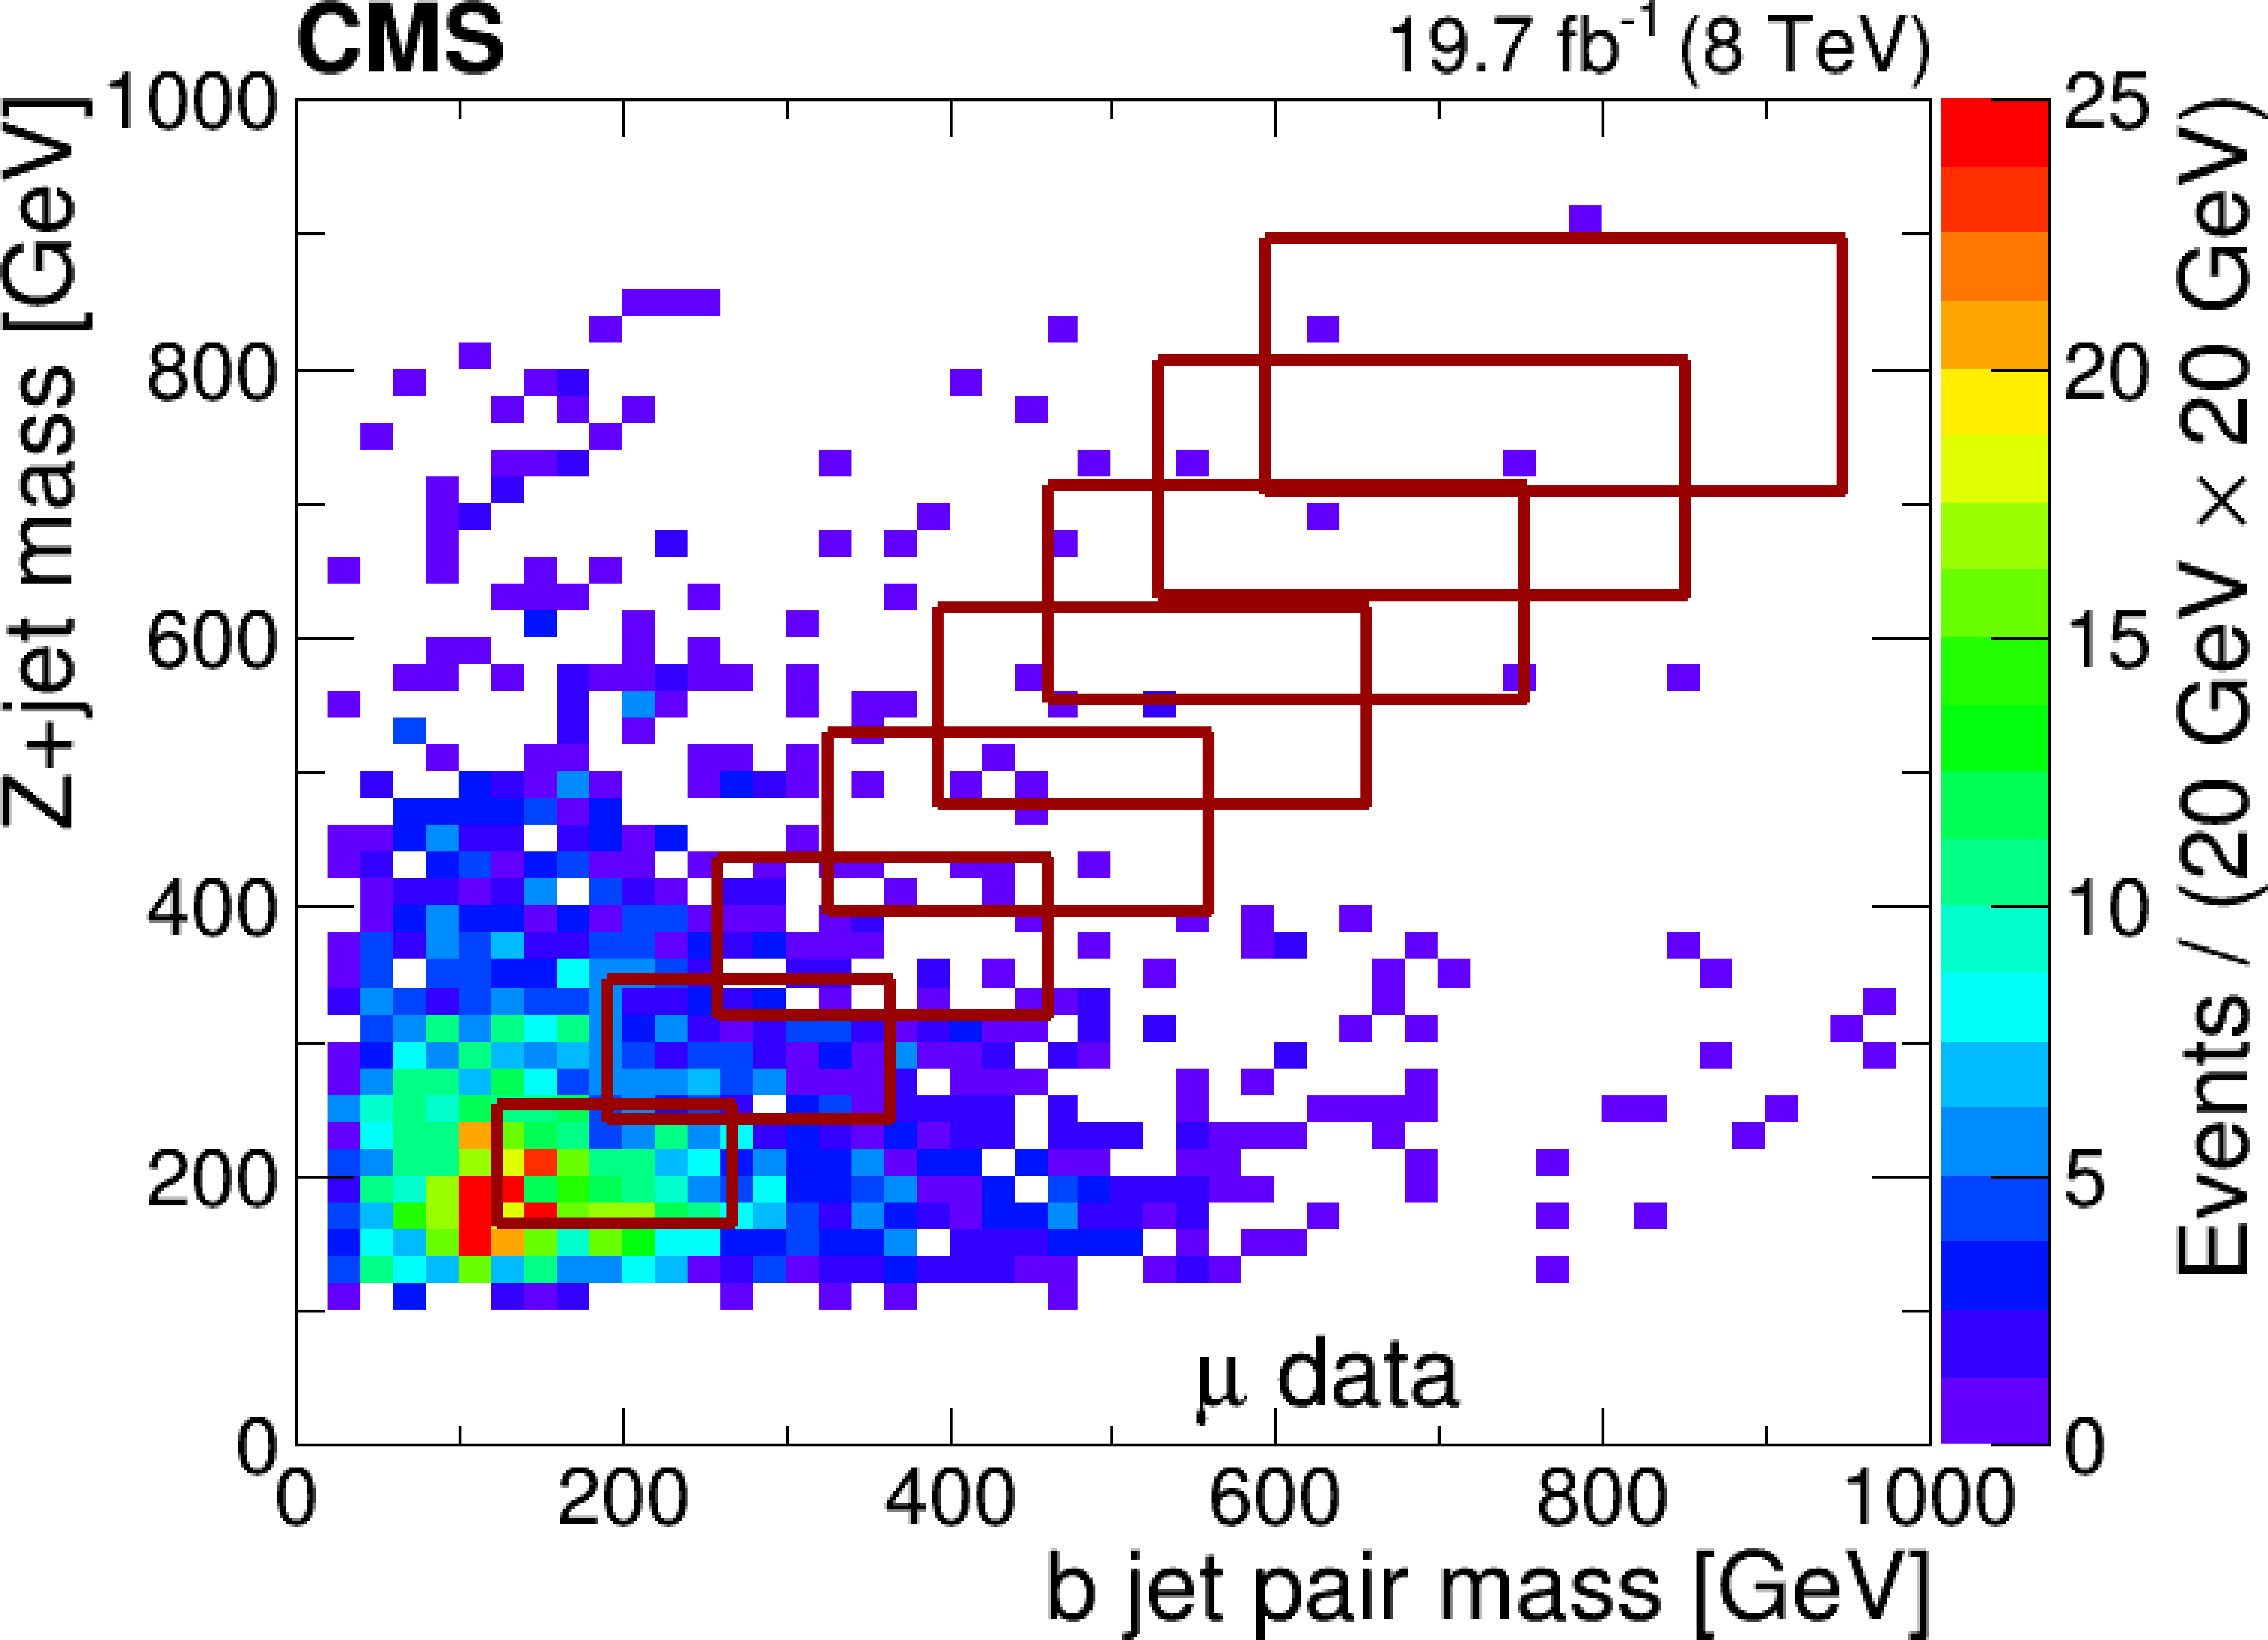
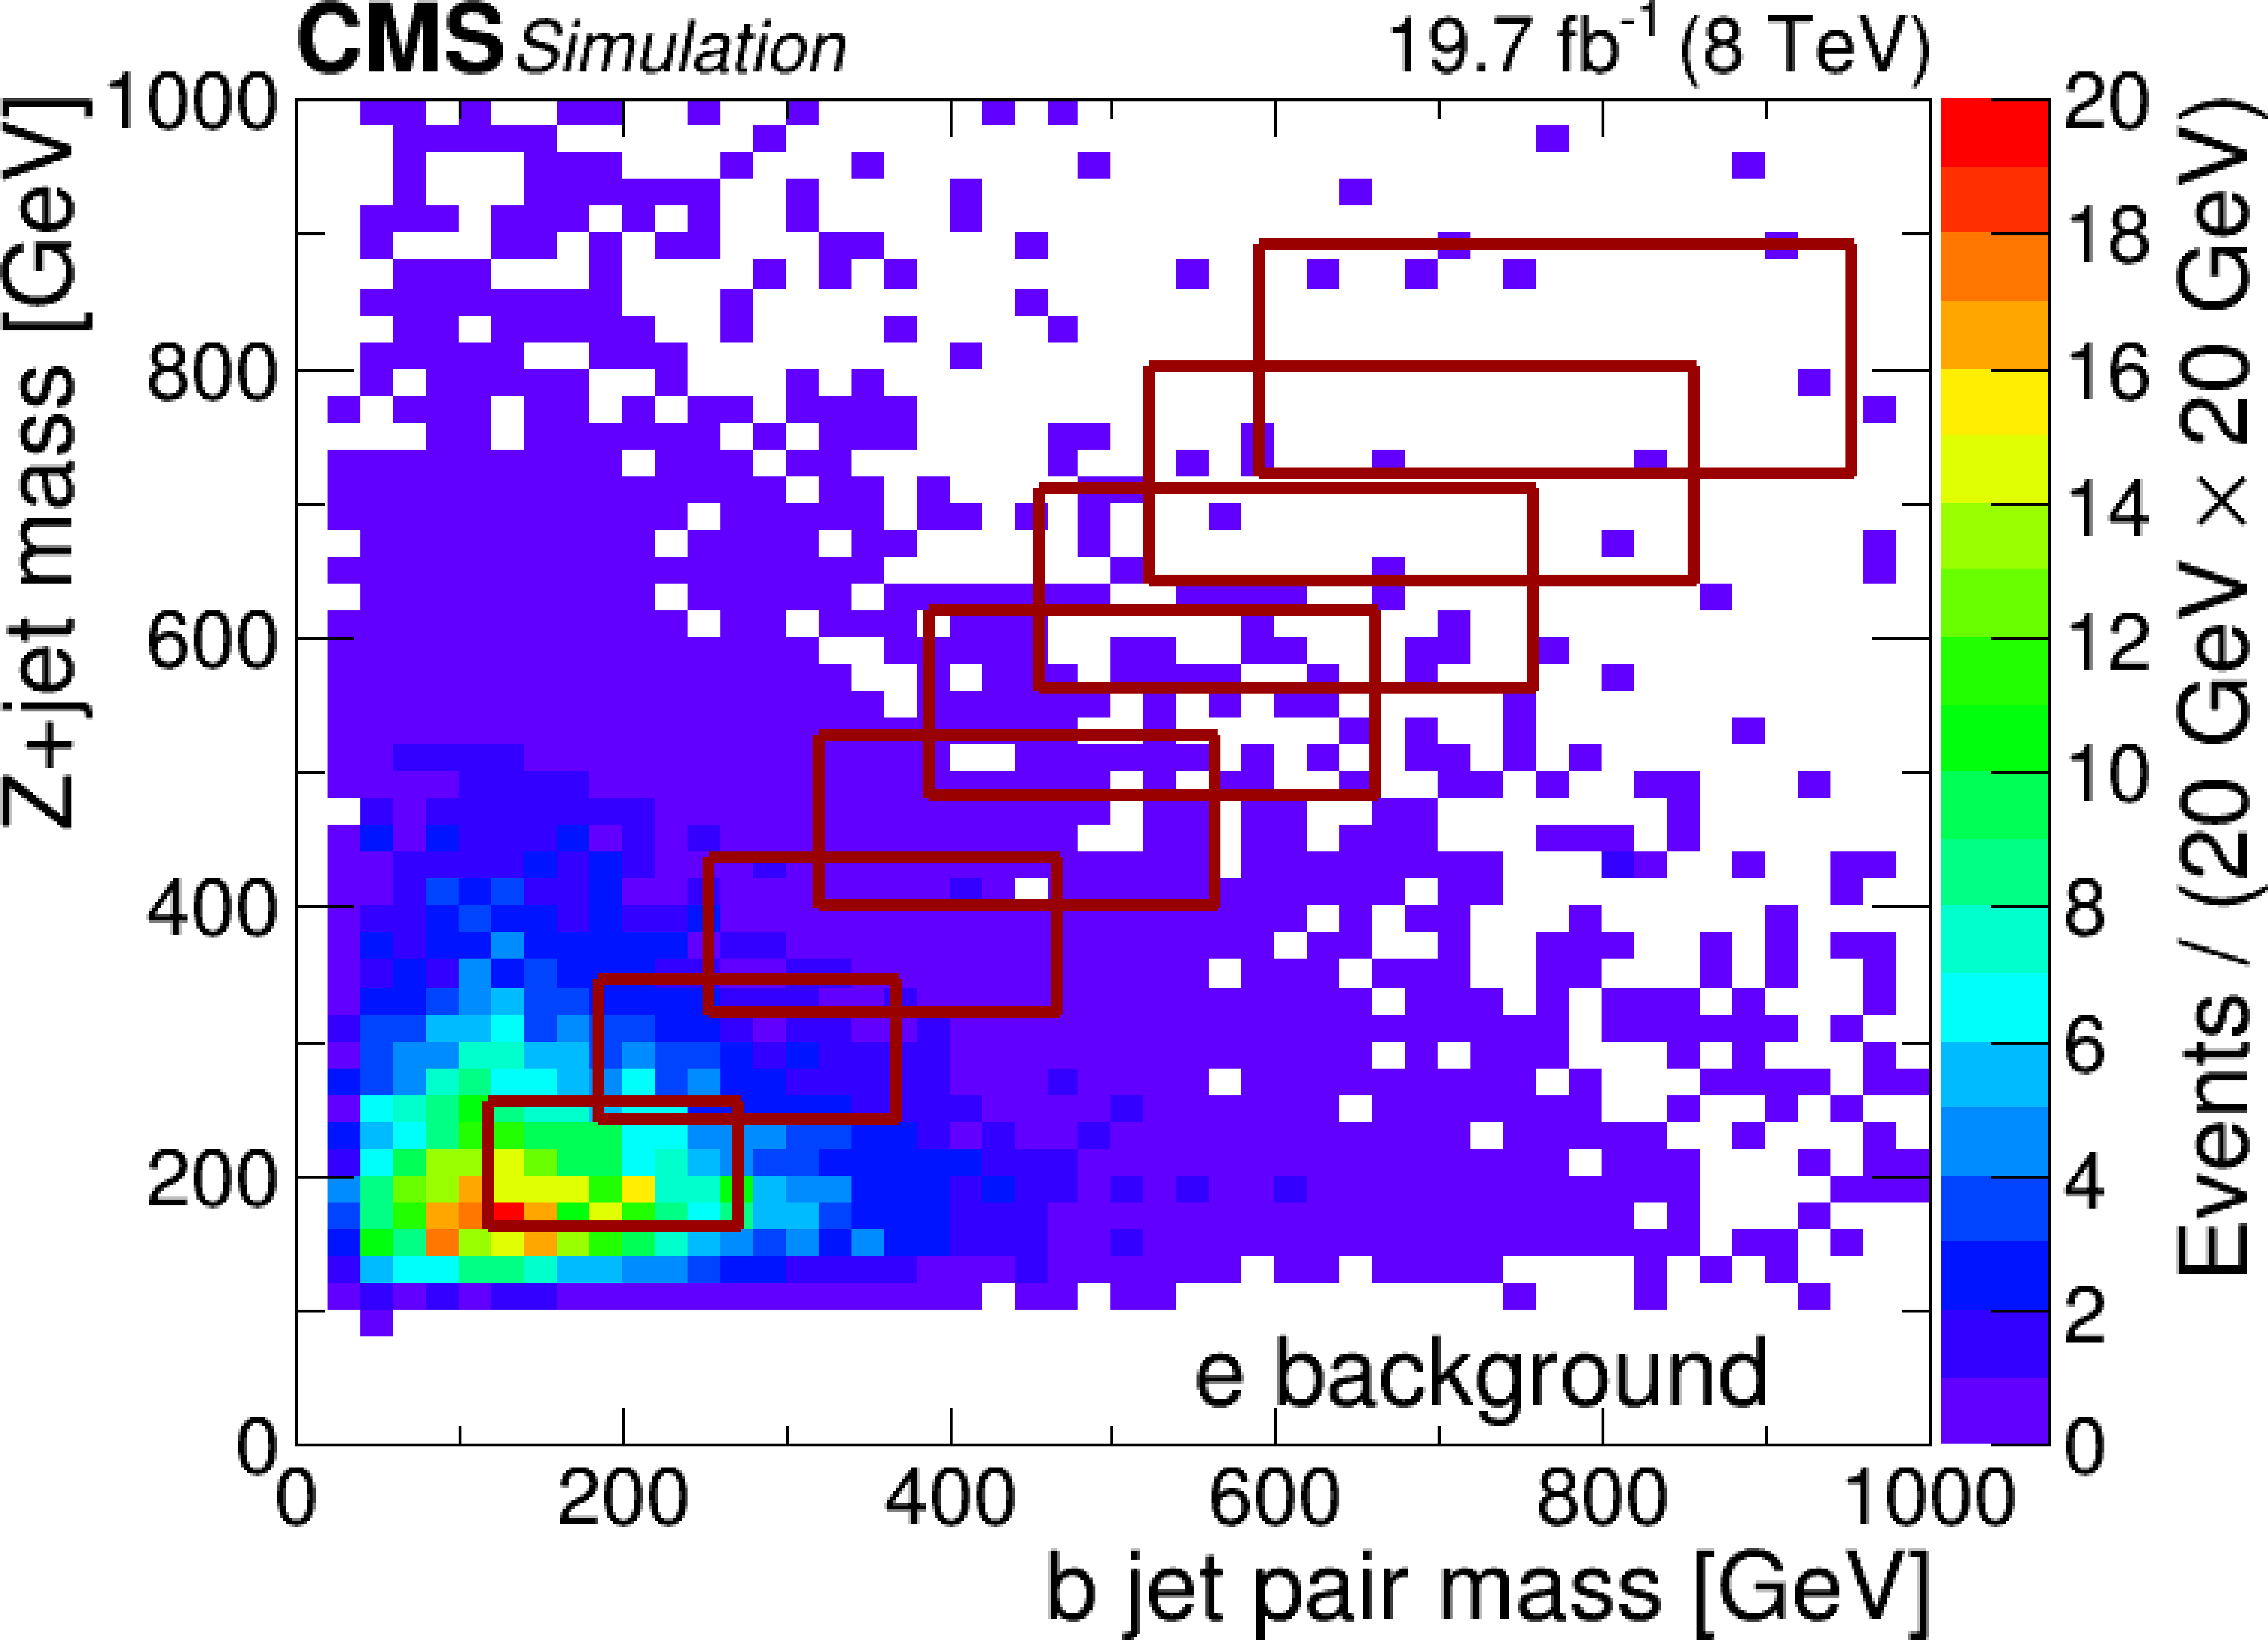
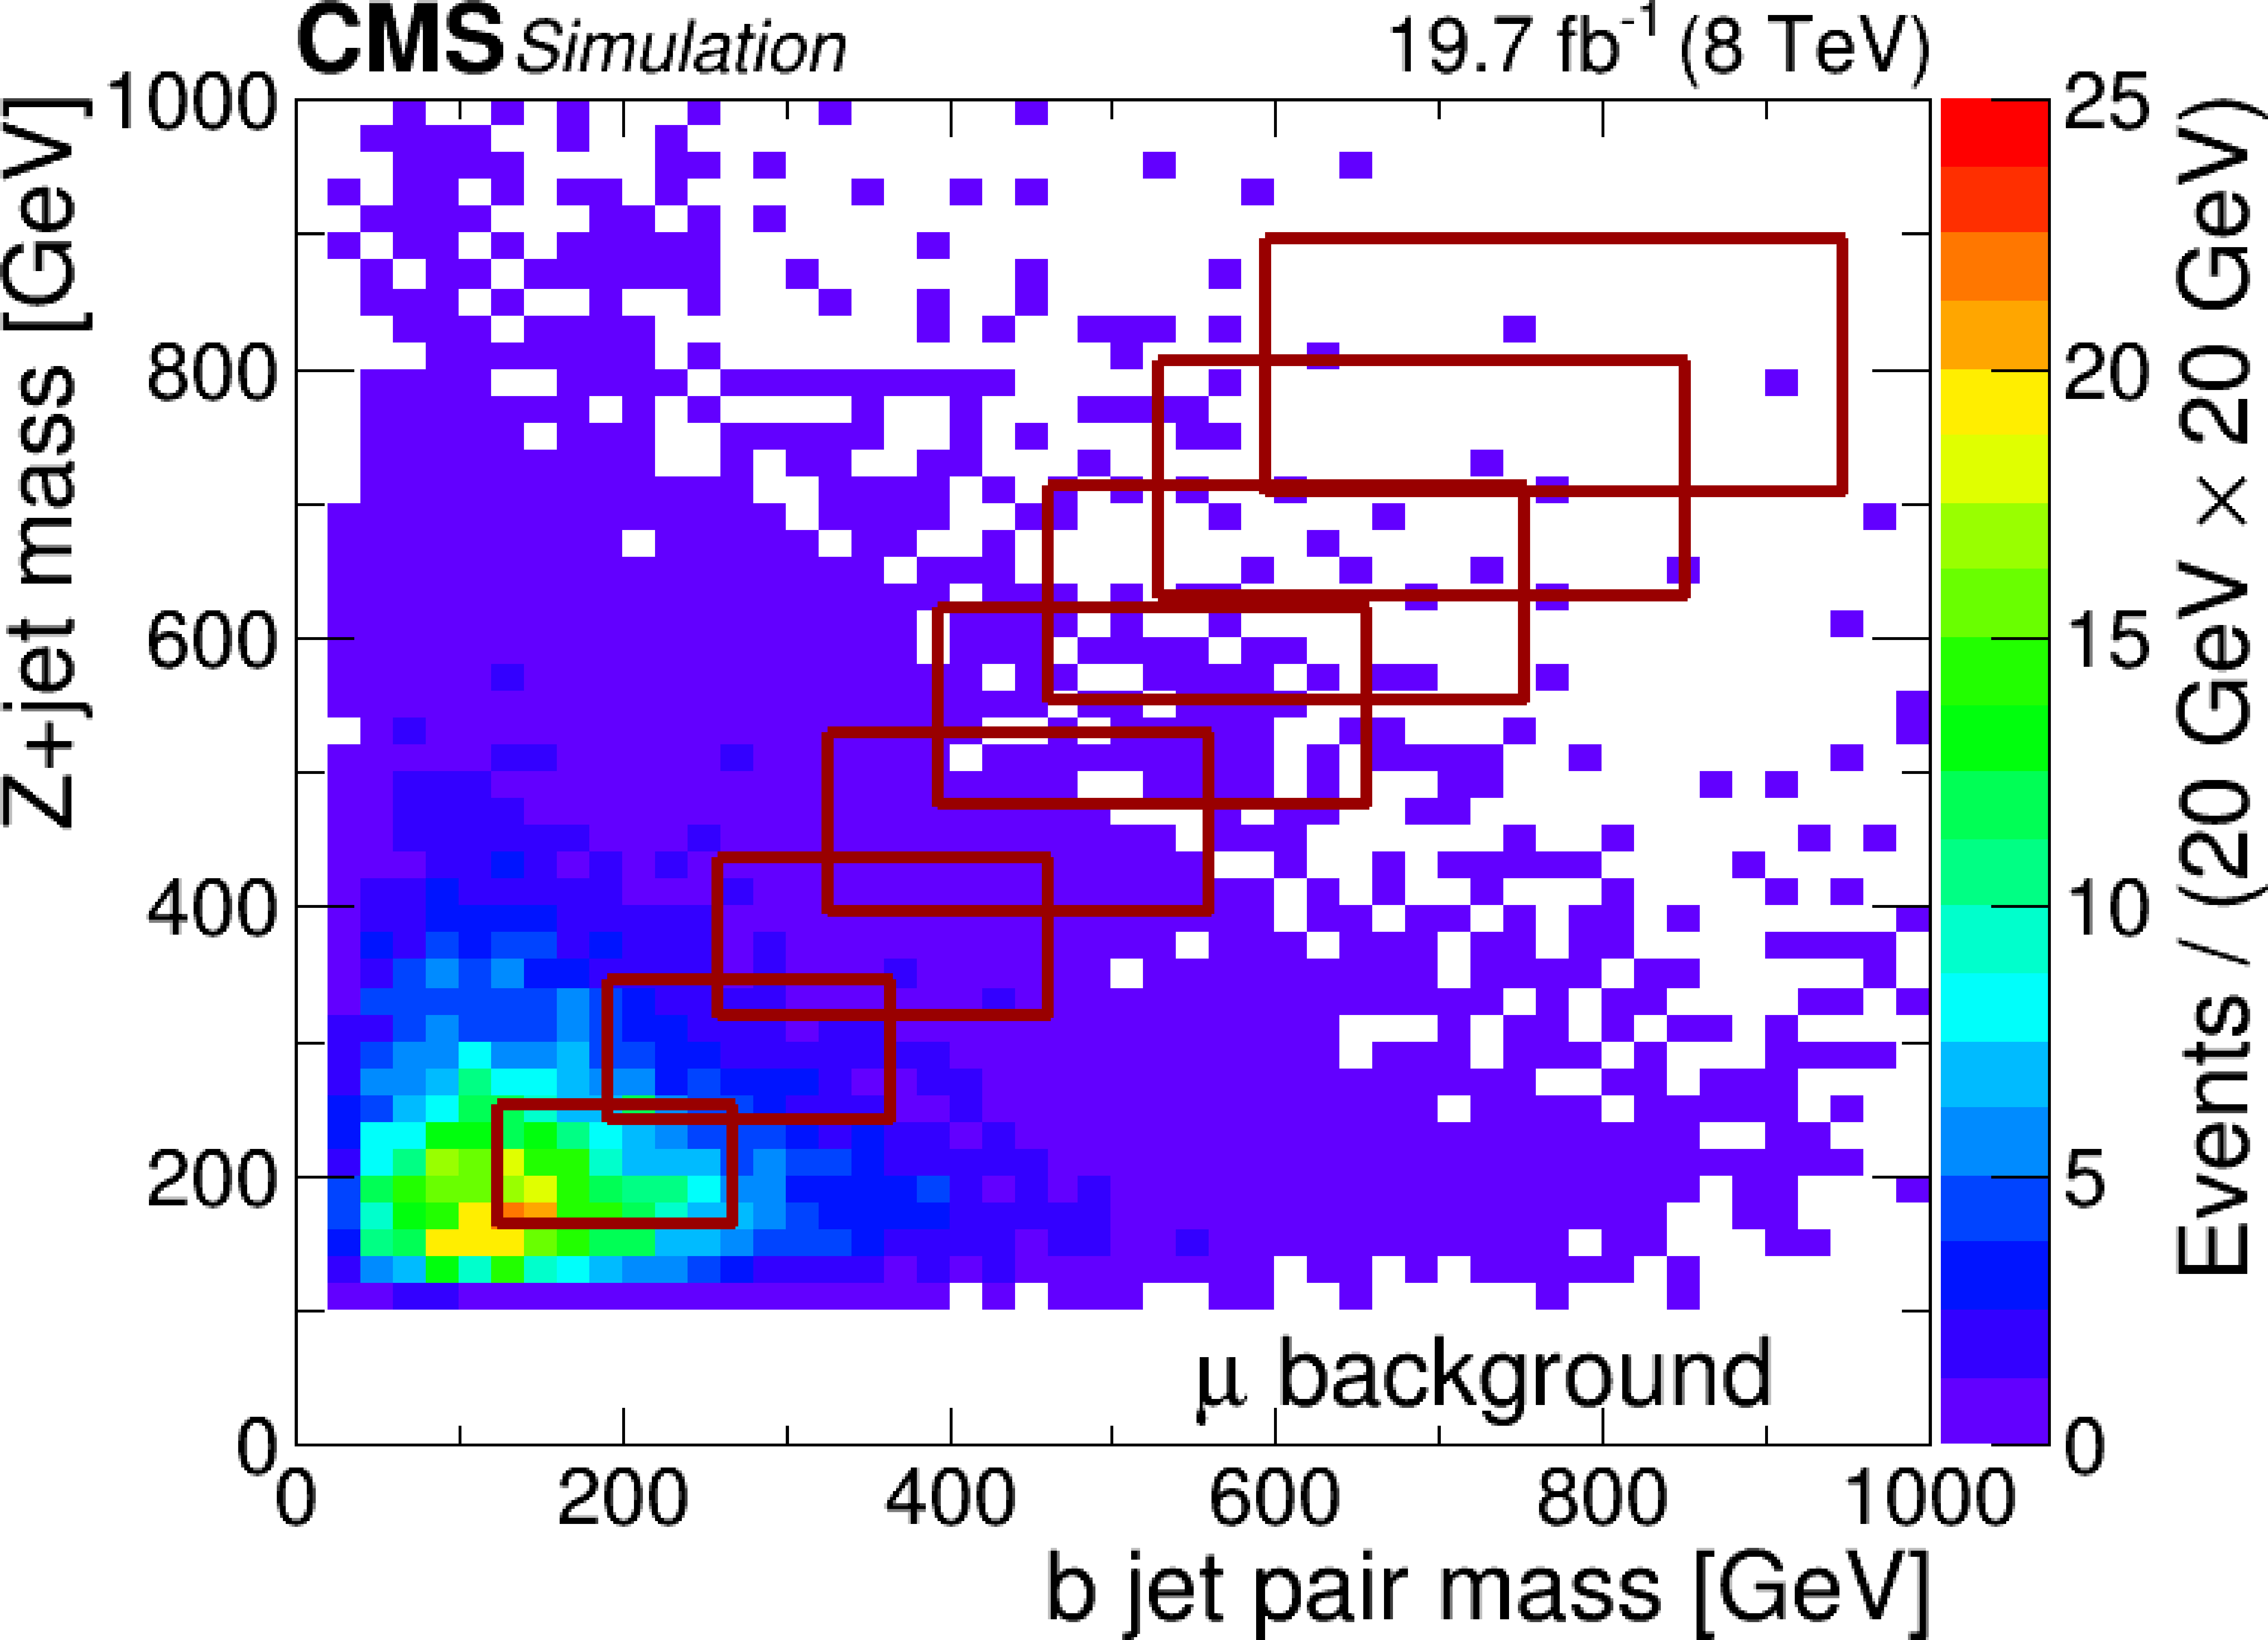
Figure 6-a:
Distributions of the Z+jet mass versus b jet pair mass in data (a,b), and estimated background (c,d). The number of signal candidate events is counted in the rectangular boxes defined for each signal mass hypothesis, as discussed in Section "Selection". |
png pdf |
Figure 6-b:
Distributions of the Z+jet mass versus b jet pair mass in data (a,b), and estimated background (c,d). The number of signal candidate events is counted in the rectangular boxes defined for each signal mass hypothesis, as discussed in Section "Selection". |
png pdf |
Figure 6-c:
Distributions of the Z+jet mass versus b jet pair mass in data (a,b), and estimated background (c,d). The number of signal candidate events is counted in the rectangular boxes defined for each signal mass hypothesis, as discussed in Section "Selection". |
png pdf |
Figure 6-d:
Distributions of the Z+jet mass versus b jet pair mass in data (a,b), and estimated background (c,d). The number of signal candidate events is counted in the rectangular boxes defined for each signal mass hypothesis, as discussed in Section "Selection". |
png pdf |
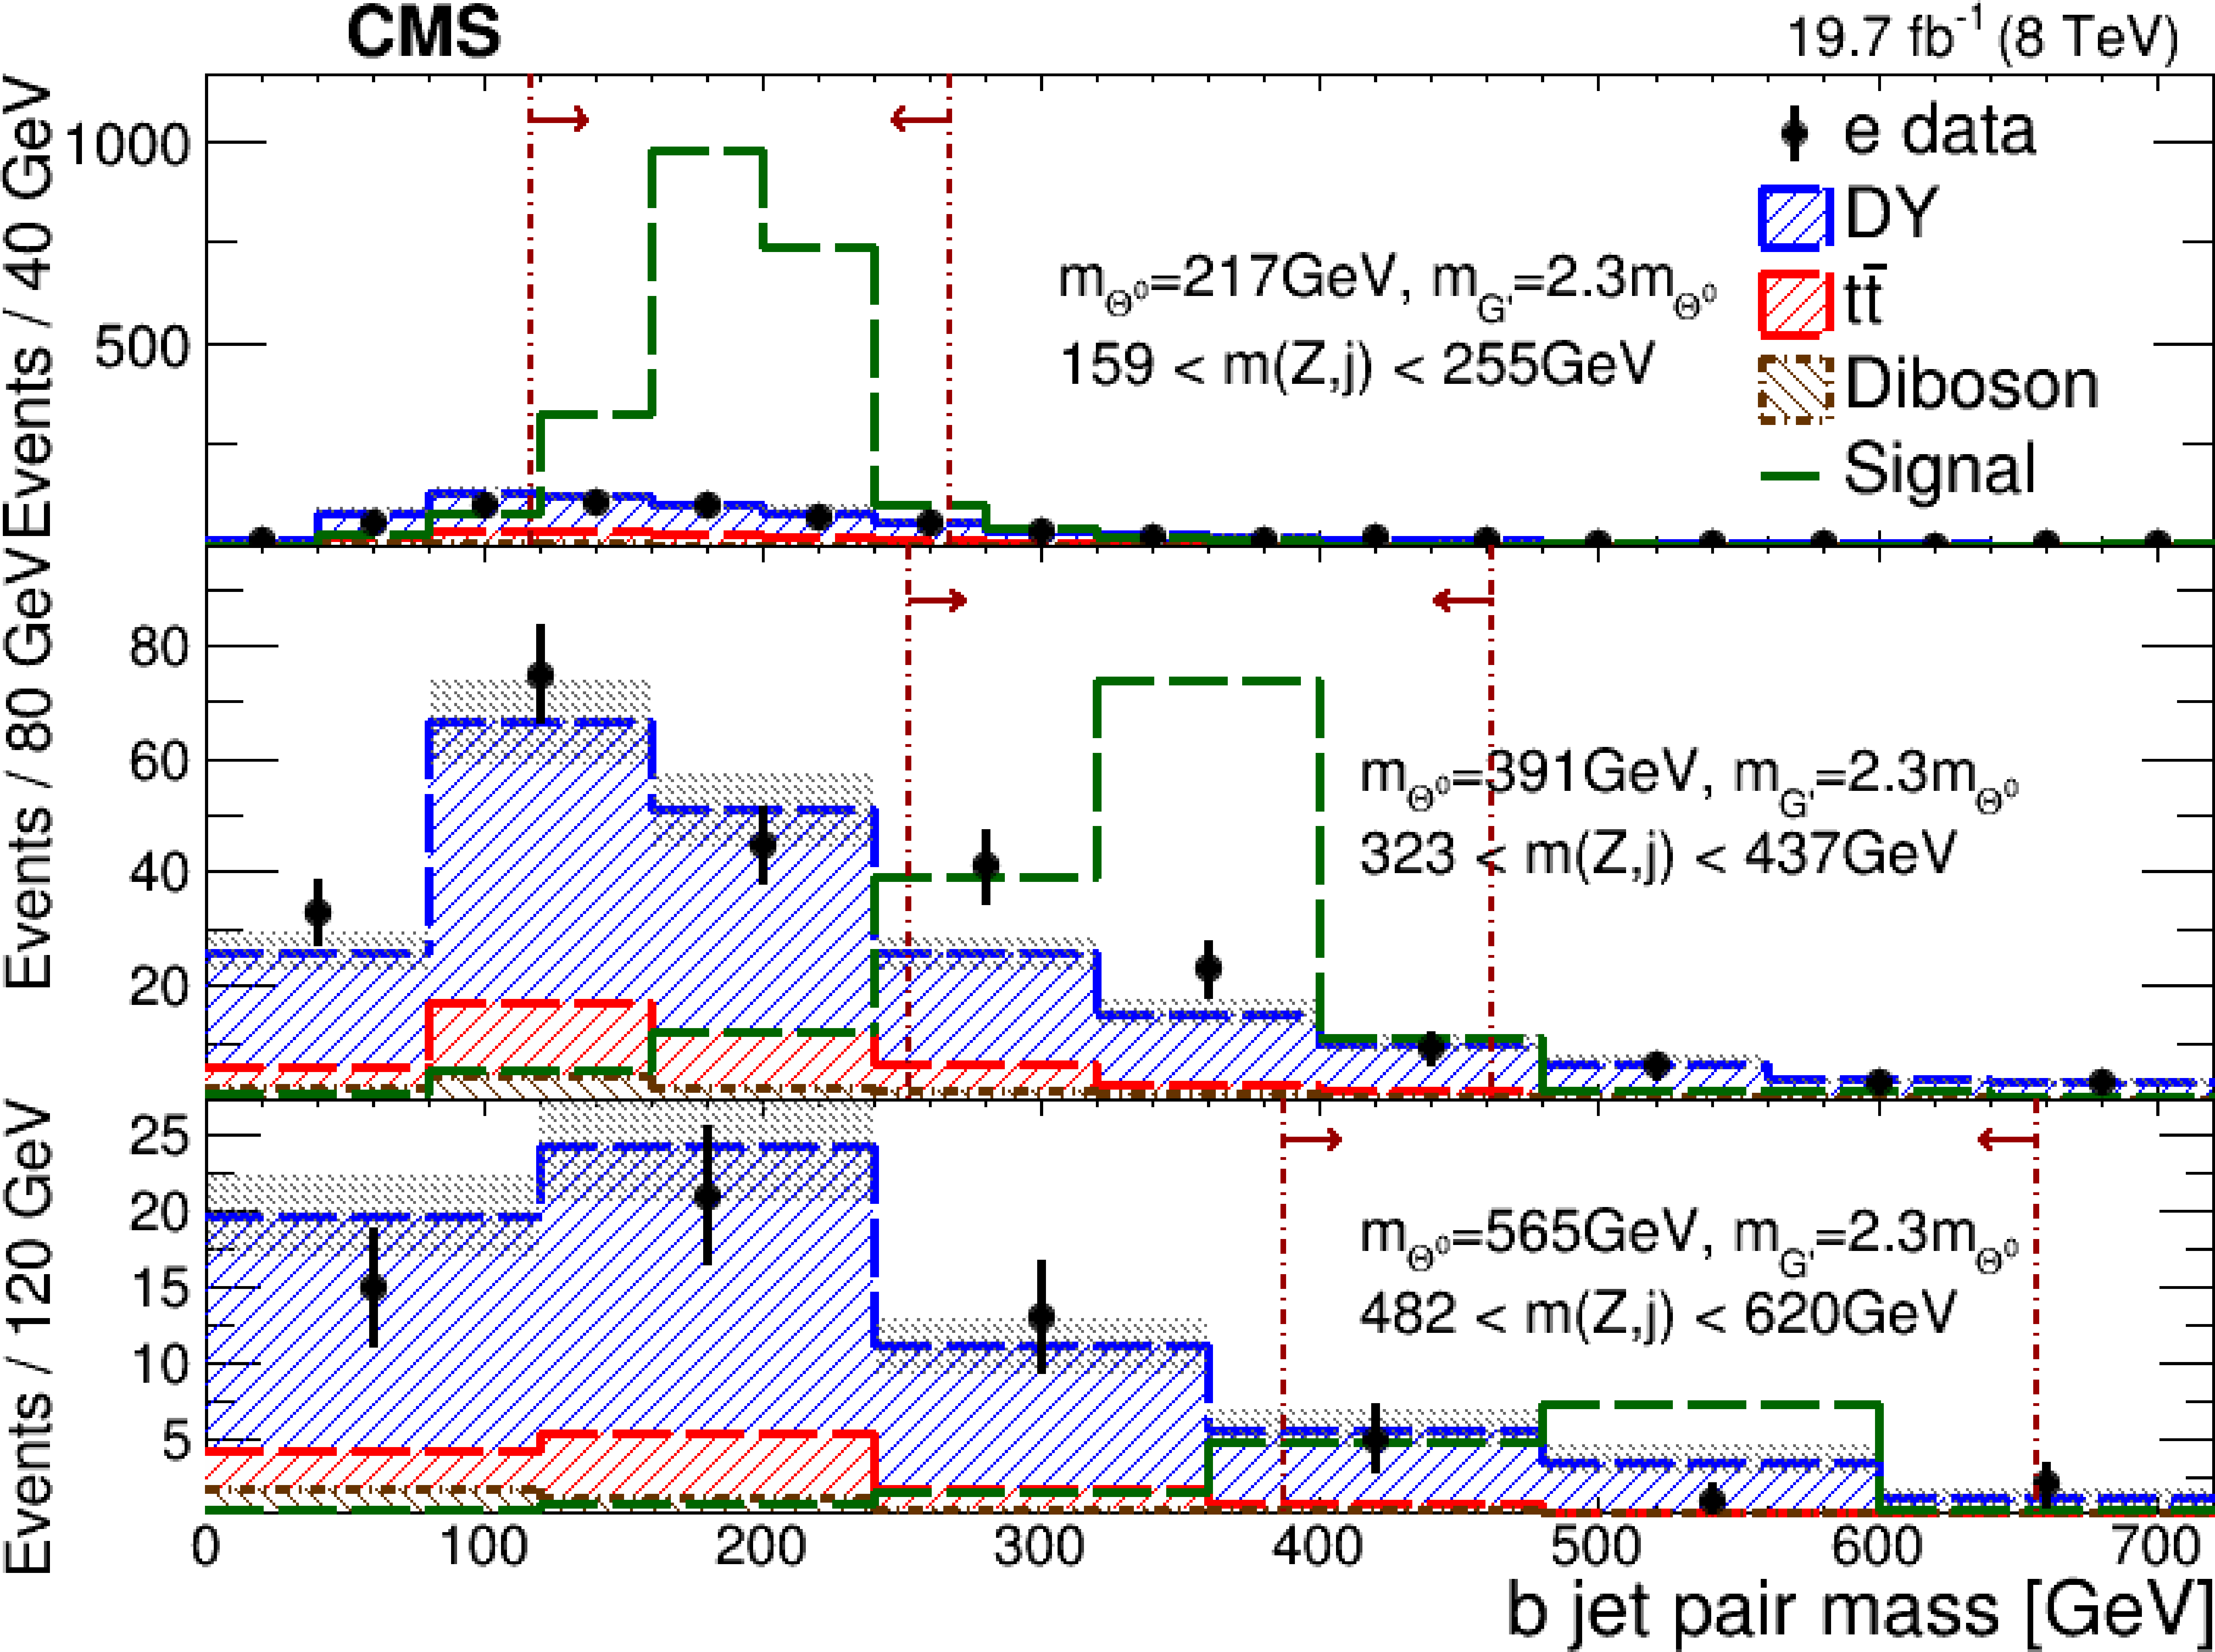
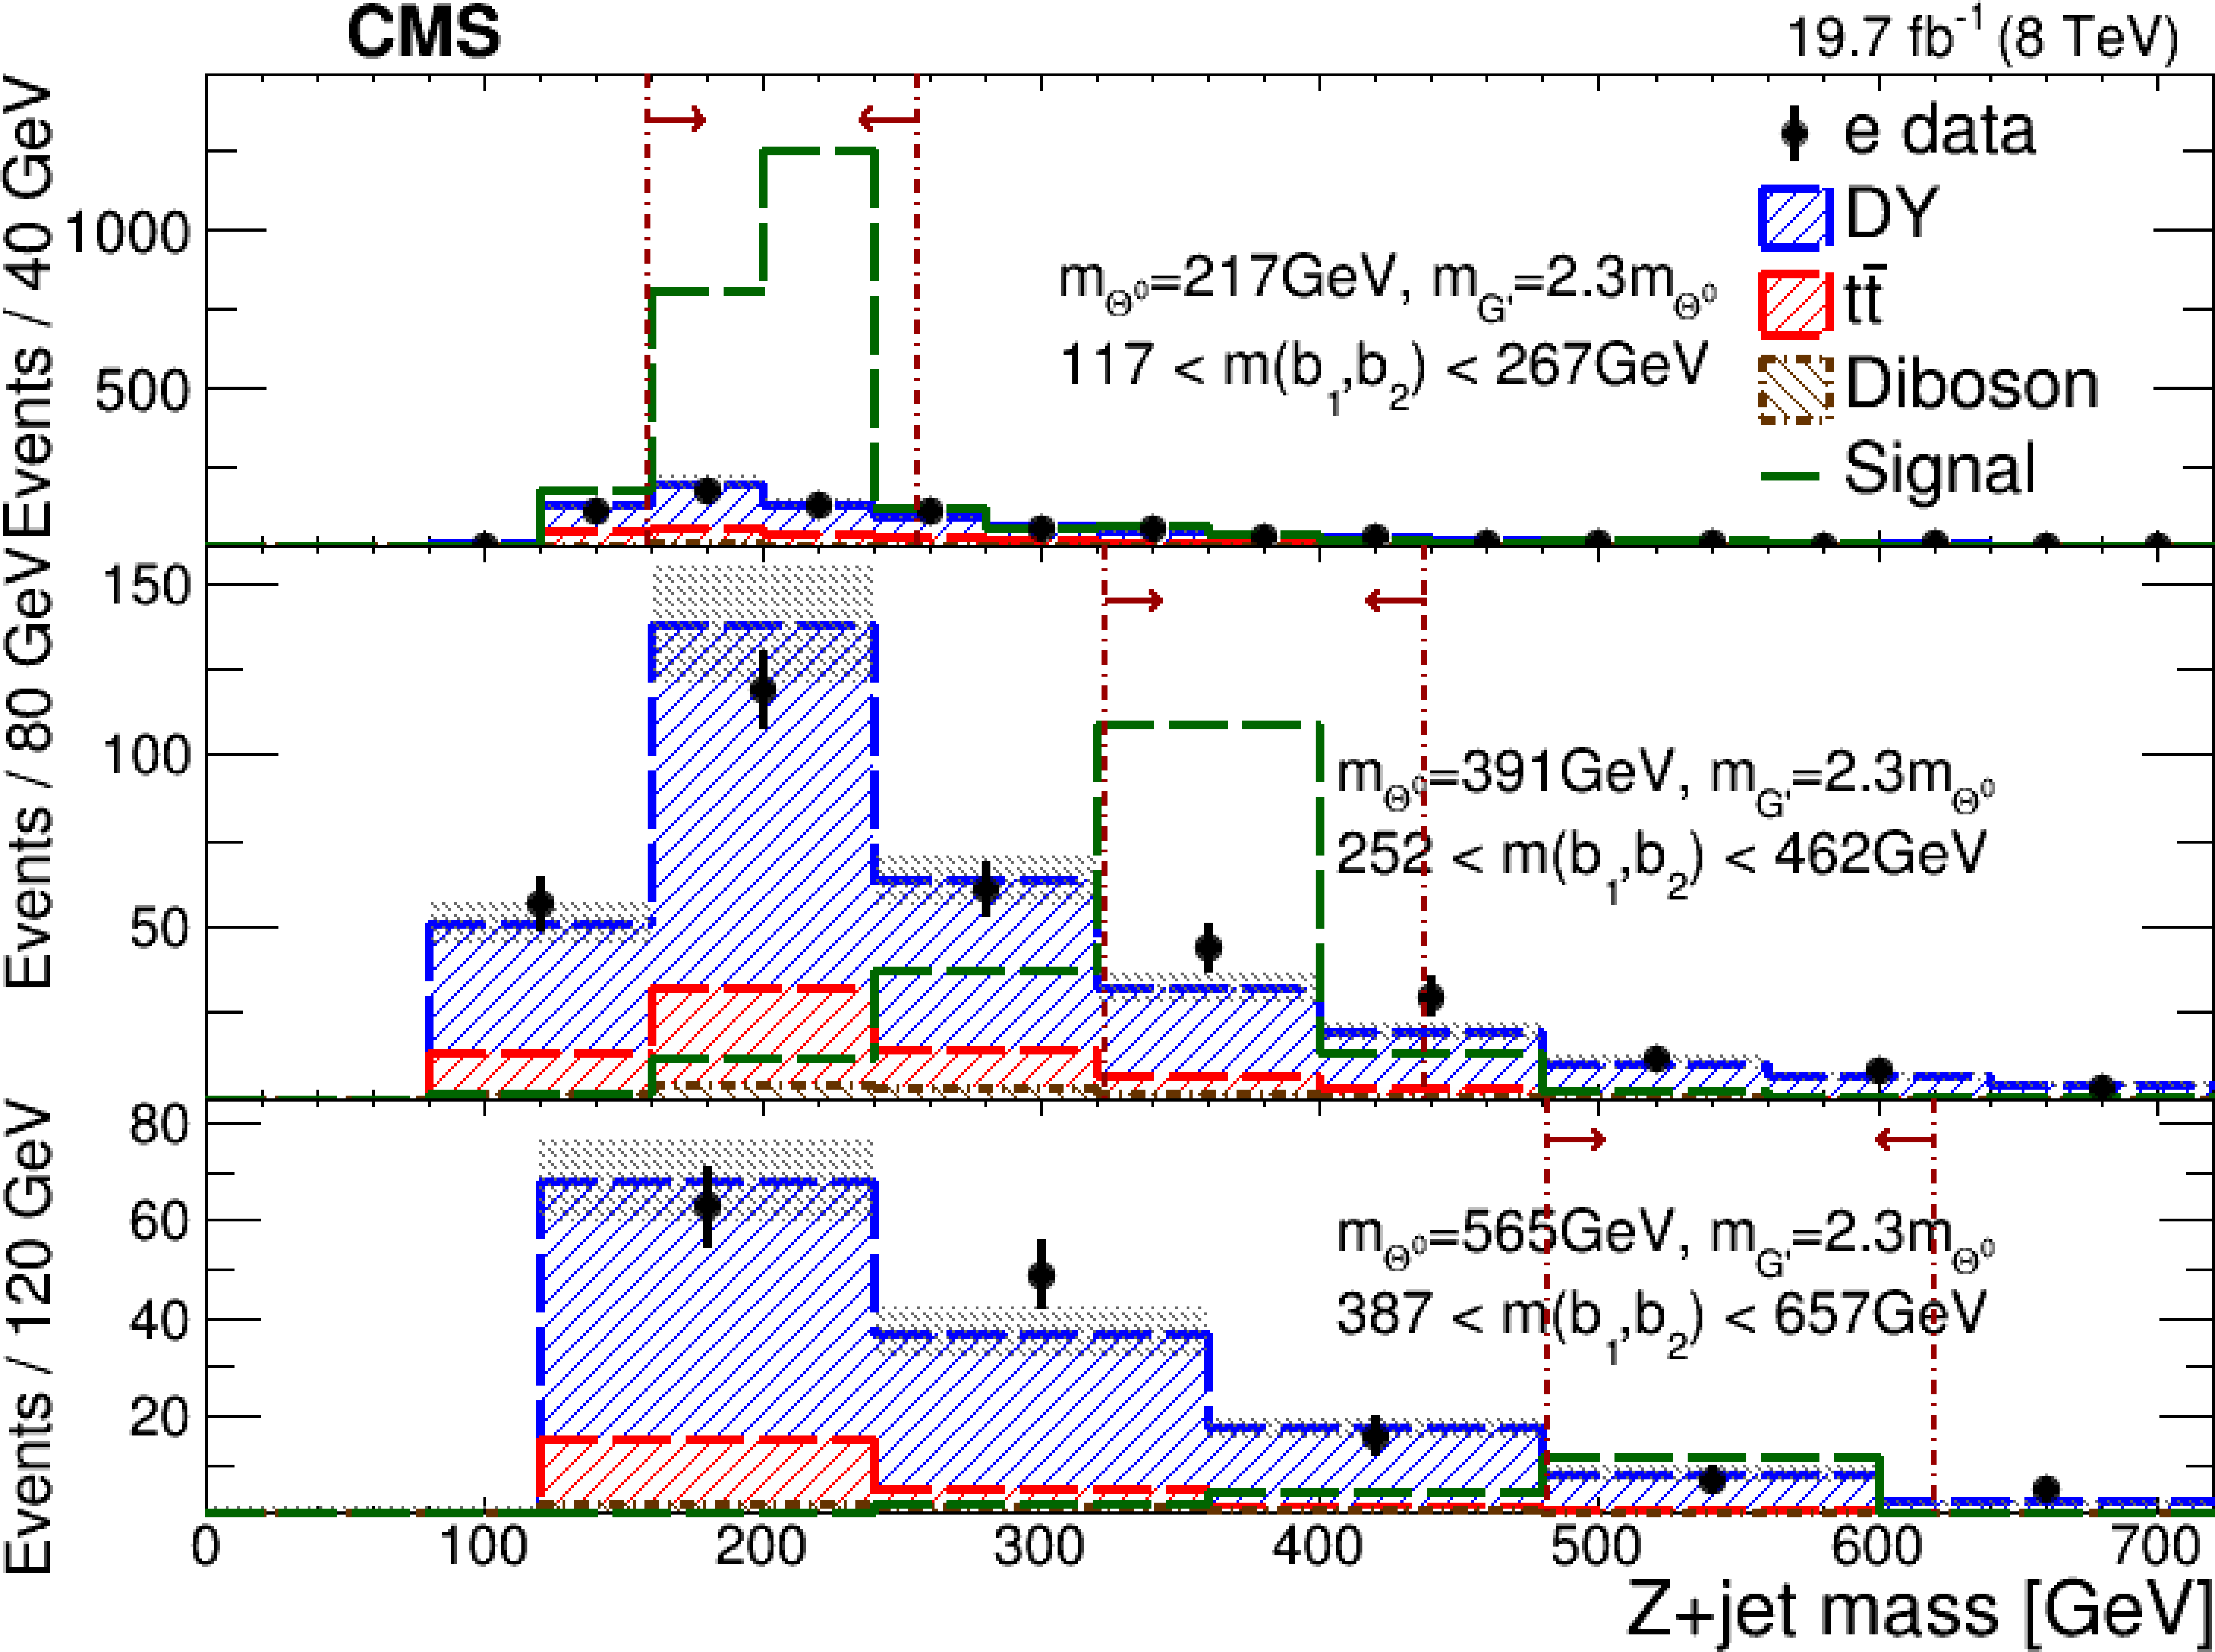
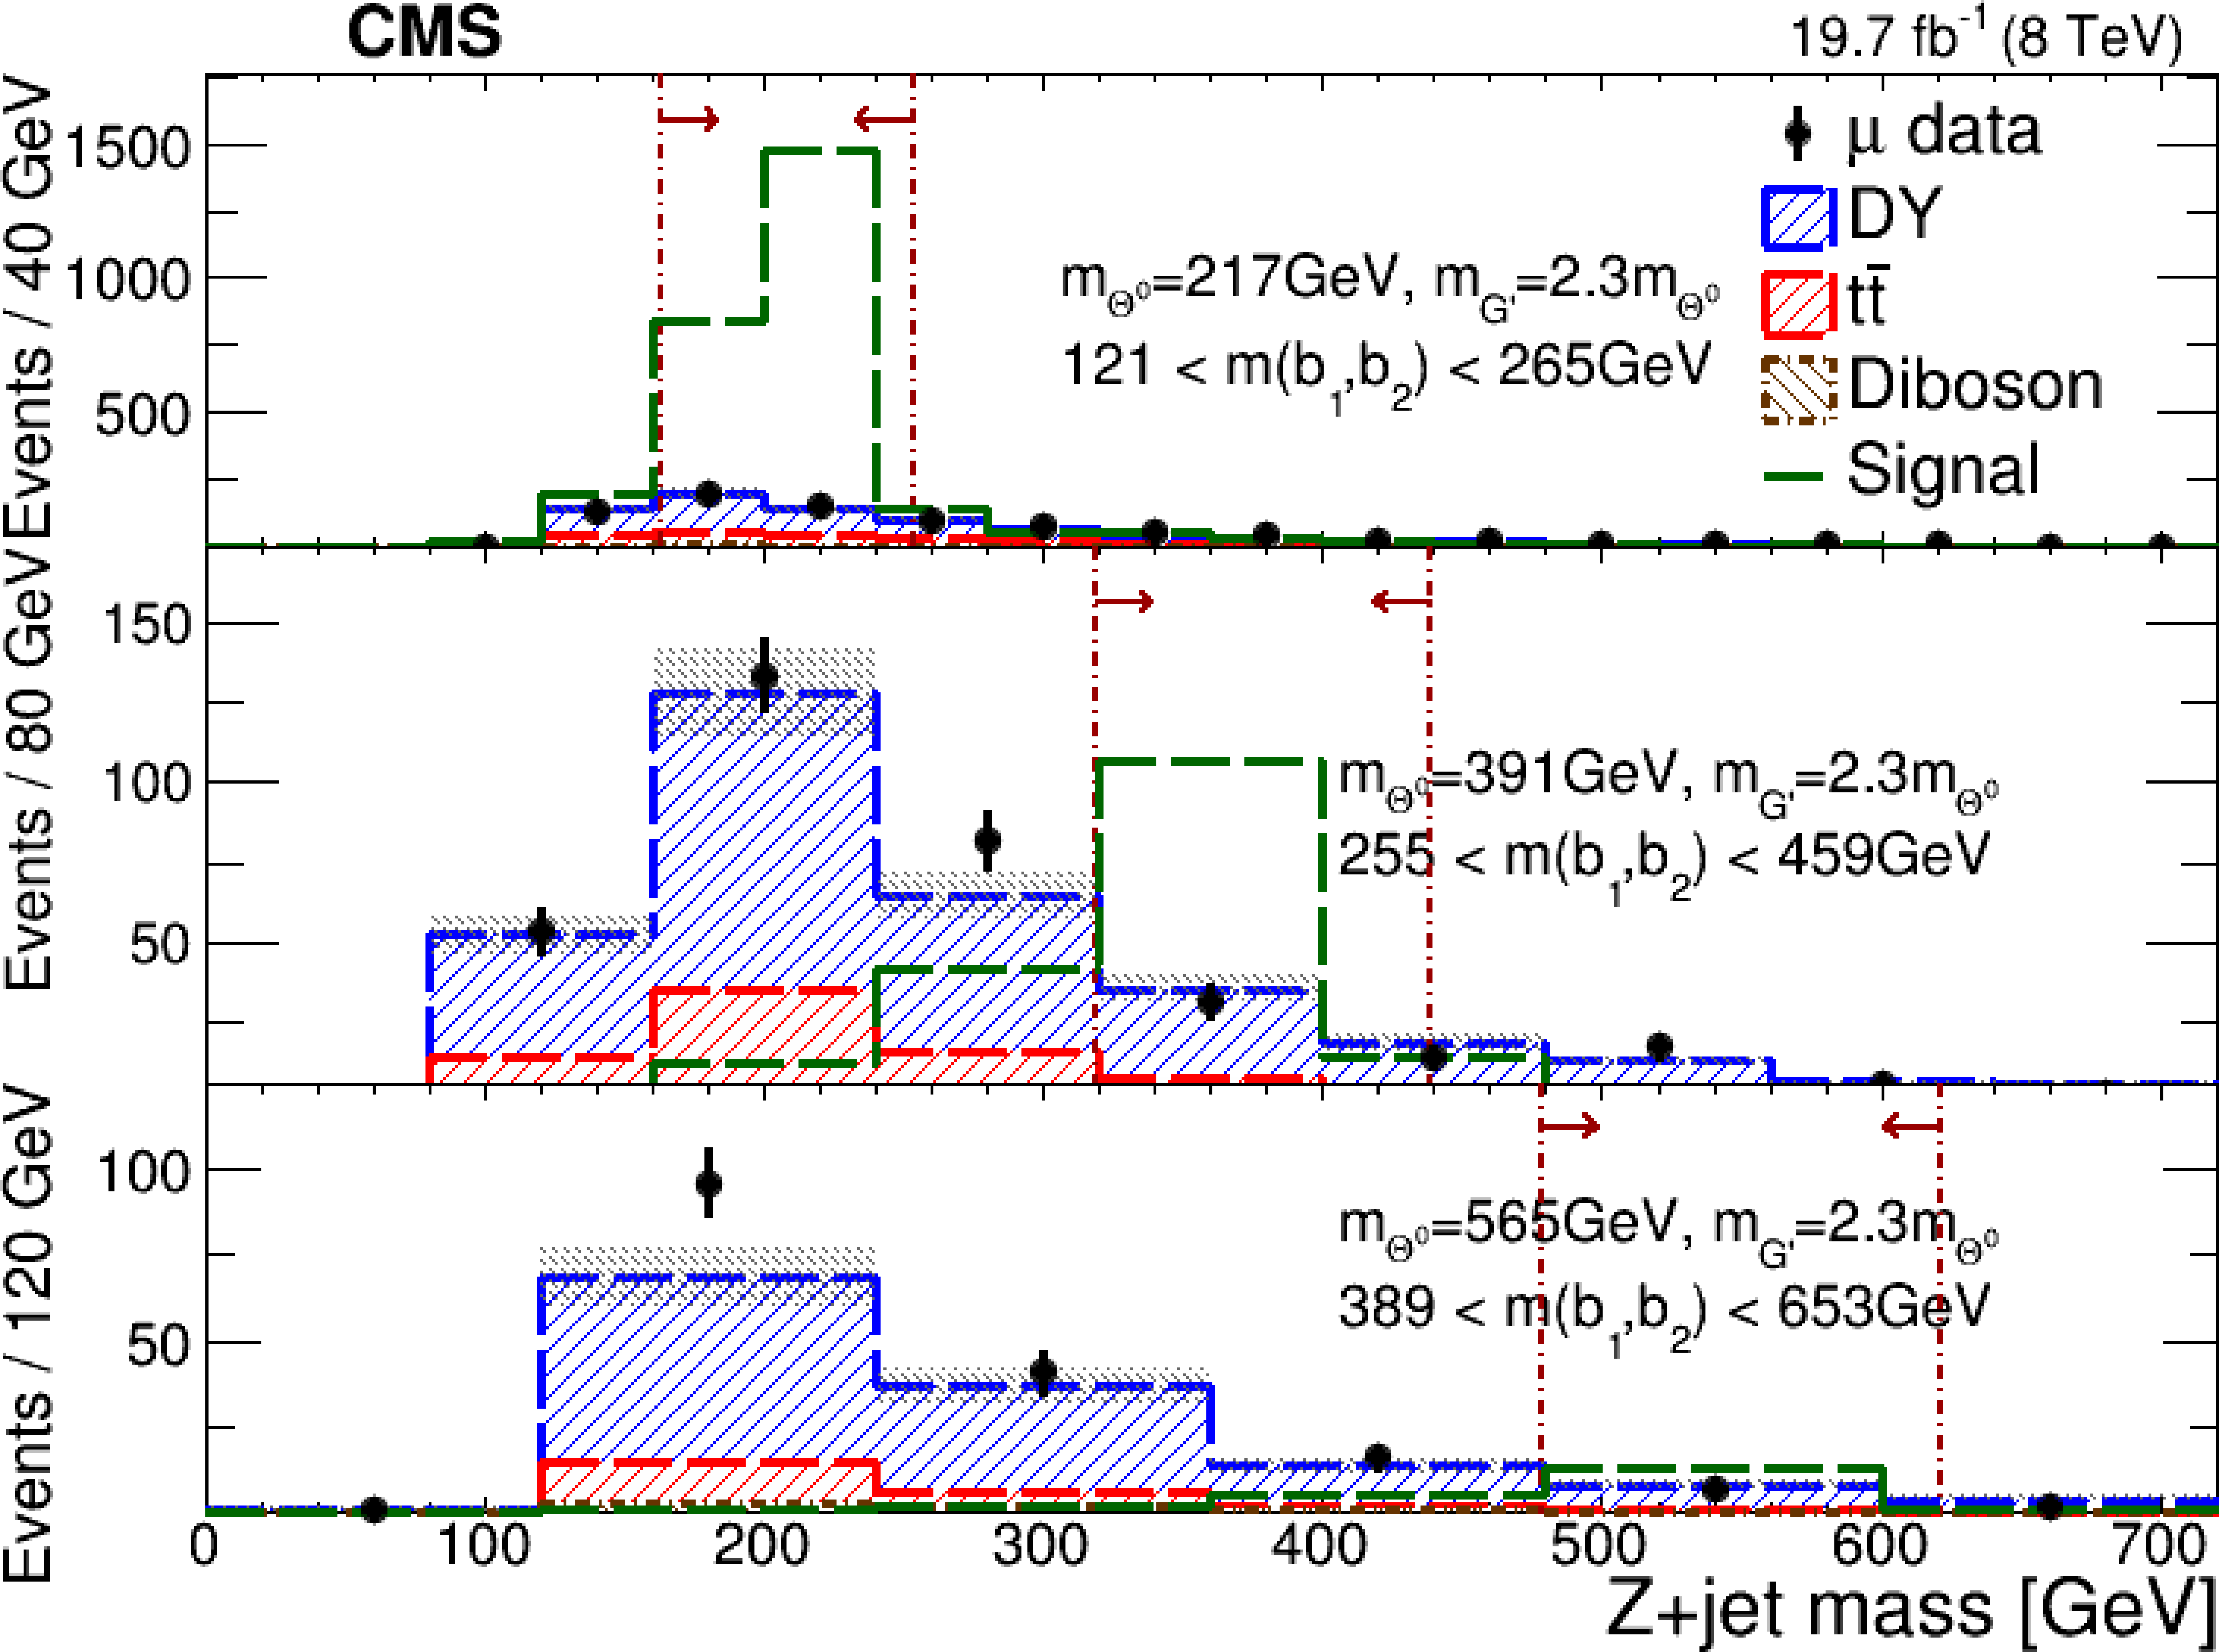
Figure 7-a:
The b jet pair mass distributions for three different ranges of Z+jet mass in the electron channel (a) and the muon channel (b); Z+jet mass distributions for three different ranges of b jet pair mass in the electron channel (c) and the muon channel (d). The plotted regions correspond to three of the search regions. Predicted signal distributions are overlaid. The shaded band represents the statistical uncertainty combined with the systematic uncertainty in the simulated samples. |

png pdf |
Figure 7-b:
The b jet pair mass distributions for three different ranges of Z+jet mass in the electron channel (a) and the muon channel (b); Z+jet mass distributions for three different ranges of b jet pair mass in the electron channel (c) and the muon channel (d). The plotted regions correspond to three of the search regions. Predicted signal distributions are overlaid. The shaded band represents the statistical uncertainty combined with the systematic uncertainty in the simulated samples. |
png pdf |
Figure 7-c:
The b jet pair mass distributions for three different ranges of Z+jet mass in the electron channel (a) and the muon channel (b); Z+jet mass distributions for three different ranges of b jet pair mass in the electron channel (c) and the muon channel (d). The plotted regions correspond to three of the search regions. Predicted signal distributions are overlaid. The shaded band represents the statistical uncertainty combined with the systematic uncertainty in the simulated samples. |
png pdf |
Figure 7-d:
The b jet pair mass distributions for three different ranges of Z+jet mass in the electron channel (a) and the muon channel (b); Z+jet mass distributions for three different ranges of b jet pair mass in the electron channel (c) and the muon channel (d). The plotted regions correspond to three of the search regions. Predicted signal distributions are overlaid. The shaded band represents the statistical uncertainty combined with the systematic uncertainty in the simulated samples. |

png pdf |
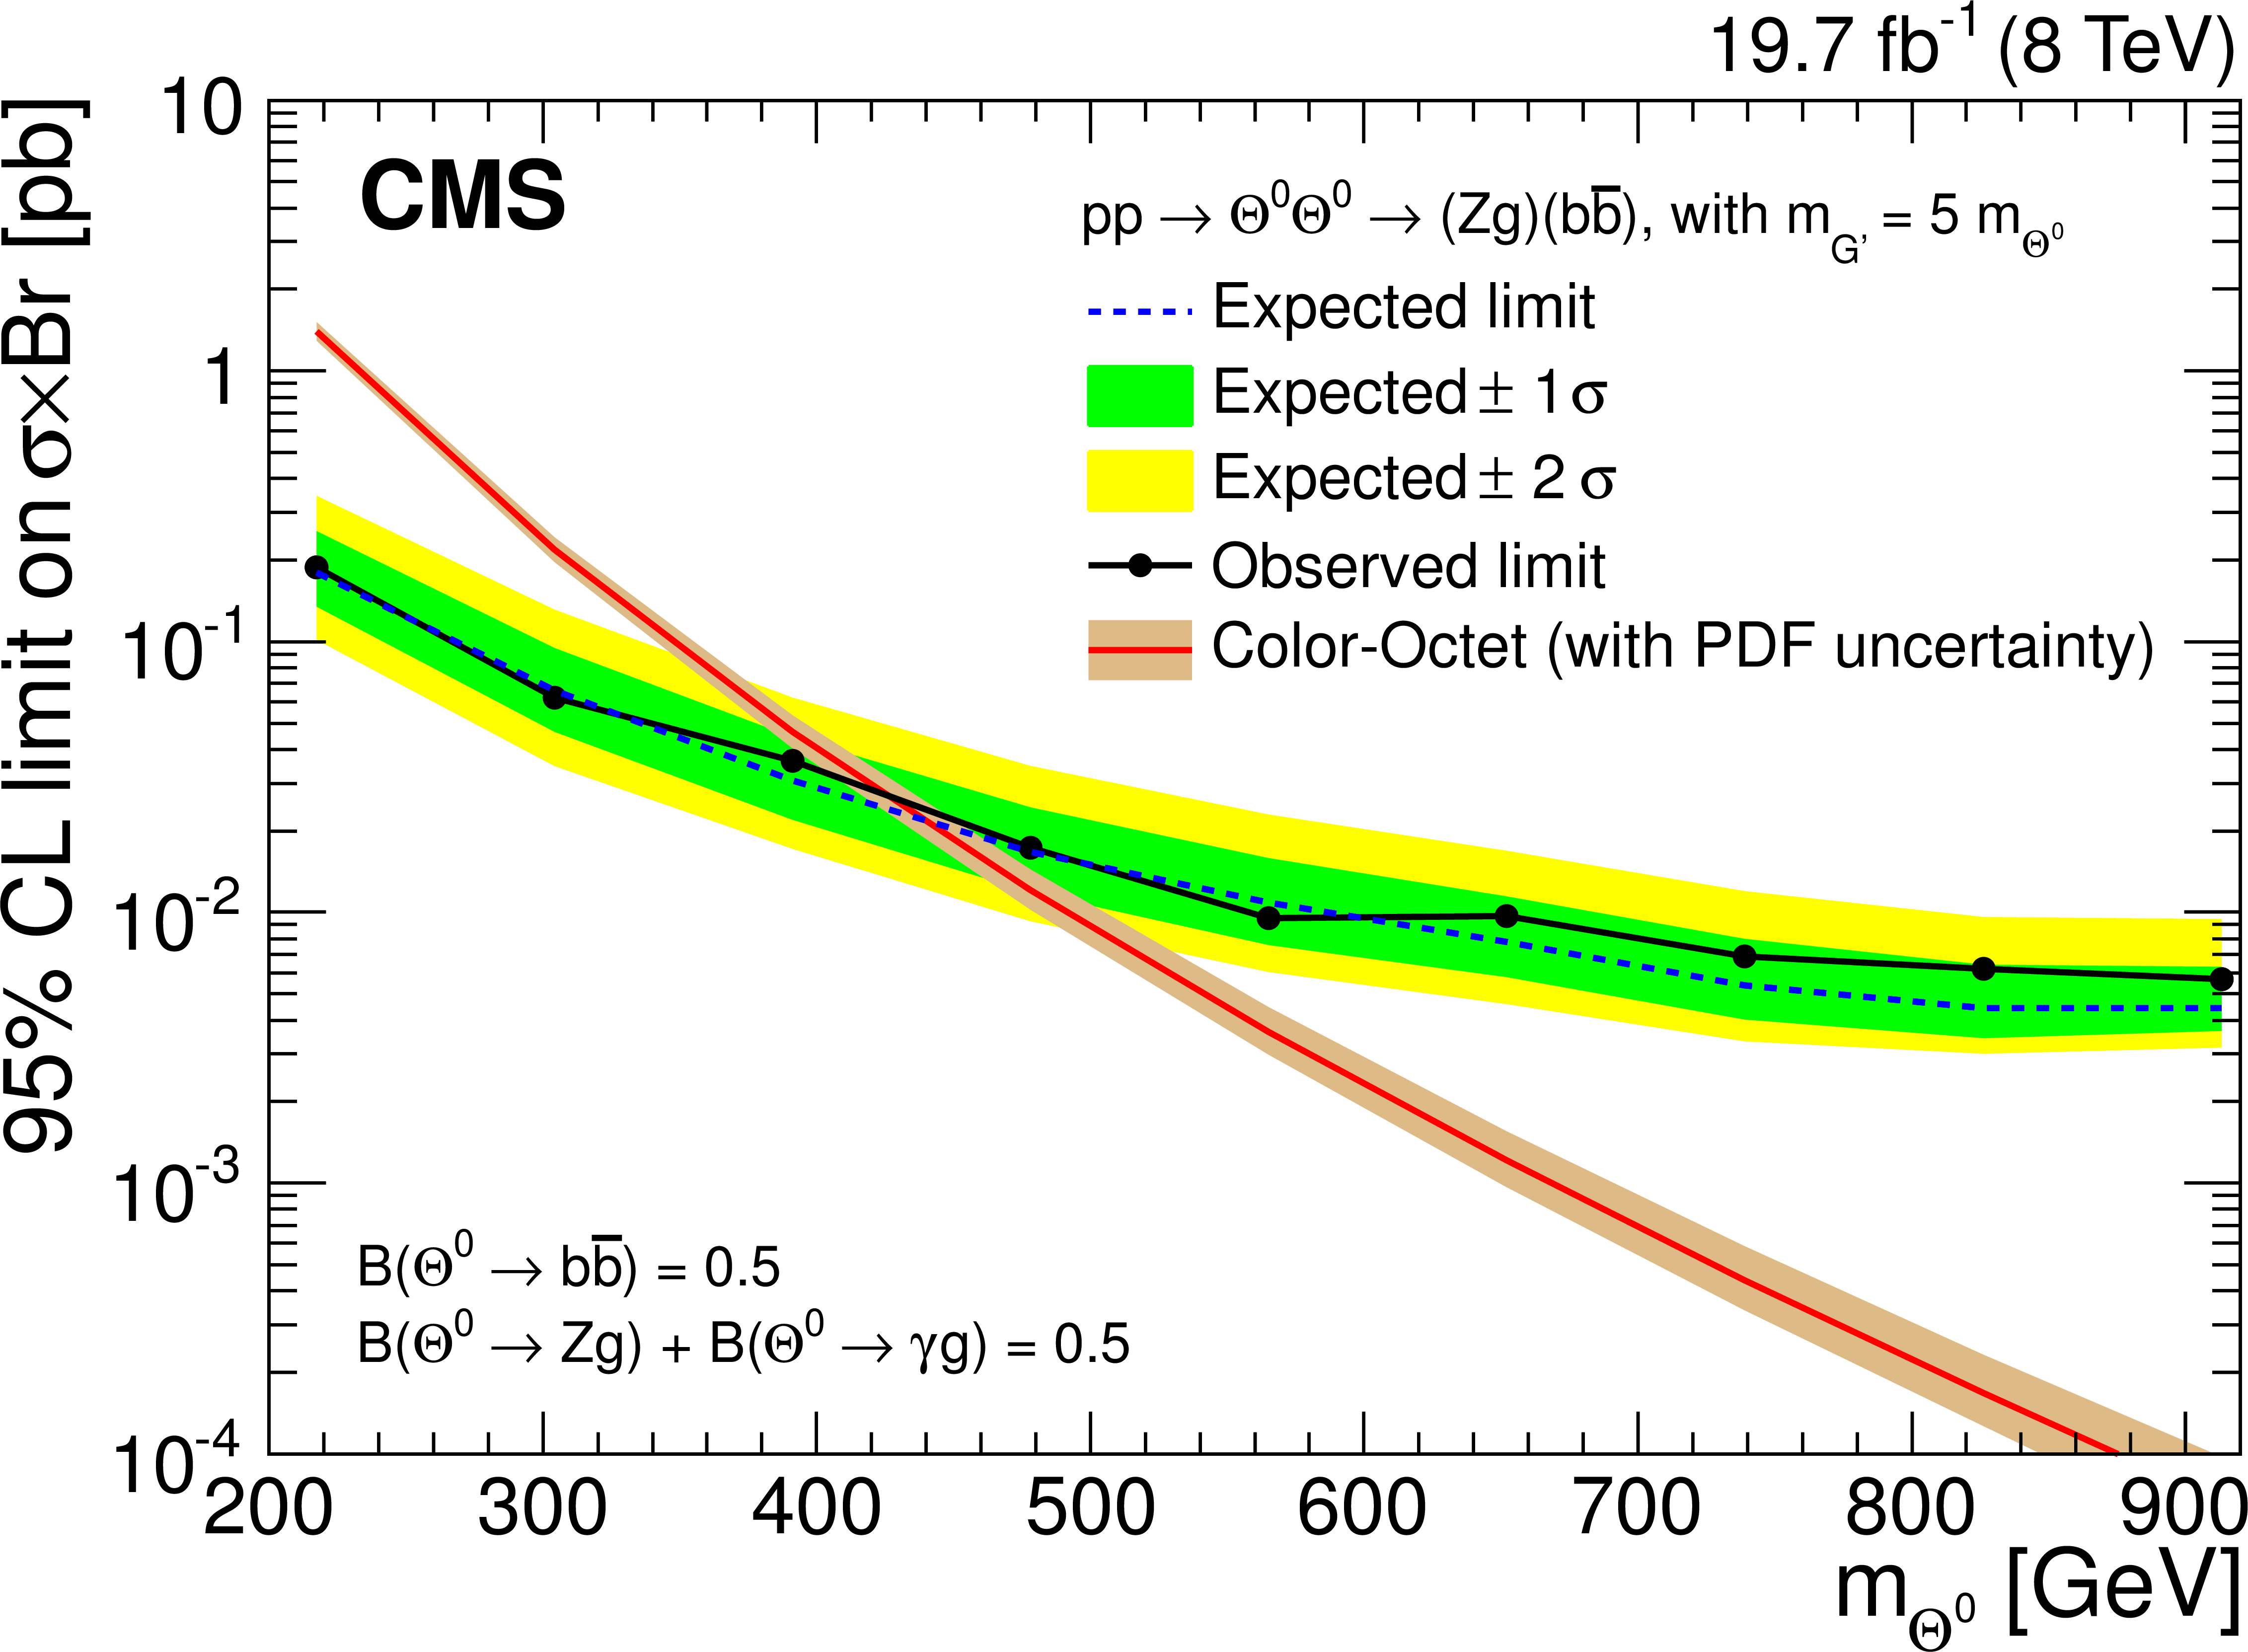
Figure 8-a:
The 95% CL expected and observed upper limits on the cross section times branching fraction, $\sigma \times \mathcal {B}(\Theta ^{0} \to \mathrm{Z} {\mathrm {g}} ) \times \mathcal {B}( \mathrm{Z} \to \ell \ell ) \times \mathcal {B}(\Theta ^{0} \to { {\mathrm {b}} {\overline {\mathrm {b}}}} ) \times 2$, as a function of $\Theta ^{0}$ mass, for the case where $m_{\mathrm {G'}} = 2.3 m_{\Theta ^{0}}$ (a) and $m_{\mathrm {G'}} = 5 m_{\Theta ^{0}}$ (b) with the band on the color octet theoretical prediction indicating uncertainty in the signal yield due to PDF. These results assume $\mathcal {B}$($\Theta ^{0} \to { {\mathrm {b}} {\overline {\mathrm {b}}}} $) = 0.5 and $\mathcal {B}$($\Theta ^{0} \to {\mathrm {Z}} {\mathrm {g}} $) + $\mathcal {B}$($\Theta ^{0} \to \gamma {\mathrm {g}} $) = 0.5. |
png pdf |
Figure 8-b:
The 95% CL expected and observed upper limits on the cross section times branching fraction, $\sigma \times \mathcal {B}(\Theta ^{0} \to \mathrm{Z} {\mathrm {g}} ) \times \mathcal {B}( \mathrm{Z} \to \ell \ell ) \times \mathcal {B}(\Theta ^{0} \to { {\mathrm {b}} {\overline {\mathrm {b}}}} ) \times 2$, as a function of $\Theta ^{0}$ mass, for the case where $m_{\mathrm {G'}} = 2.3 m_{\Theta ^{0}}$ (a) and $m_{\mathrm {G'}} = 5 m_{\Theta ^{0}}$ (b) with the band on the color octet theoretical prediction indicating uncertainty in the signal yield due to PDF. These results assume $\mathcal {B}$($\Theta ^{0} \to { {\mathrm {b}} {\overline {\mathrm {b}}}} $) = 0.5 and $\mathcal {B}$($\Theta ^{0} \to {\mathrm {Z}} {\mathrm {g}} $) + $\mathcal {B}$($\Theta ^{0} \to \gamma {\mathrm {g}} $) = 0.5. |
| Tables | |
png pdf |
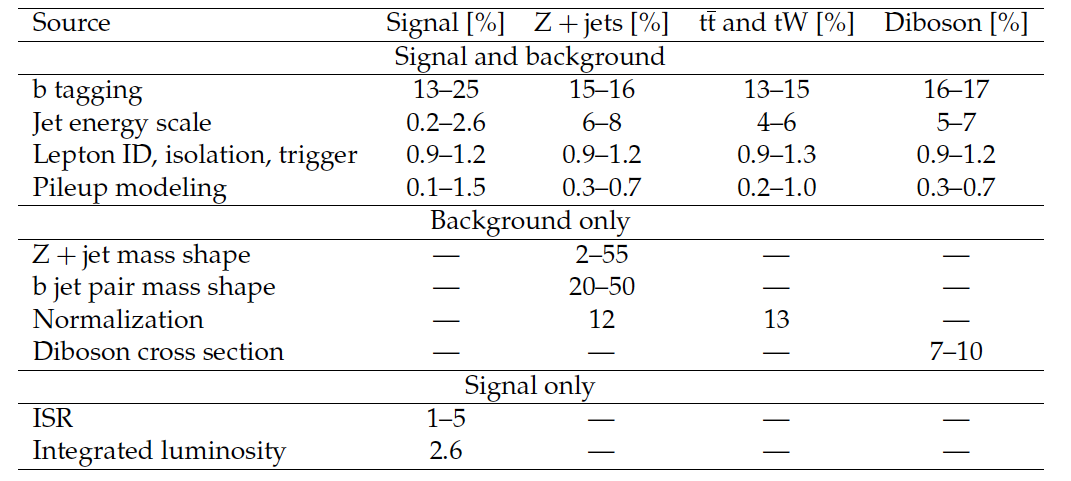
Table 1:
Impact of systematic uncertainties on individual event yields. Ranges show the variation over the search regions that are considered. Dashes indicate cases where a systematic uncertainty is not applied. Sources appearing in more than one process are treated as correlated in the limit setting. |
png pdf |
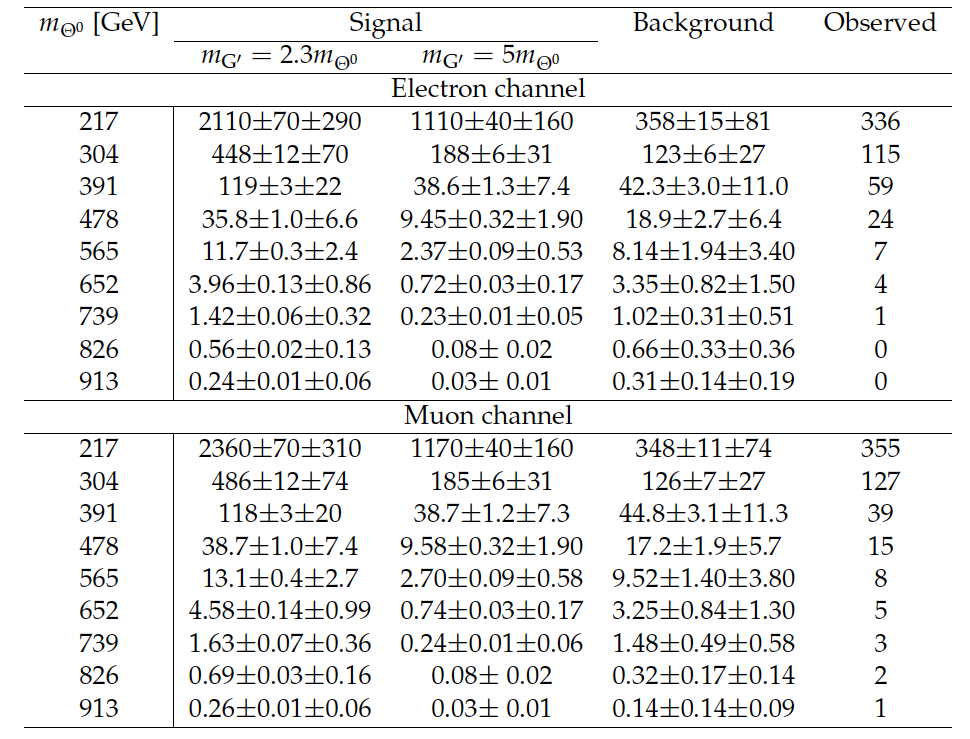
Table 2:
The number of events after final selection for the signal, total background, and observed data, together with the statistical and systematic uncertainty. For the entries where a single uncertainty is shown, the statistical uncertainty is negligible. |
png pdf |
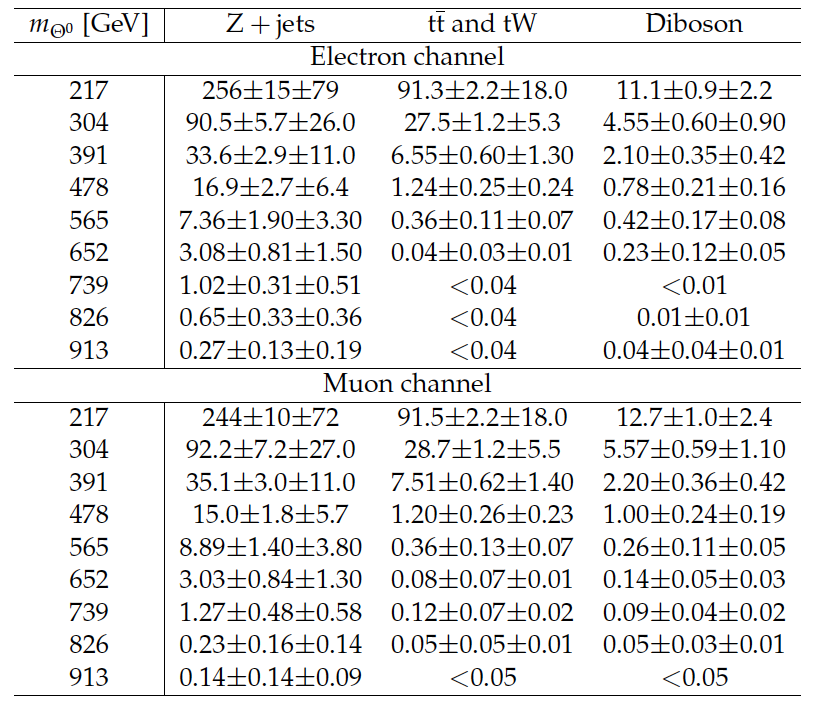
Table 3:
The number of background events, from all sources, after final selection, together with the statistical and systematic uncertainty. For the entries where a single uncertainty is shown, the systematic uncertainty is negligible. |
| Summary |
| A search for pair production of neutral color-octet weak-triplet scalar particles ($\Theta_0$) has been performed based on processes where one $\Theta_0$ decays to a pair of b quark jets and the other to a Z boson plus a jet, with the Z boson decaying to a pair of electrons or muons. This analysis is based on data collected with the CMS experiment in proton-proton collisions at $\sqrt{s} =$ 8 TeV, corresponding to an integrated luminosity of 19.7 fb$^{-1}$. The number of observed events is found to be in agreement with the standard model prediction. The CLs method is used to set a 95% confidence level limit on the cross section of octo-triplet particles, assuming $\mathcal{B}(\Theta_0 \to \mathrm{ b \bar{b} }) =$ 0.5, with the remaining $\Theta_0$ branching fraction shared between Zg and $\gamma$g. By comparing the theoretical predictions of the octo-triplet model and the observed limits, masses of $\Theta_0$ below 623 GeV for $m_{G^{\prime}} = 2.3 m_{\Theta_0}$, and below 426 GeV for $m_{G^{\prime}} = 5 m_{\Theta_0}$, are excluded at 95% confidence level. These are the first direct experimental bounds on the $\Theta_0$ production model. |
|
|
Compact Muon Solenoid LHC, CERN |
|

|

|

|

|

|