

Compact Muon Solenoid
LHC, CERN
| CMS-EXO-12-026 ; CERN-PH-EP-2013-073 | ||
| Searches for long-lived charged particles in pp collisions at $\sqrt{s}$ = 7 and 8 TeV | ||
| CMS Collaboration | ||
| 2 May 2013 | ||
| J. High Energy Phys. 07 (2013) 122 | ||
| Abstract: Results of searches for heavy stable charged particles produced in pp collisions at $\sqrt{s}$ = 7 and 8 TeV are presented corresponding to an integrated luminosity of 5.0 inverse femtobarns and 18.8 inverse femtobarns, respectively. Data collected with the CMS detector are used to study the momentum, energy deposition, and time-of-flight of signal candidates. Leptons with an electric charge between e/3 and 8e, as well as bound states that can undergo charge exchange with the detector material, are studied. Analysis results are presented for various combinations of signatures in the inner tracker only, inner tracker and muon detector, and muon detector only. Detector signatures utilized are long time-of-flight to the outer muon system and anomalously high (or low) energy deposition in the inner tracker. The data are consistent with the expected background, and upper limits are set on the production cross section of long-lived gluinos, scalar top quarks, and scalar tau leptons, as well as pair produced long-lived leptons. Corresponding lower mass limits, ranging up to 1322 GeV/c$^2$ for gluinos, are the most stringent to date. | ||
| Links: e-print arXiv:1305.0491 [hep-ex] (PDF) ; CDS record ; inSPIRE record ; Public twiki page ; CADI line (restricted) ; | ||
| Figures | |
png pdf |
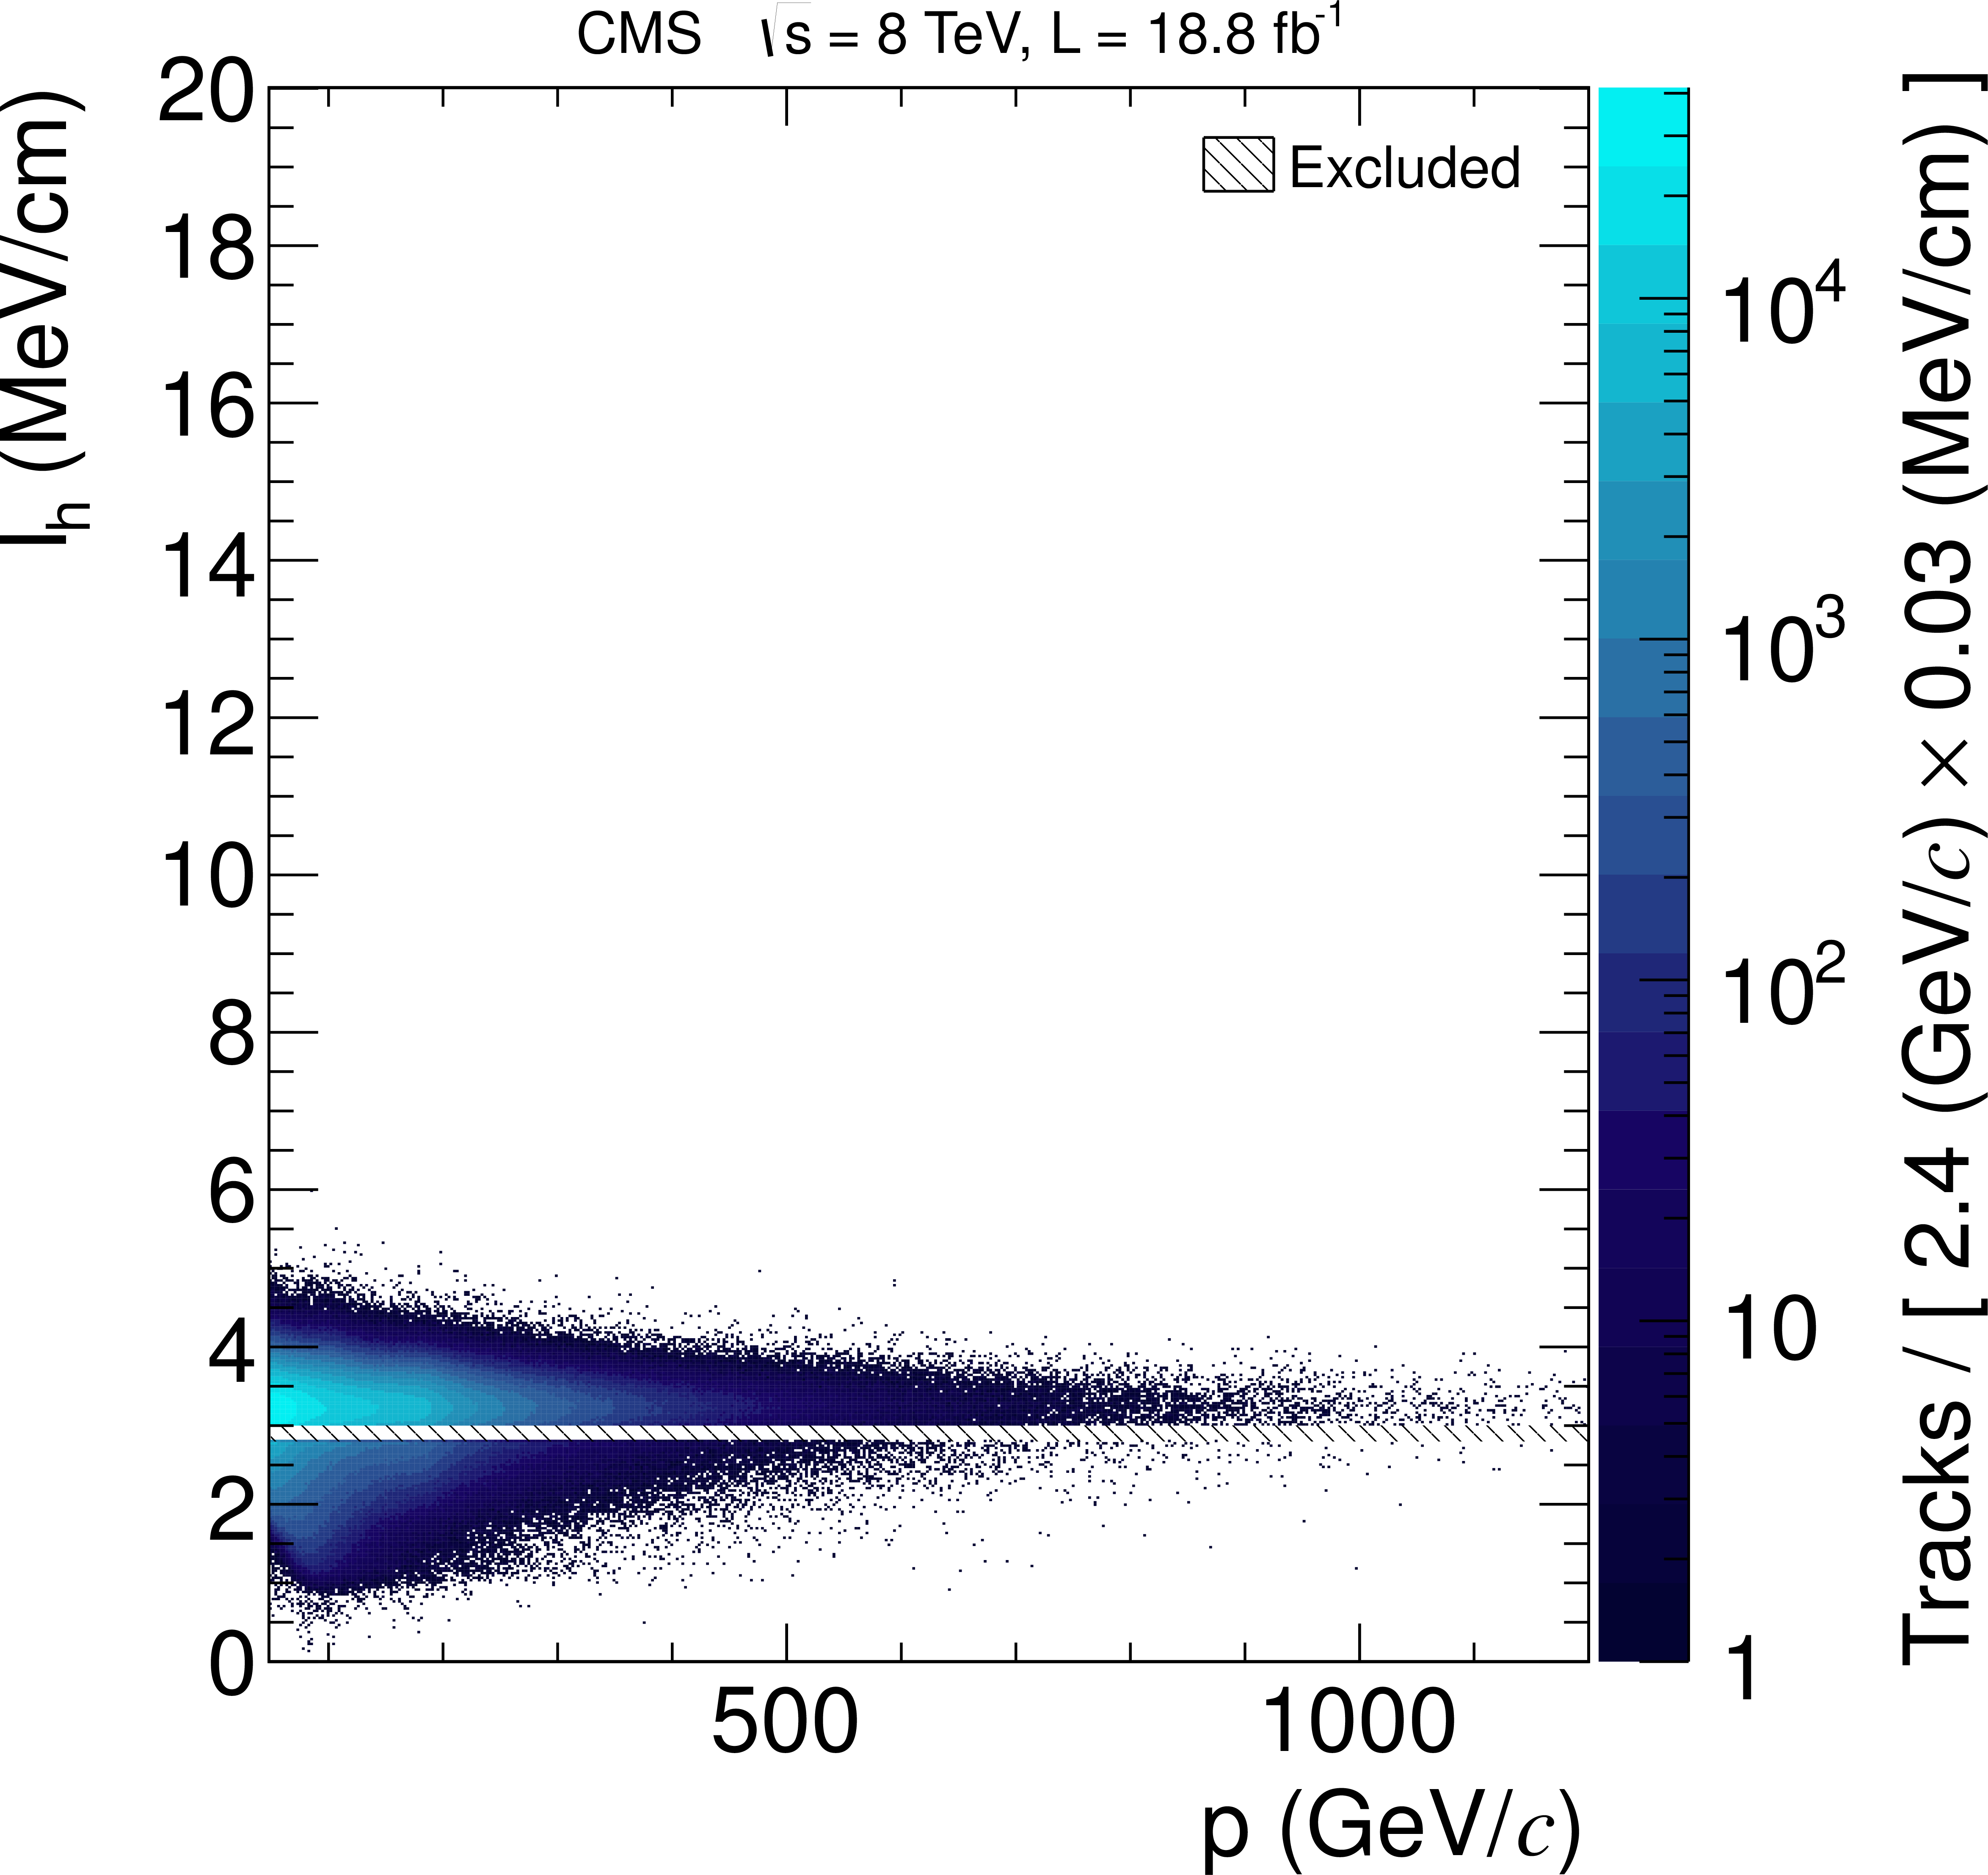
Figure 1-a:
Distribution of $I_h$, a $ {\mathrm {d}E/\mathrm {d}x} $ estimator that is defined in the text, versus particle momentum for $\sqrt {s} =$ 8 TeV data (a) and also including MC simulated HSCP candidates of different charges (right). Tracks with 2.8 $\leq I_h \leq $ 3.0 MeV/cm are excluded by preselection requirements. |
png pdf |
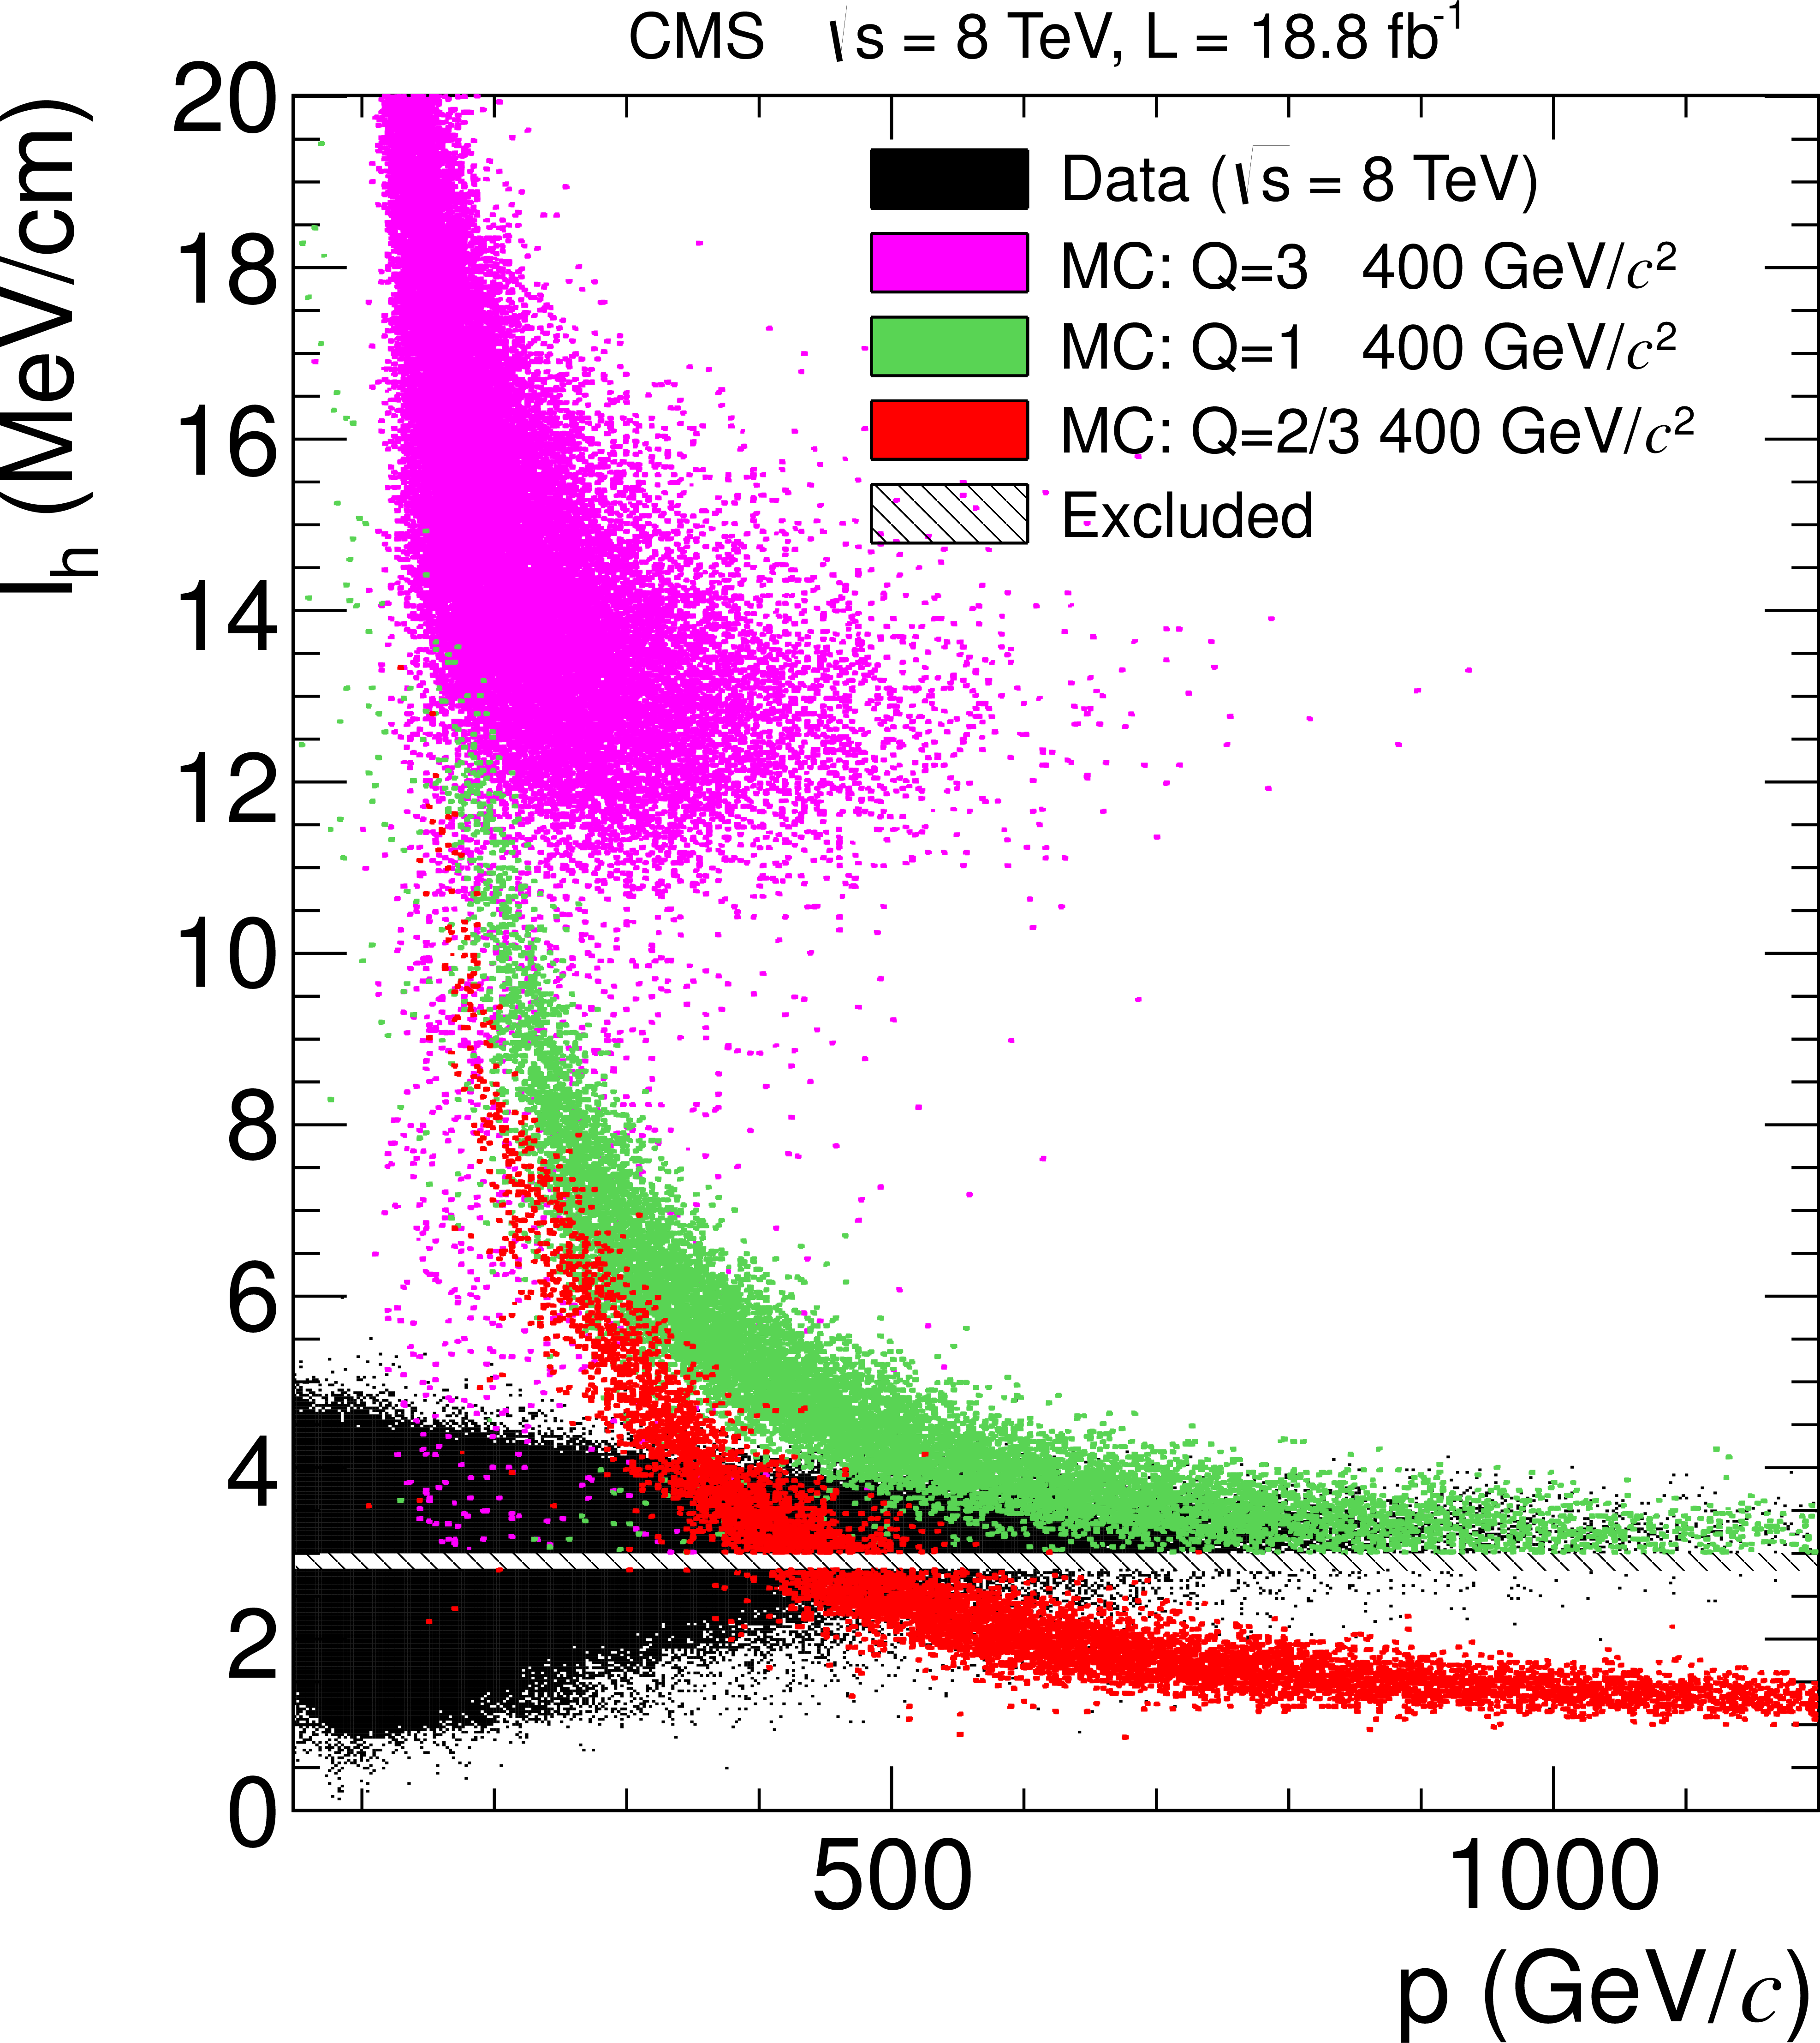
Figure 1-b:
Distribution of $I_h$, a $ {\mathrm {d}E/\mathrm {d}x} $ estimator that is defined in the text, versus particle momentum for $\sqrt {s} =$ 8 TeV data (a) and also including MC simulated HSCP candidates of different charges (right). Tracks with 2.8 $\leq I_h \leq $ 3.0 MeV/cm are excluded by preselection requirements. |
png pdf |
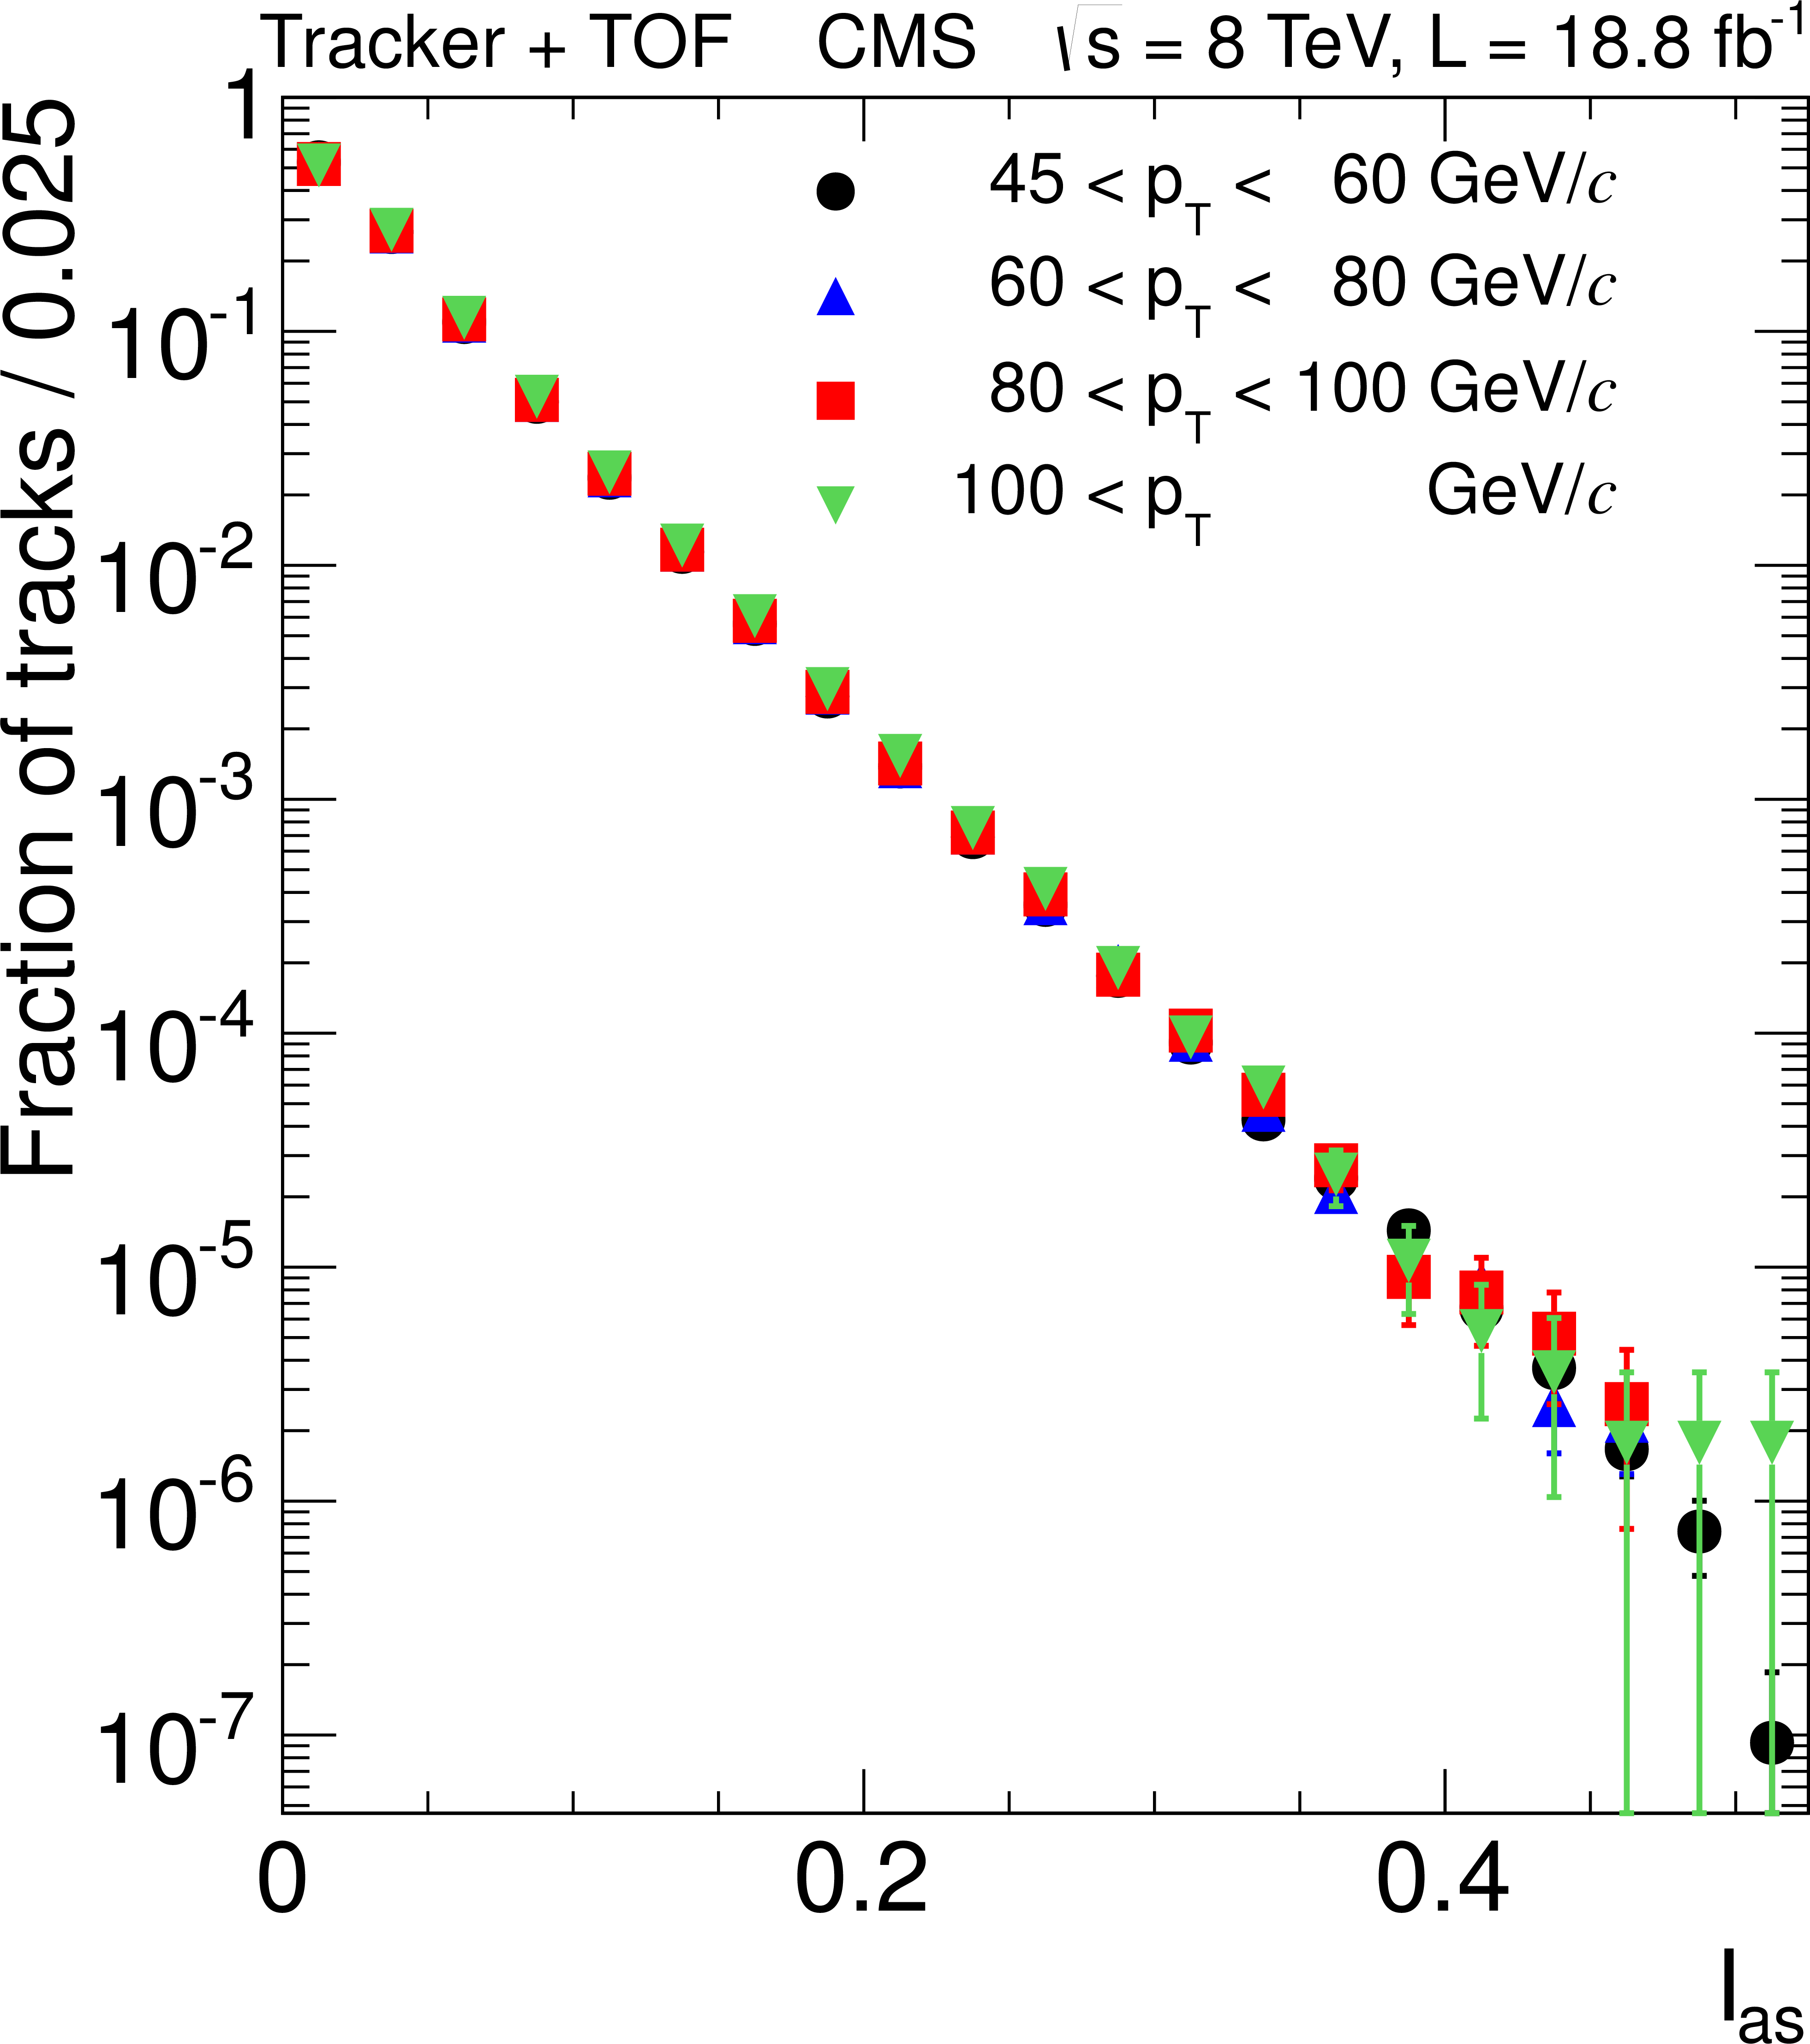
Figure 2-a:
Measured $I_{as}$ (a) and $1/\beta $ (middle) distributions for several $ {p_{\mathrm {T}}} $ ranges and measured $1/\beta $ distributions for several $I_{as}$ ranges (right). Results are for the tracker+TOF selection at $\sqrt {s} = 8$ TeV. The lack of variation of the distributions for different ranges of the other variables demonstrates the lack of strong correlation between $ {1/\beta } $, $ {I_{as}}$, and $ {p_{\mathrm {T}}} $. |
png pdf |
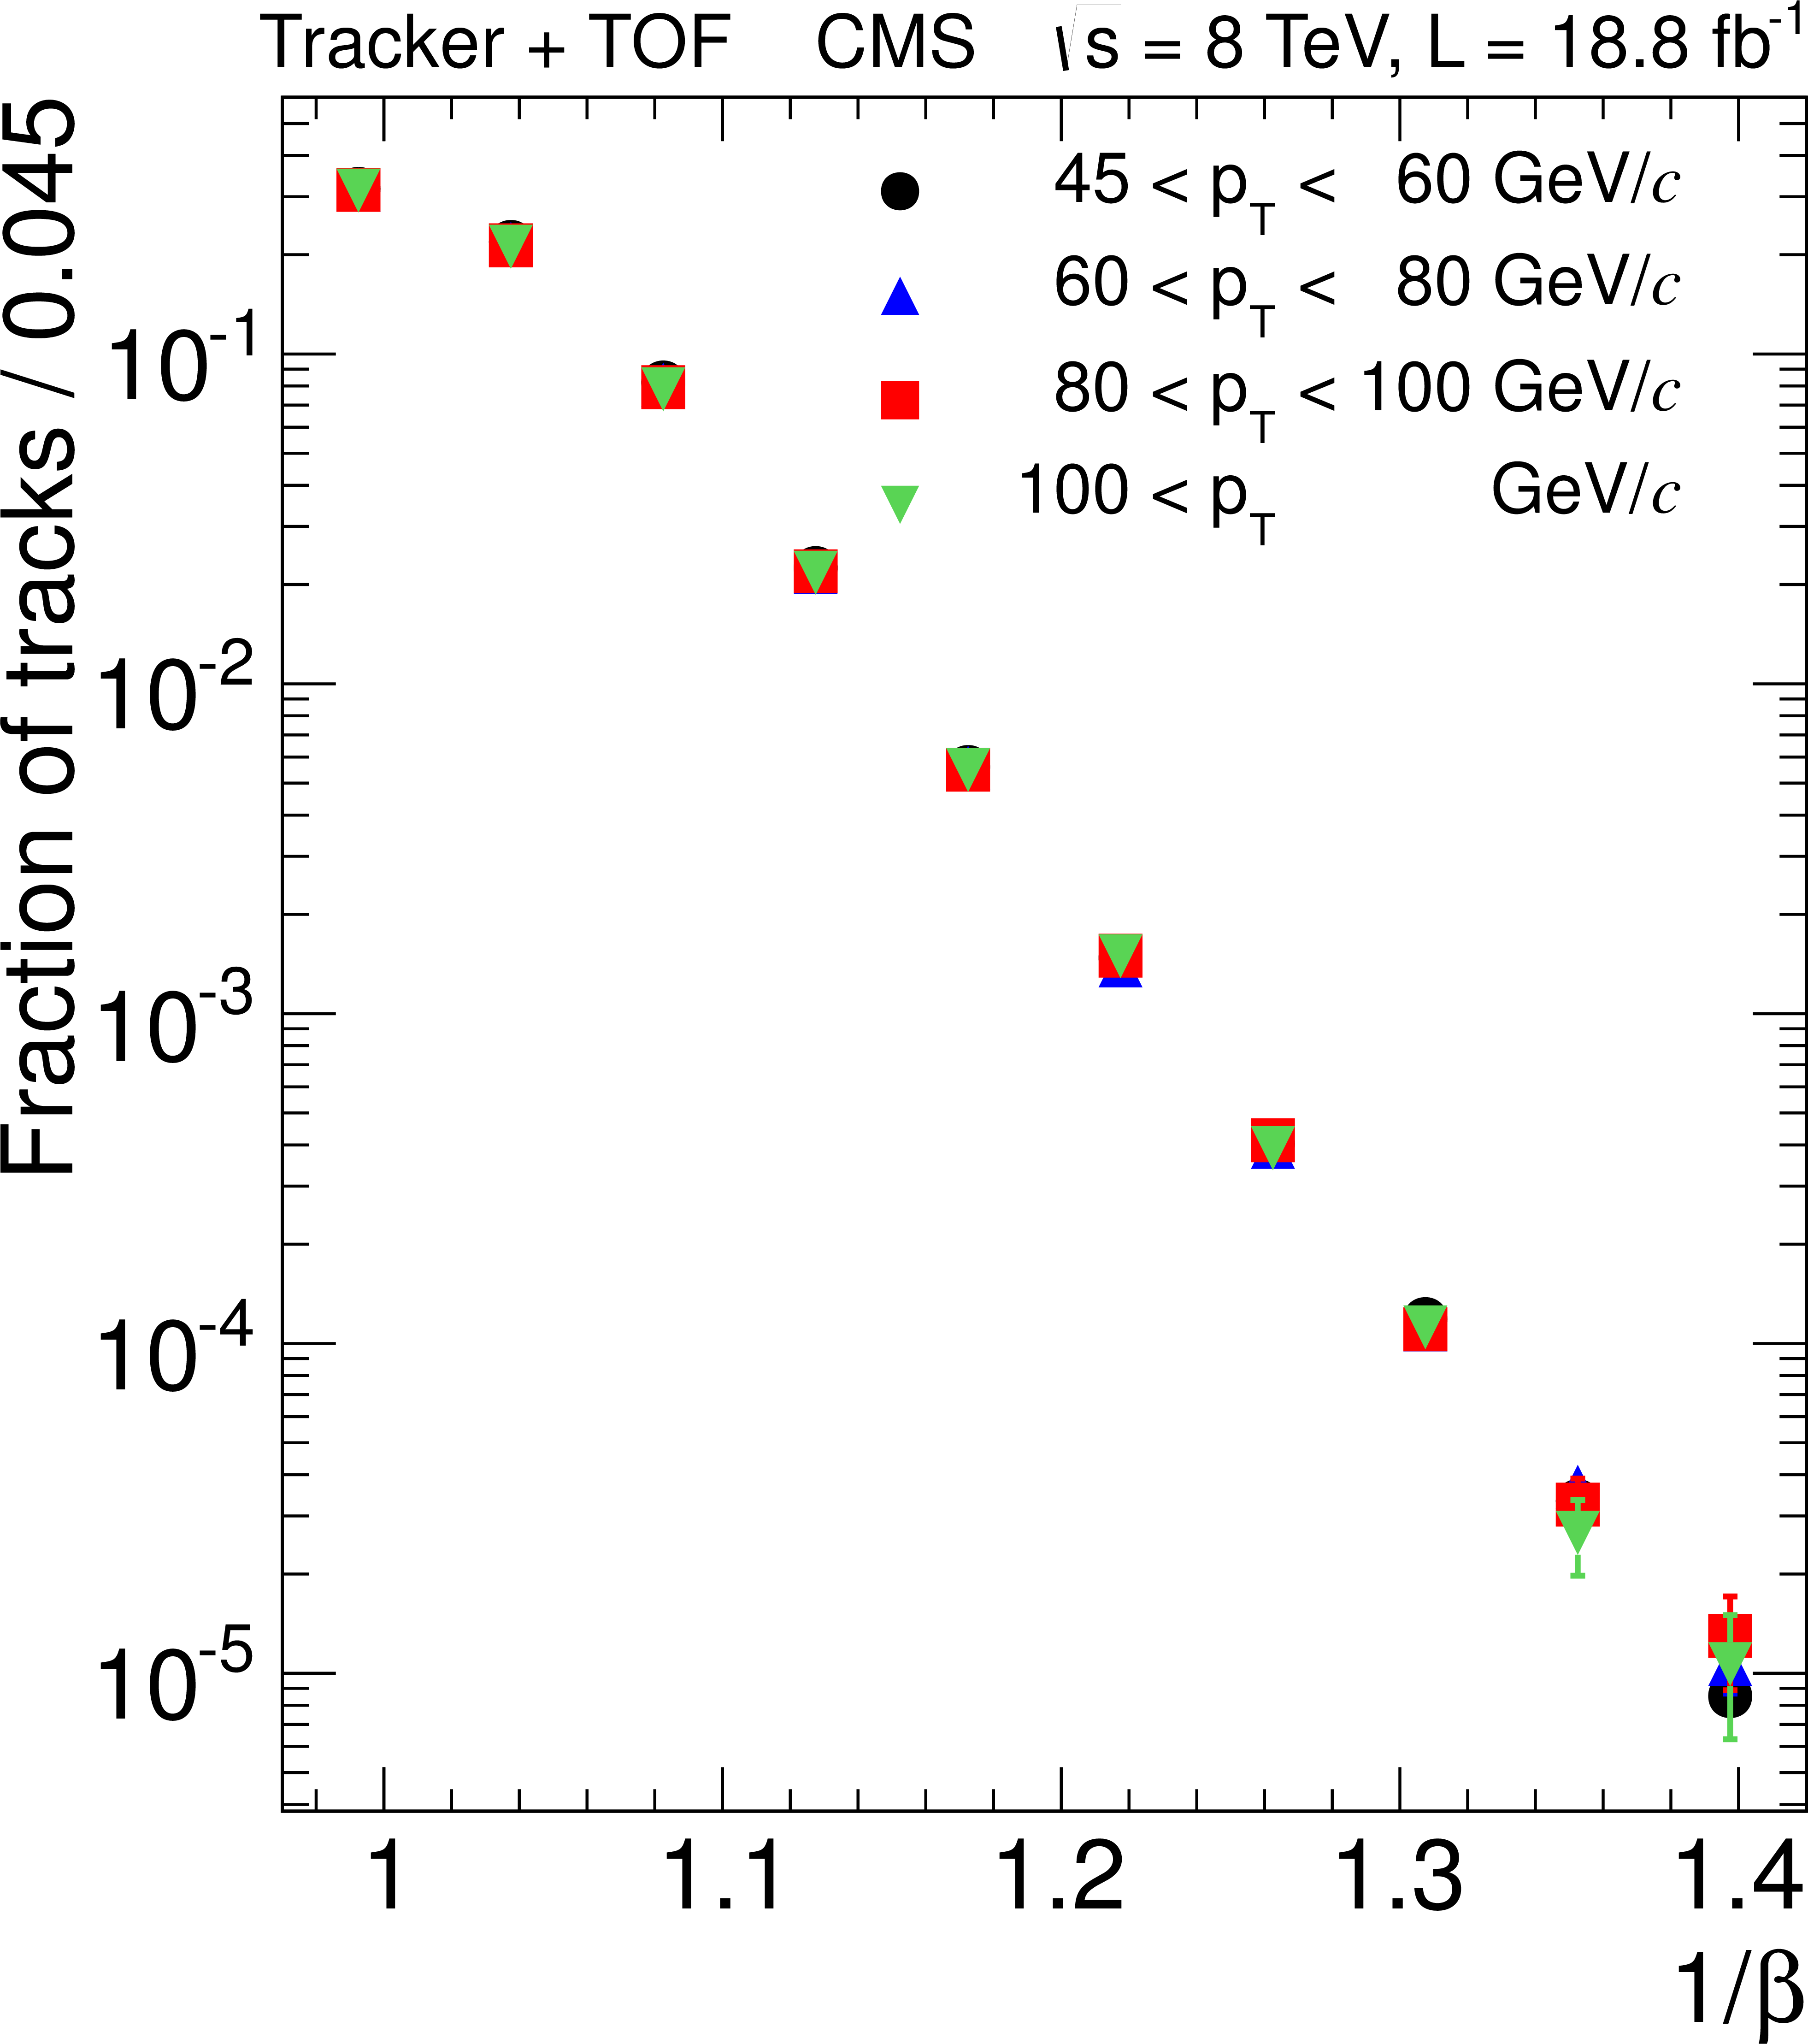
Figure 2-b:
Measured $I_{as}$ (a) and $1/\beta $ (middle) distributions for several $ {p_{\mathrm {T}}} $ ranges and measured $1/\beta $ distributions for several $I_{as}$ ranges (right). Results are for the tracker+TOF selection at $\sqrt {s} = 8$ TeV. The lack of variation of the distributions for different ranges of the other variables demonstrates the lack of strong correlation between $ {1/\beta } $, $ {I_{as}}$, and $ {p_{\mathrm {T}}} $. |

png pdf |
Figure 2-c:
Measured $I_{as}$ (a) and $1/\beta $ (middle) distributions for several $ {p_{\mathrm {T}}} $ ranges and measured $1/\beta $ distributions for several $I_{as}$ ranges (right). Results are for the tracker+TOF selection at $\sqrt {s} = 8$ TeV. The lack of variation of the distributions for different ranges of the other variables demonstrates the lack of strong correlation between $ {1/\beta } $, $ {I_{as}}$, and $ {p_{\mathrm {T}}} $. |
png pdf |
Figure 3-a:
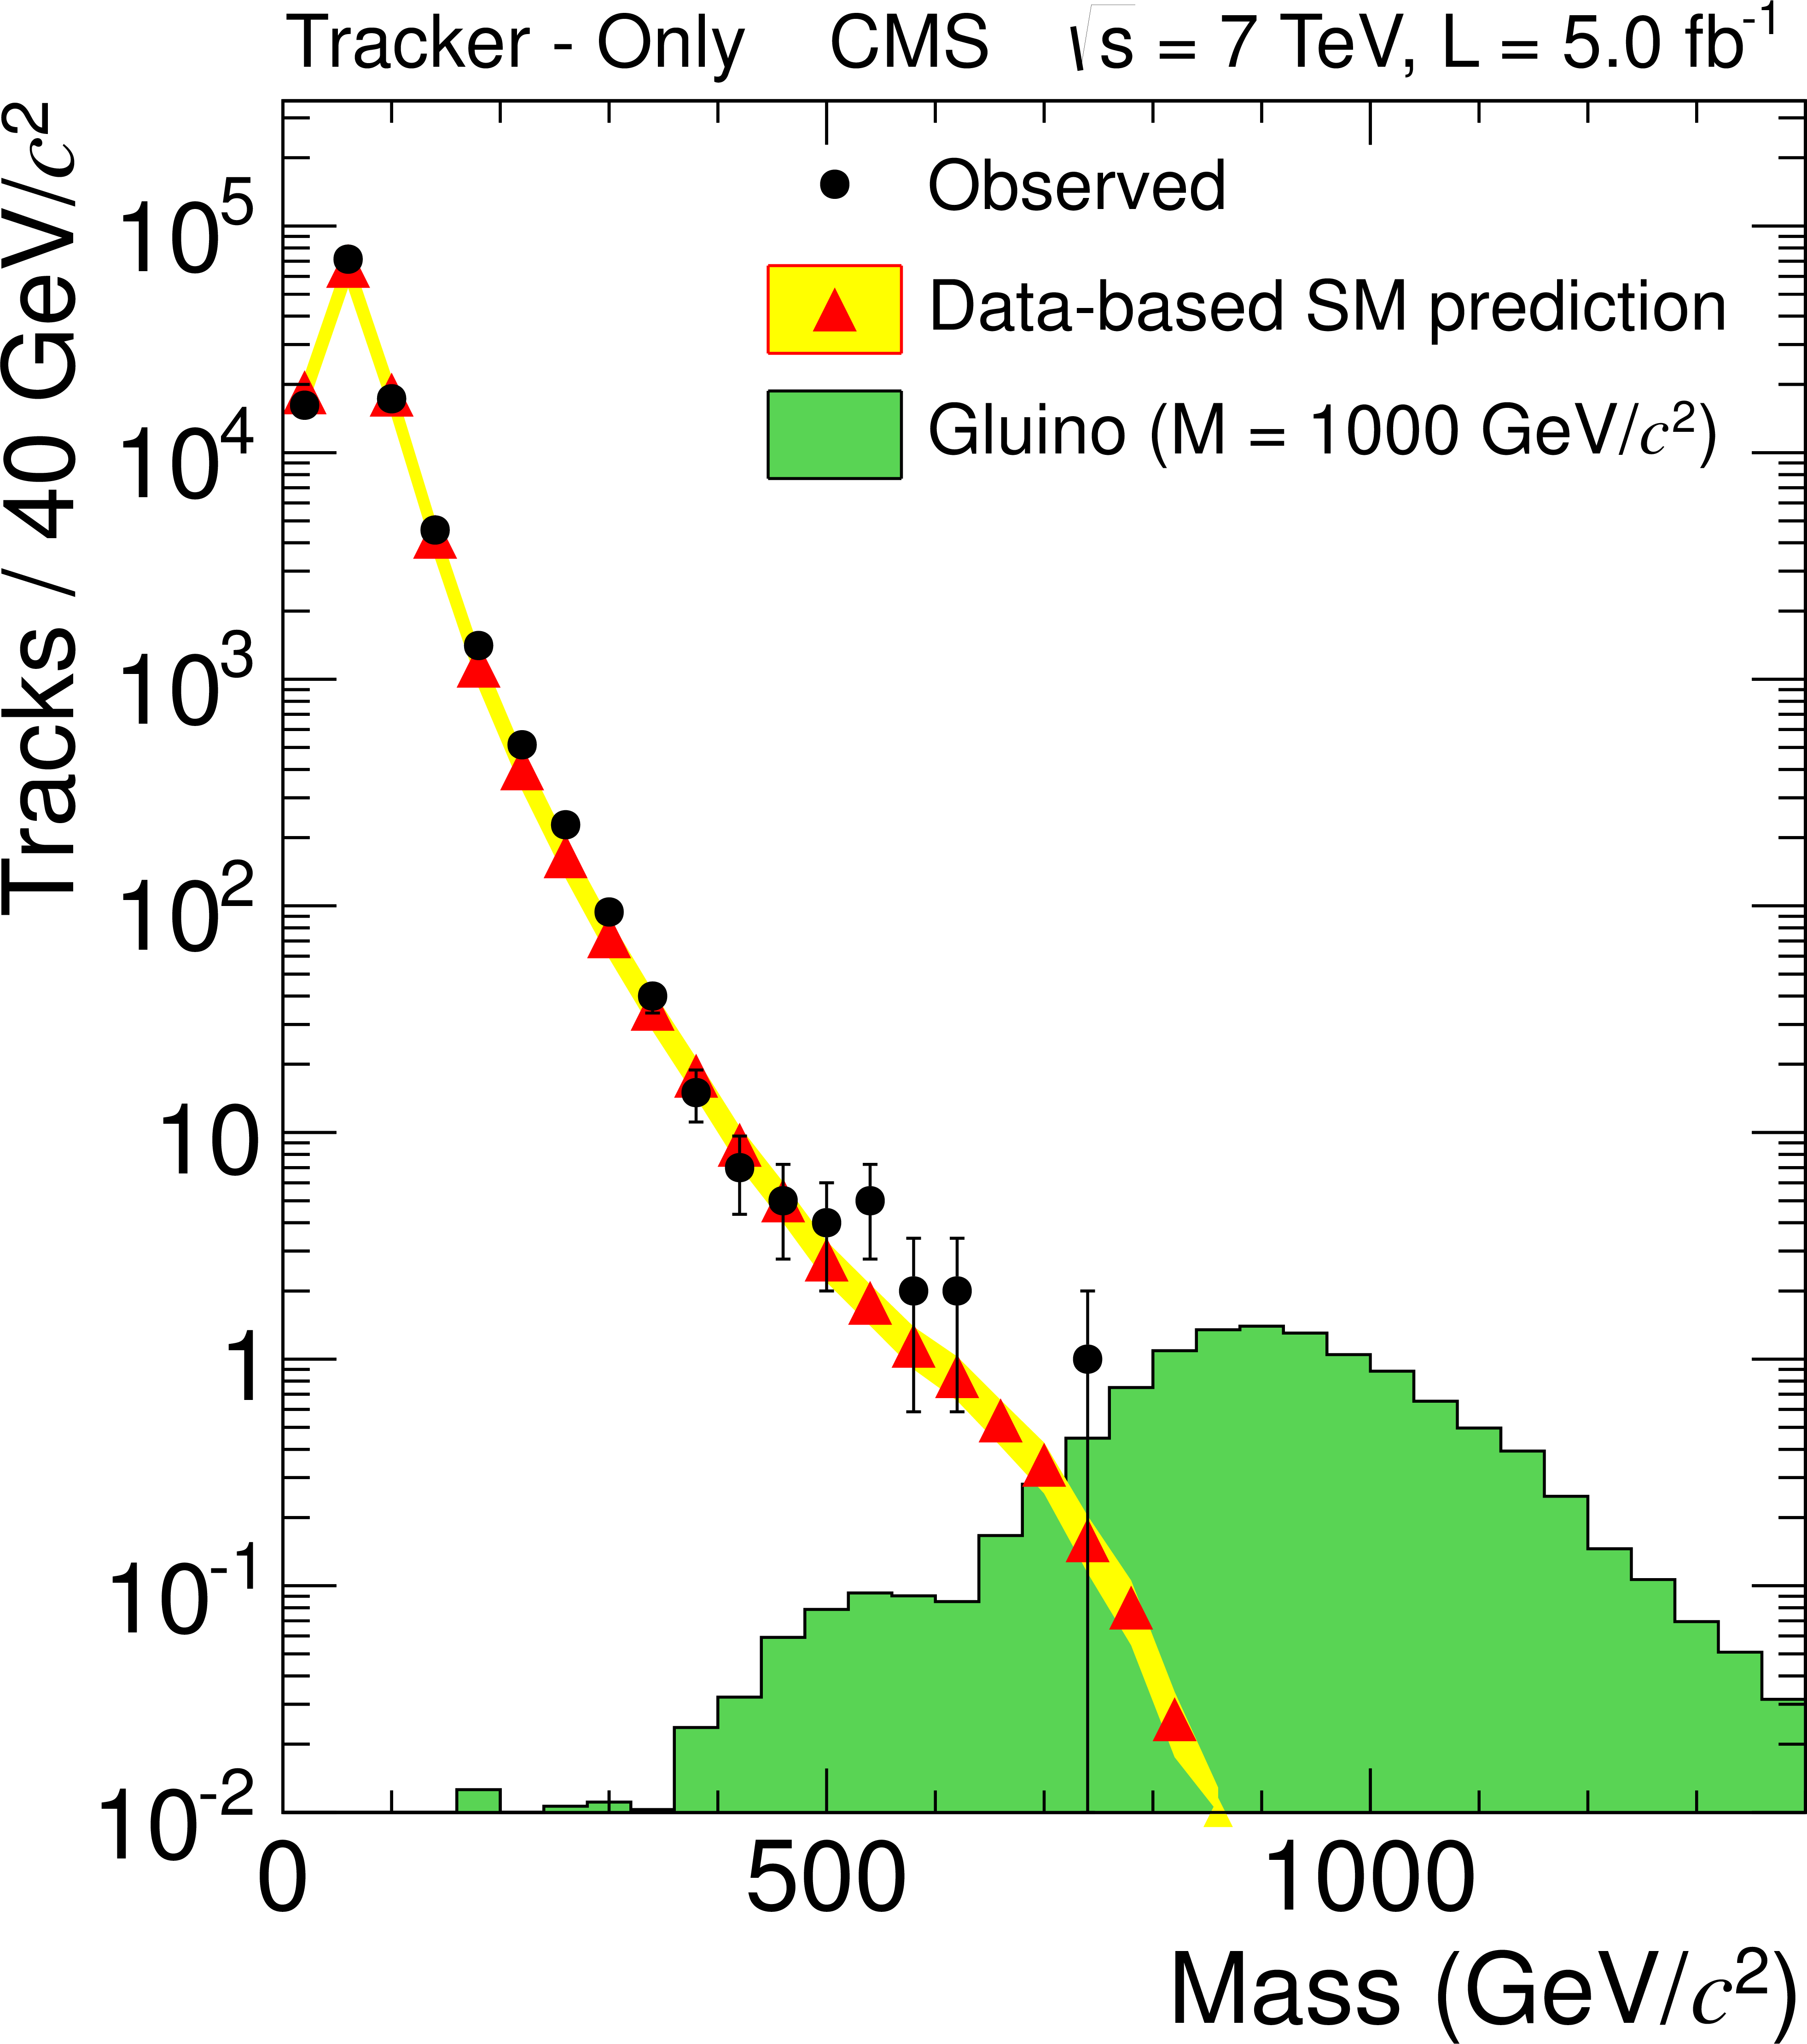
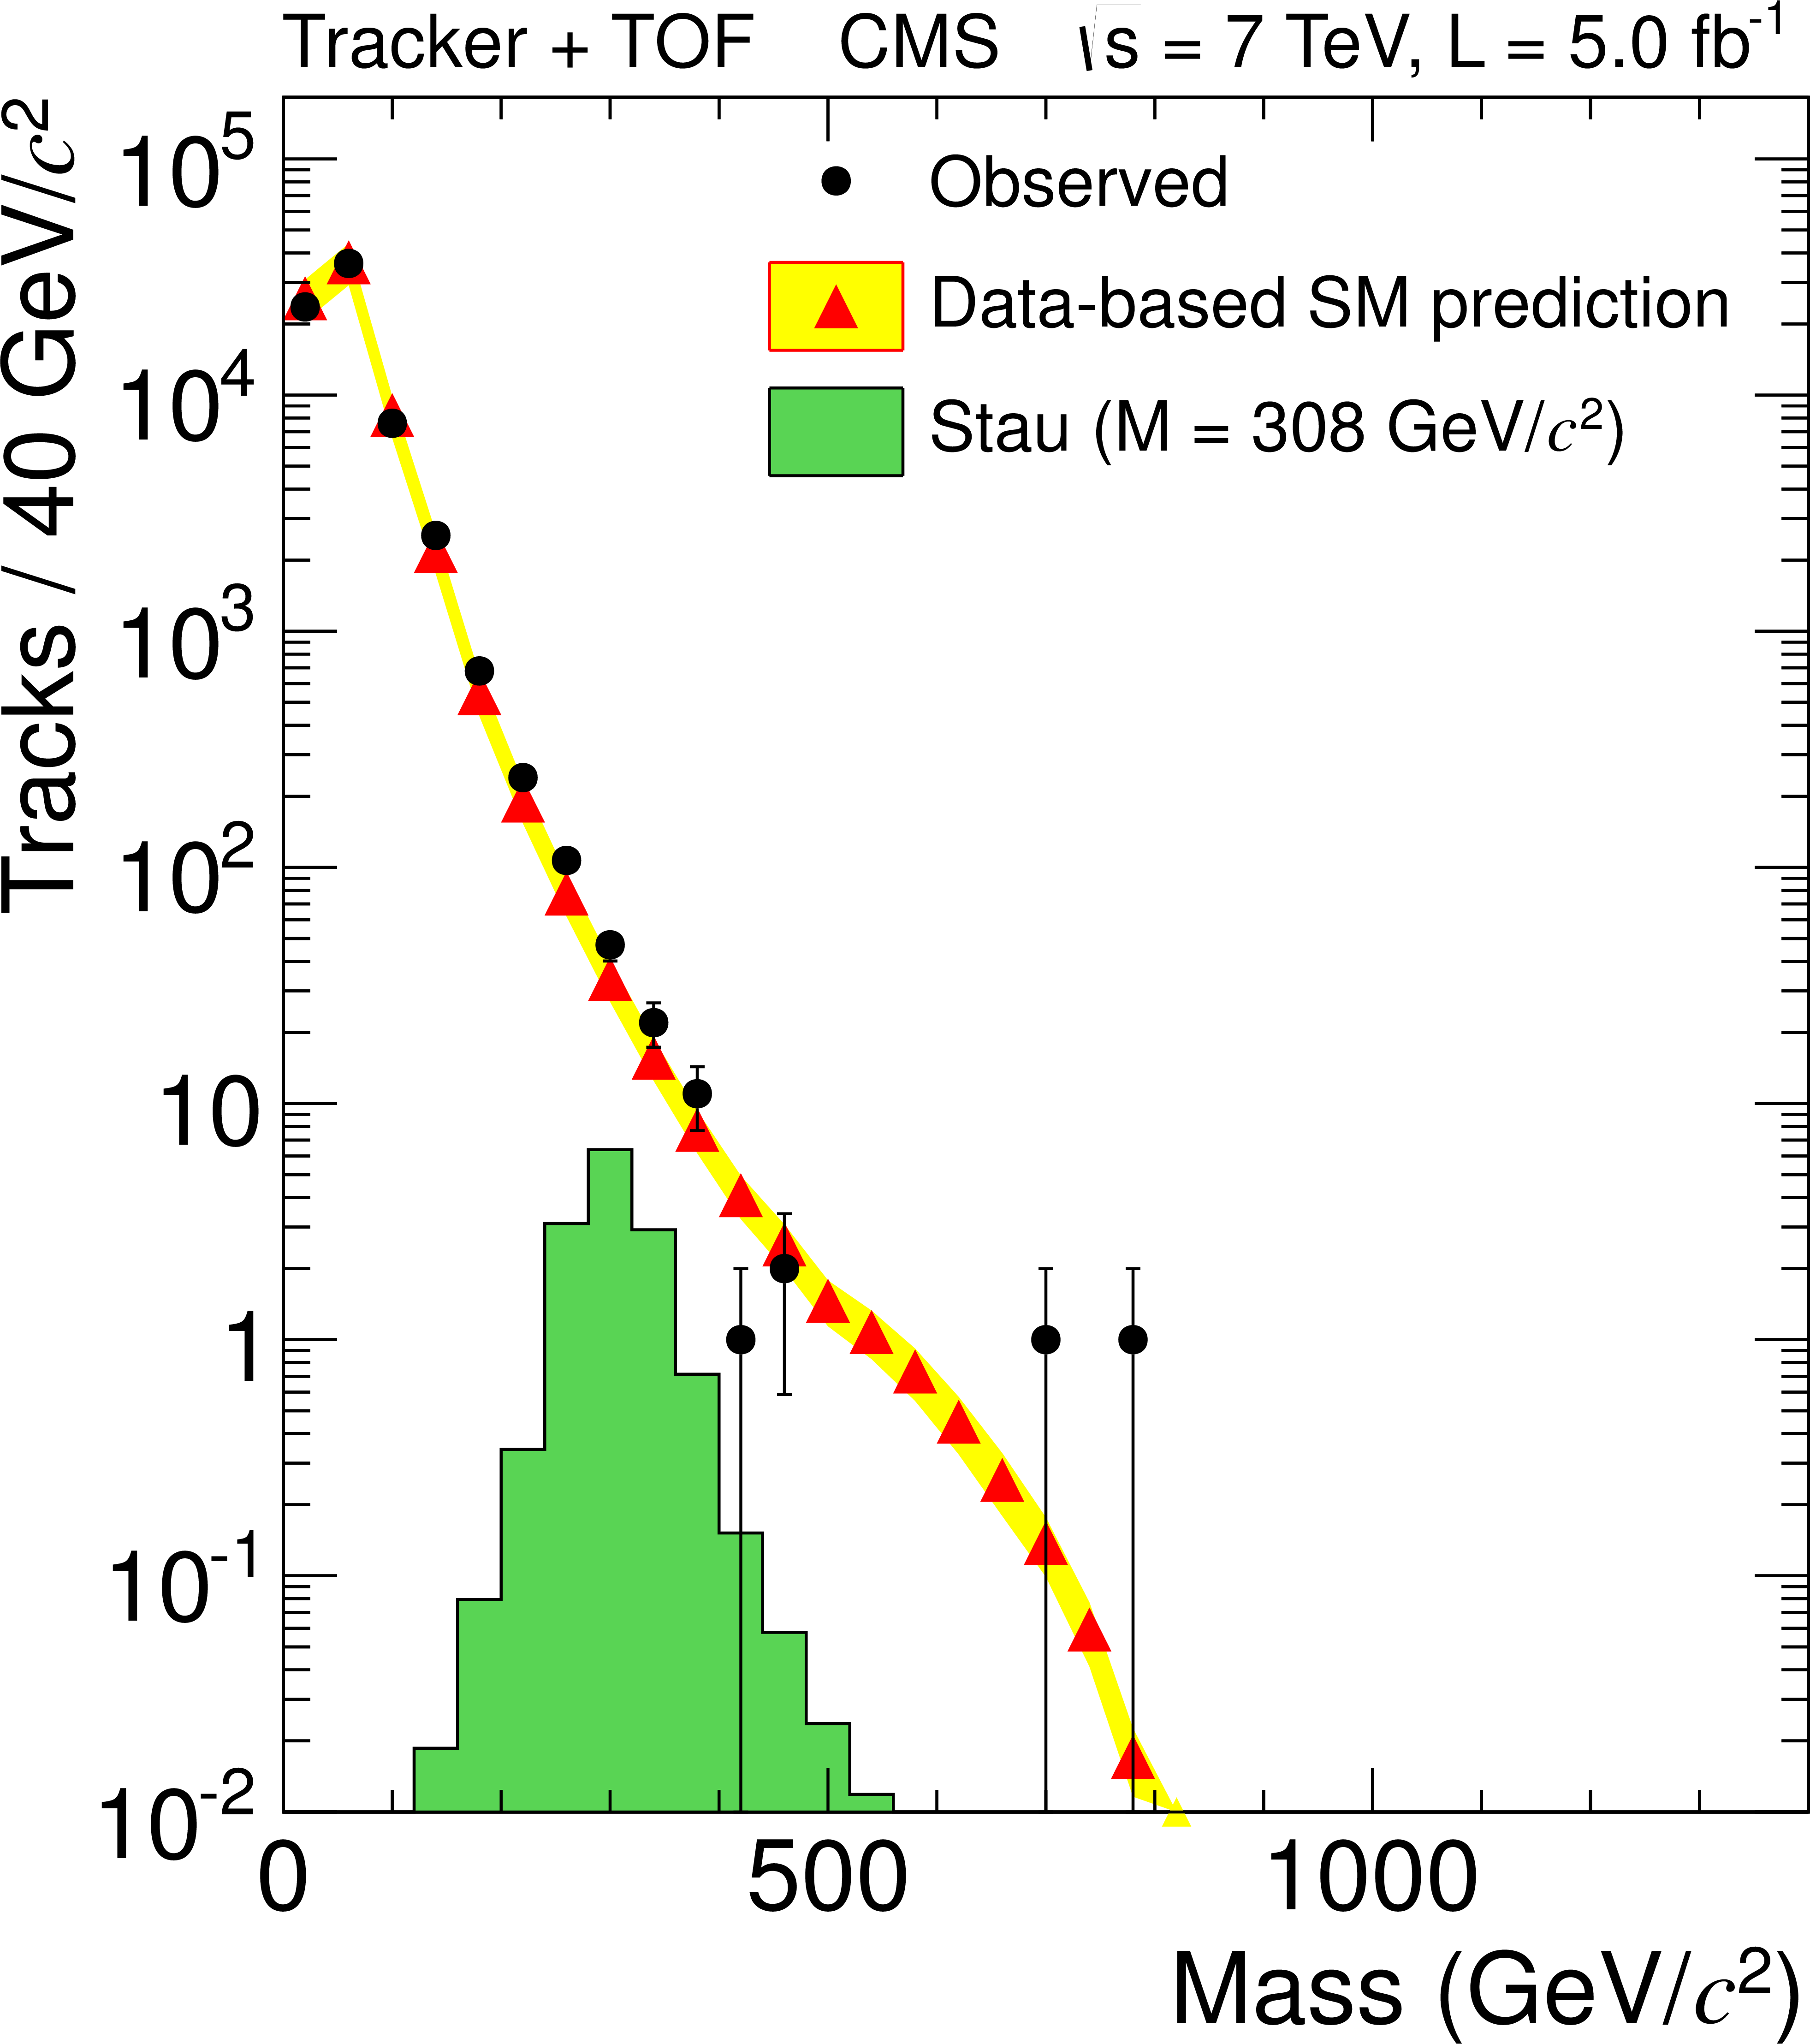
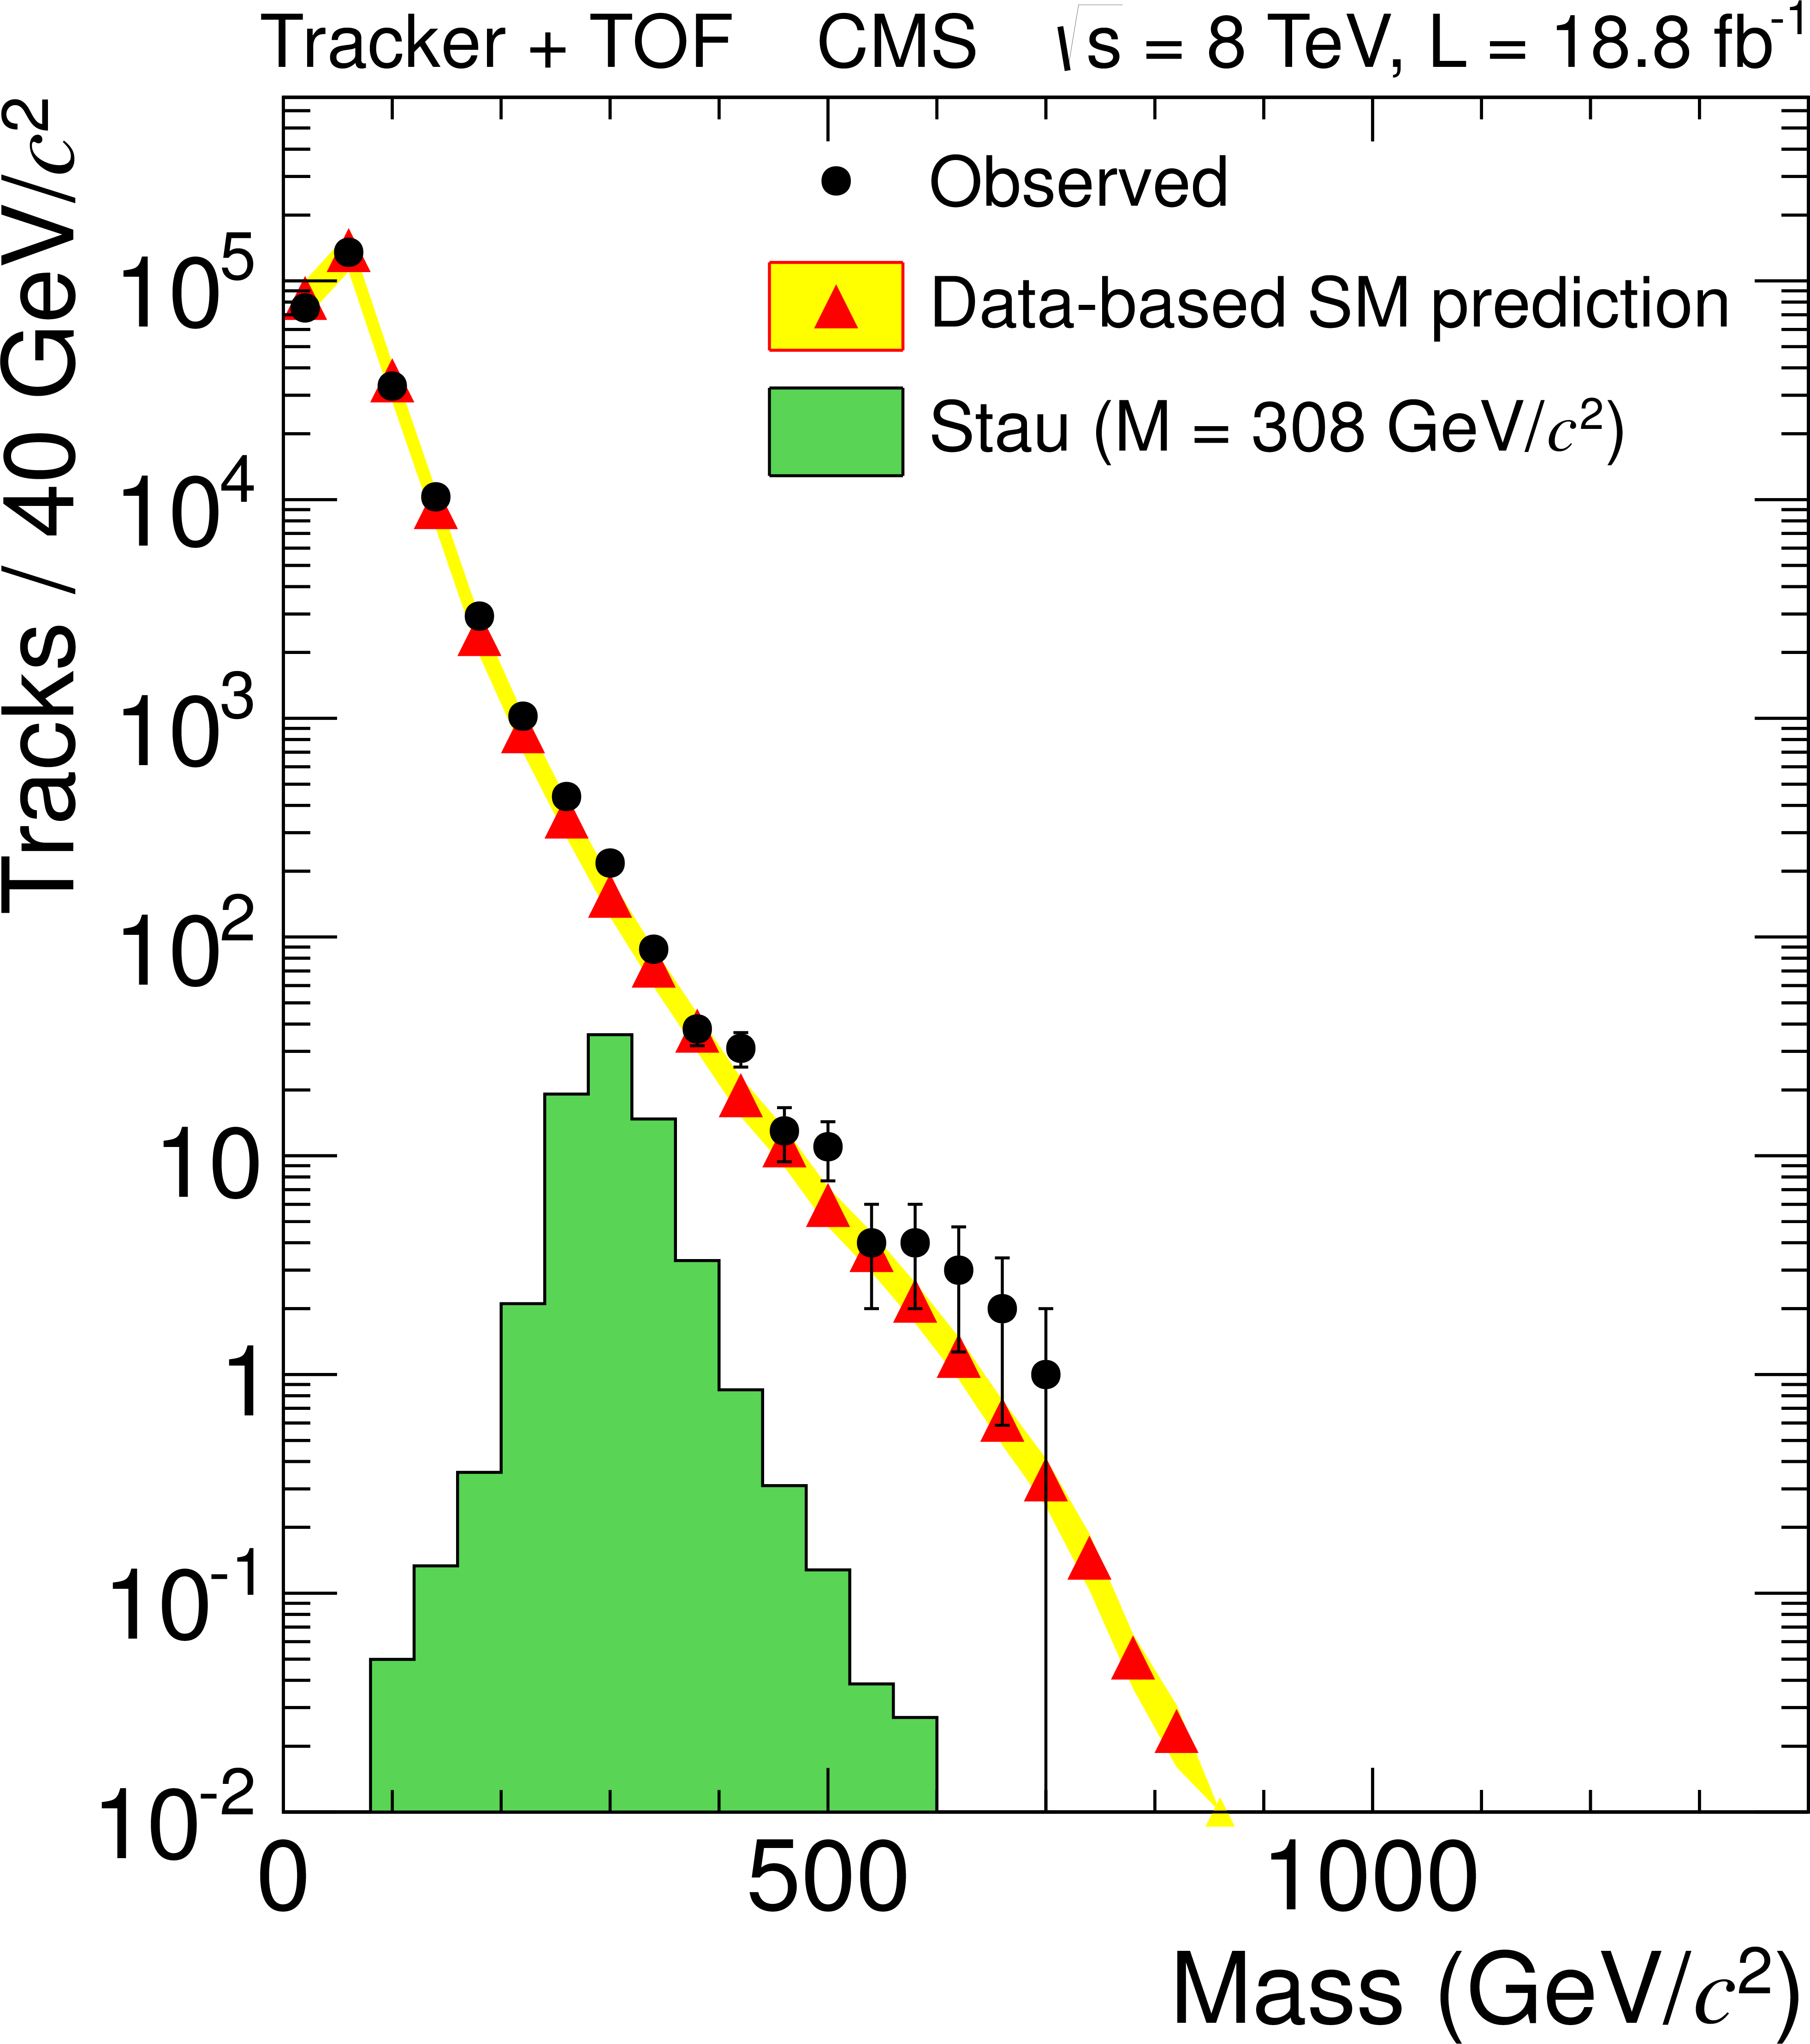
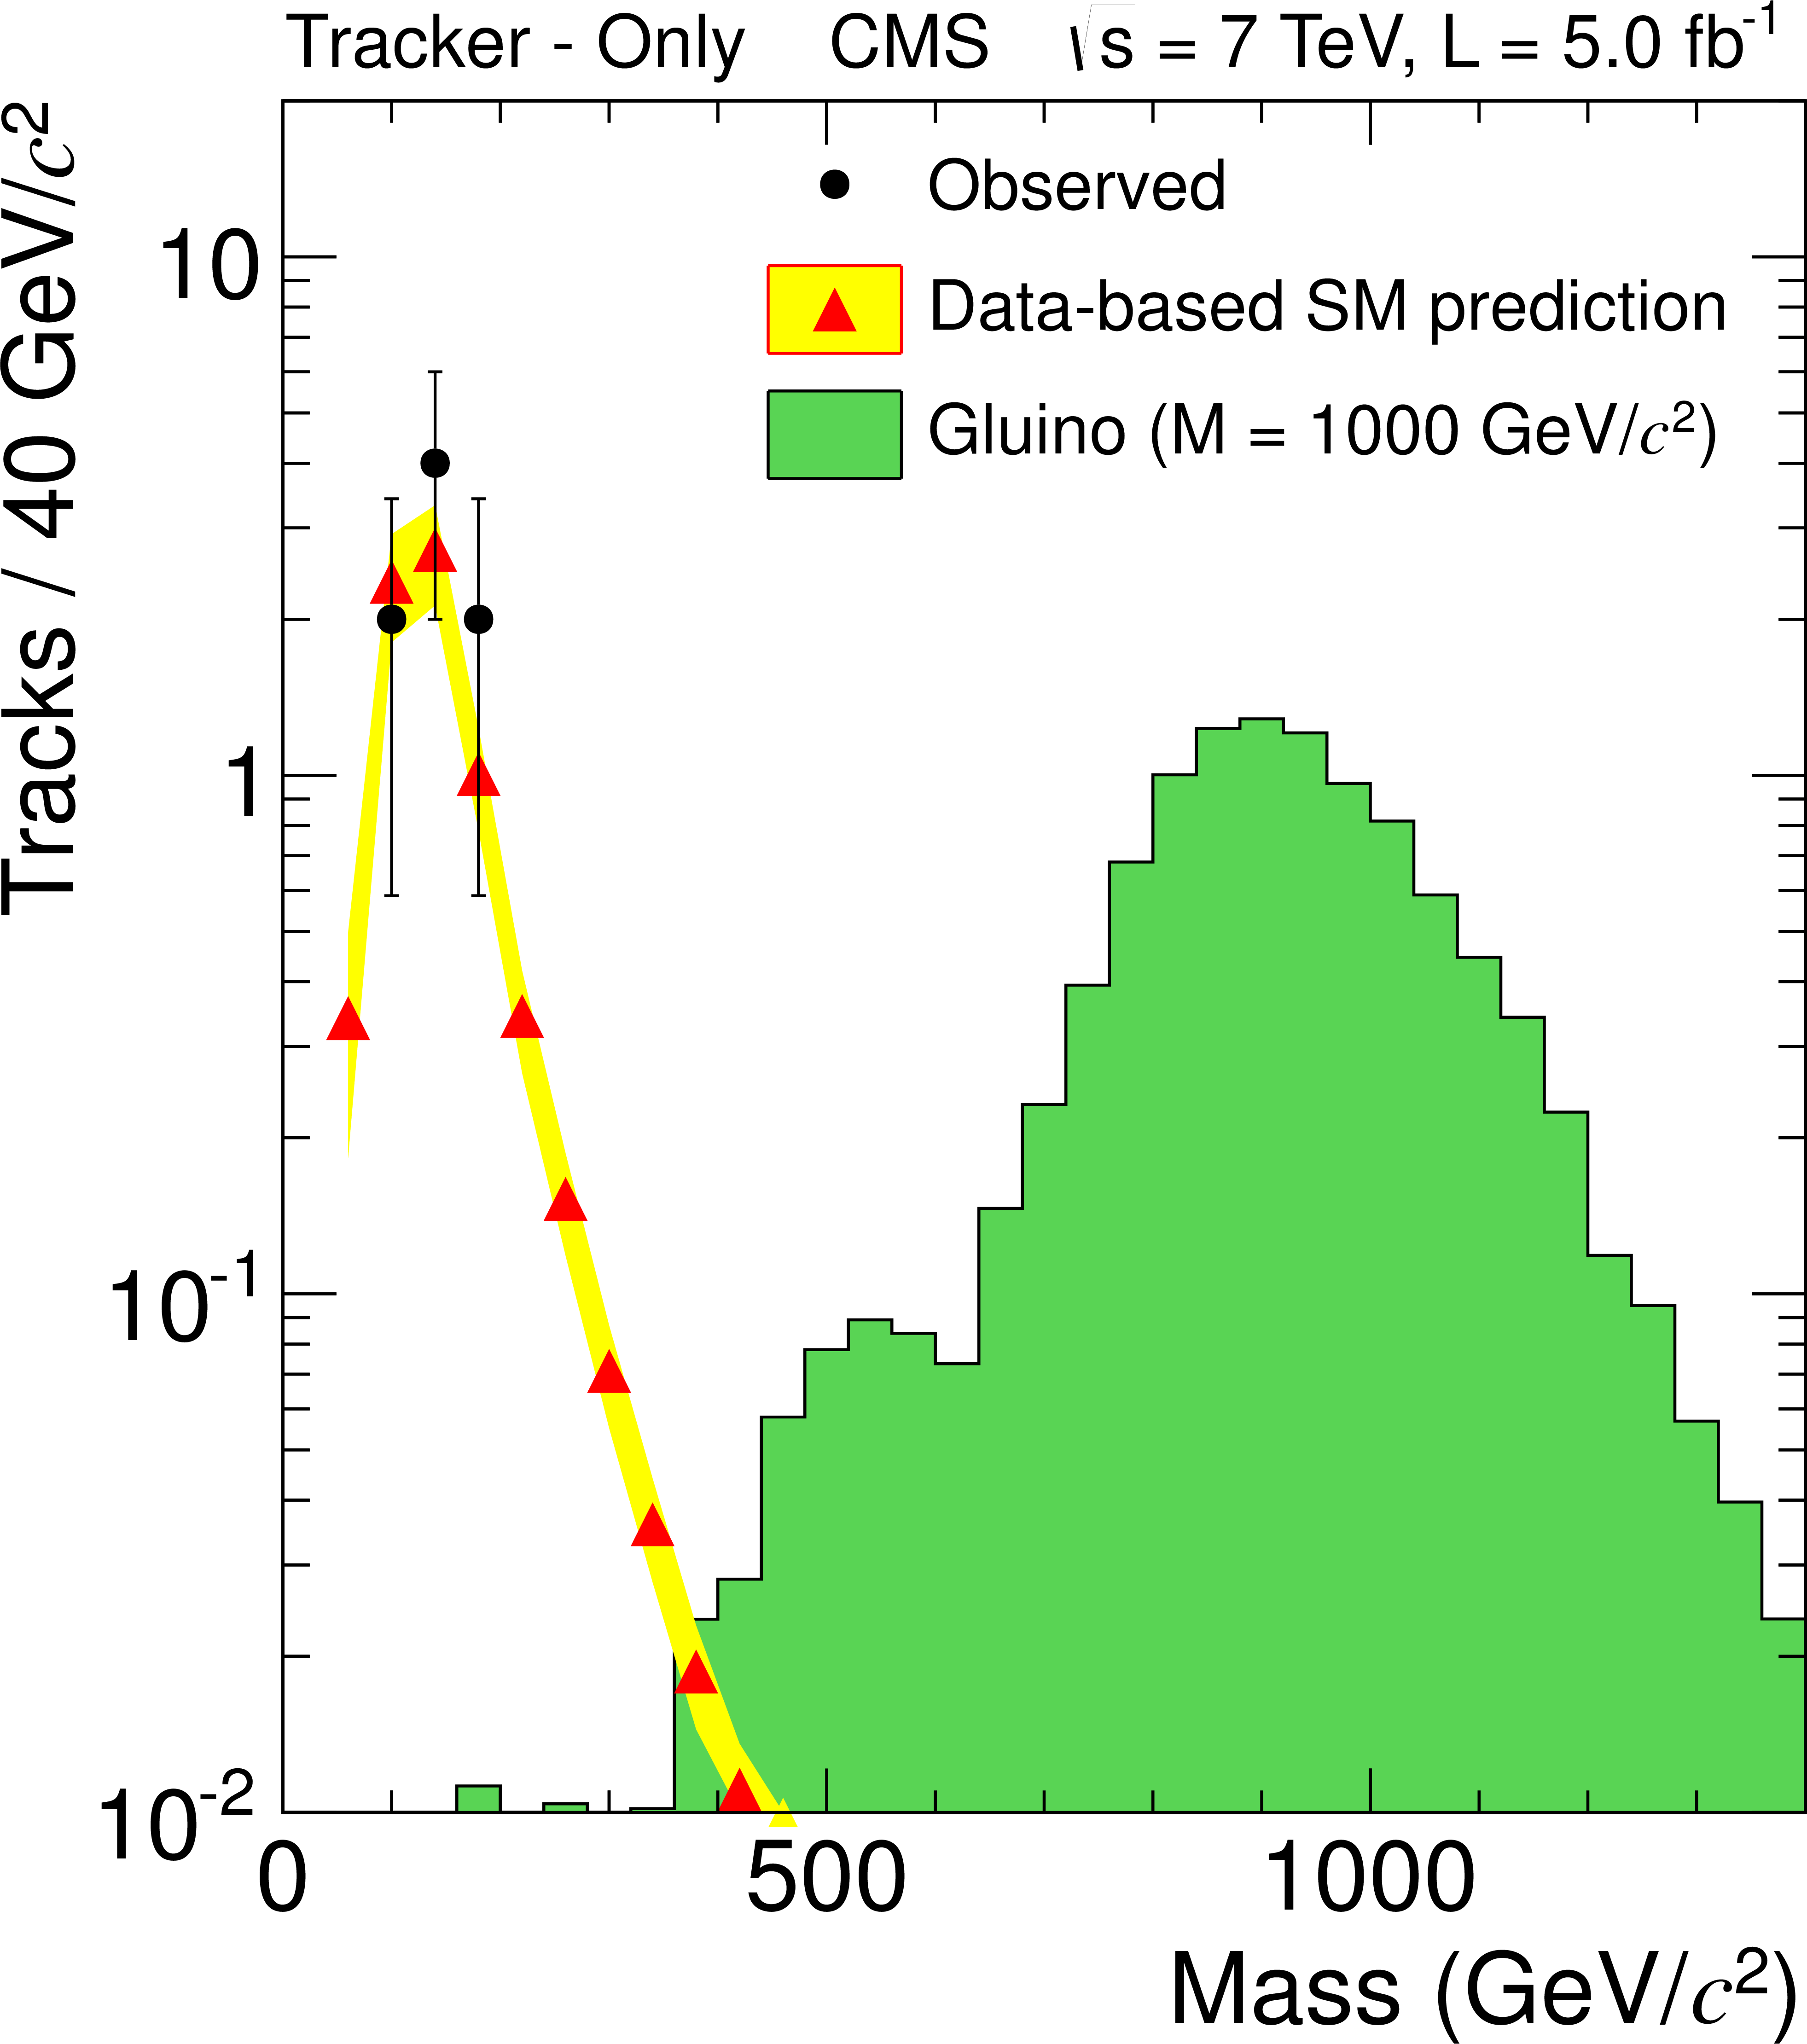
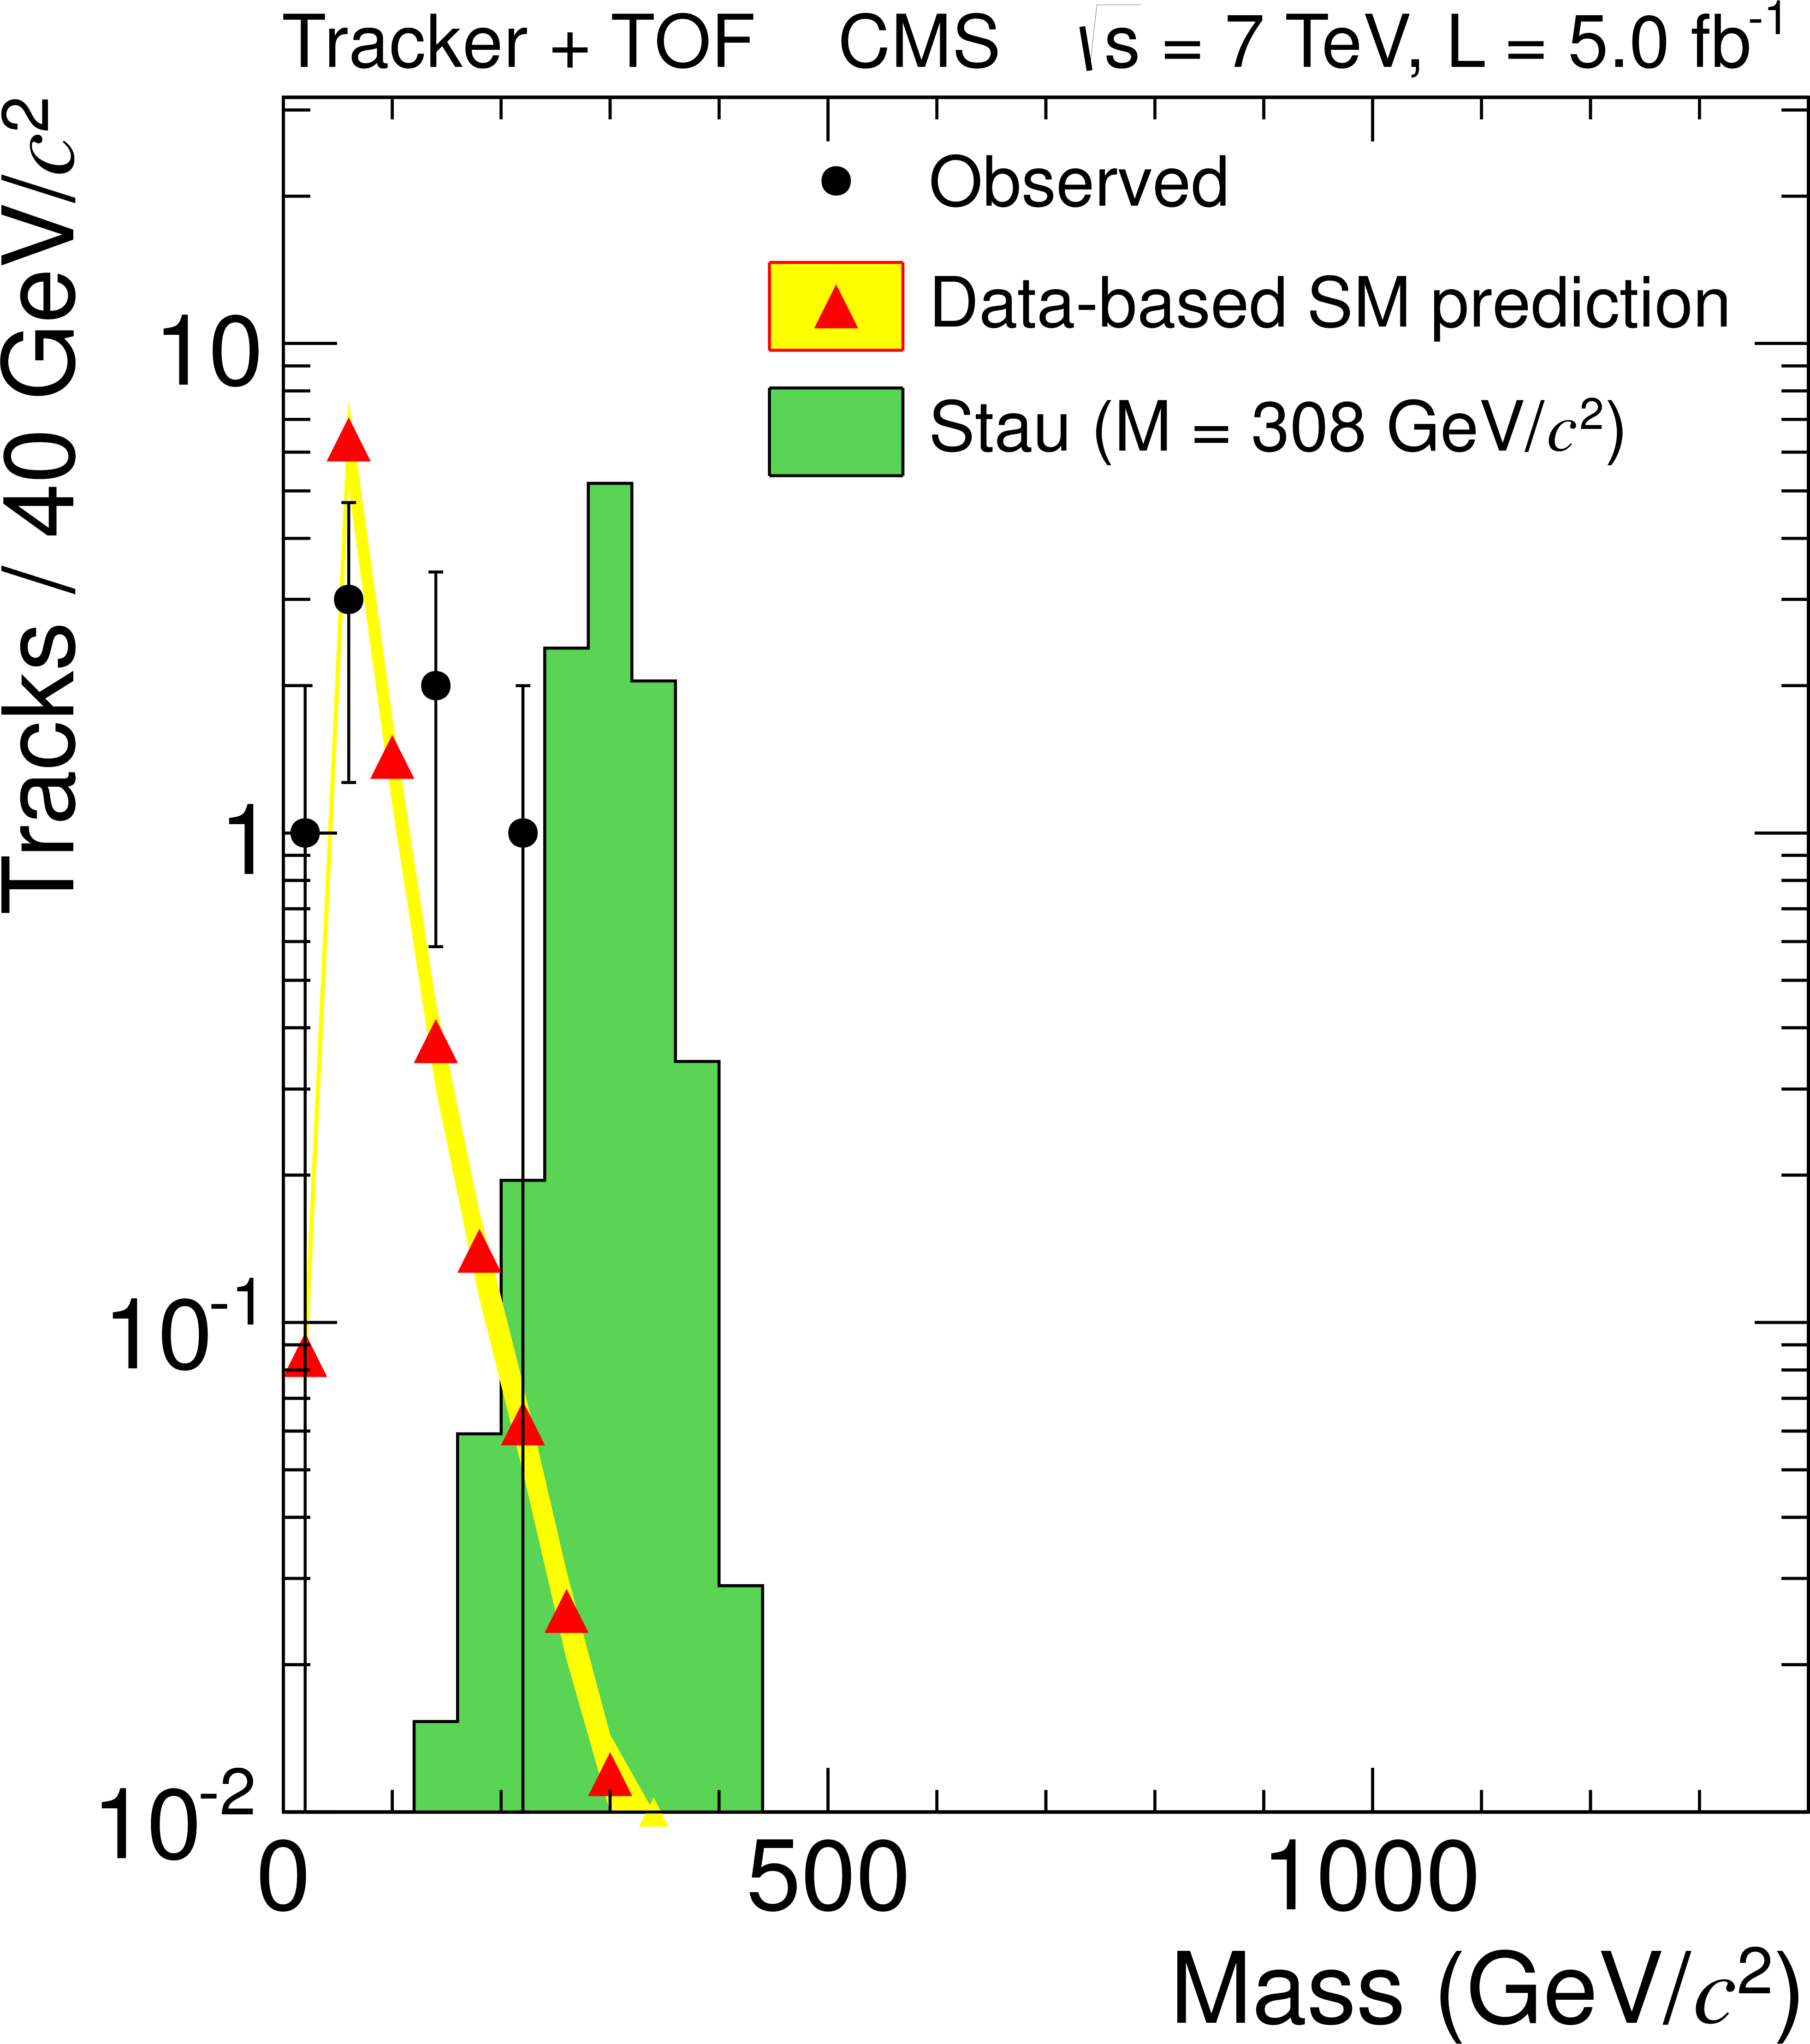
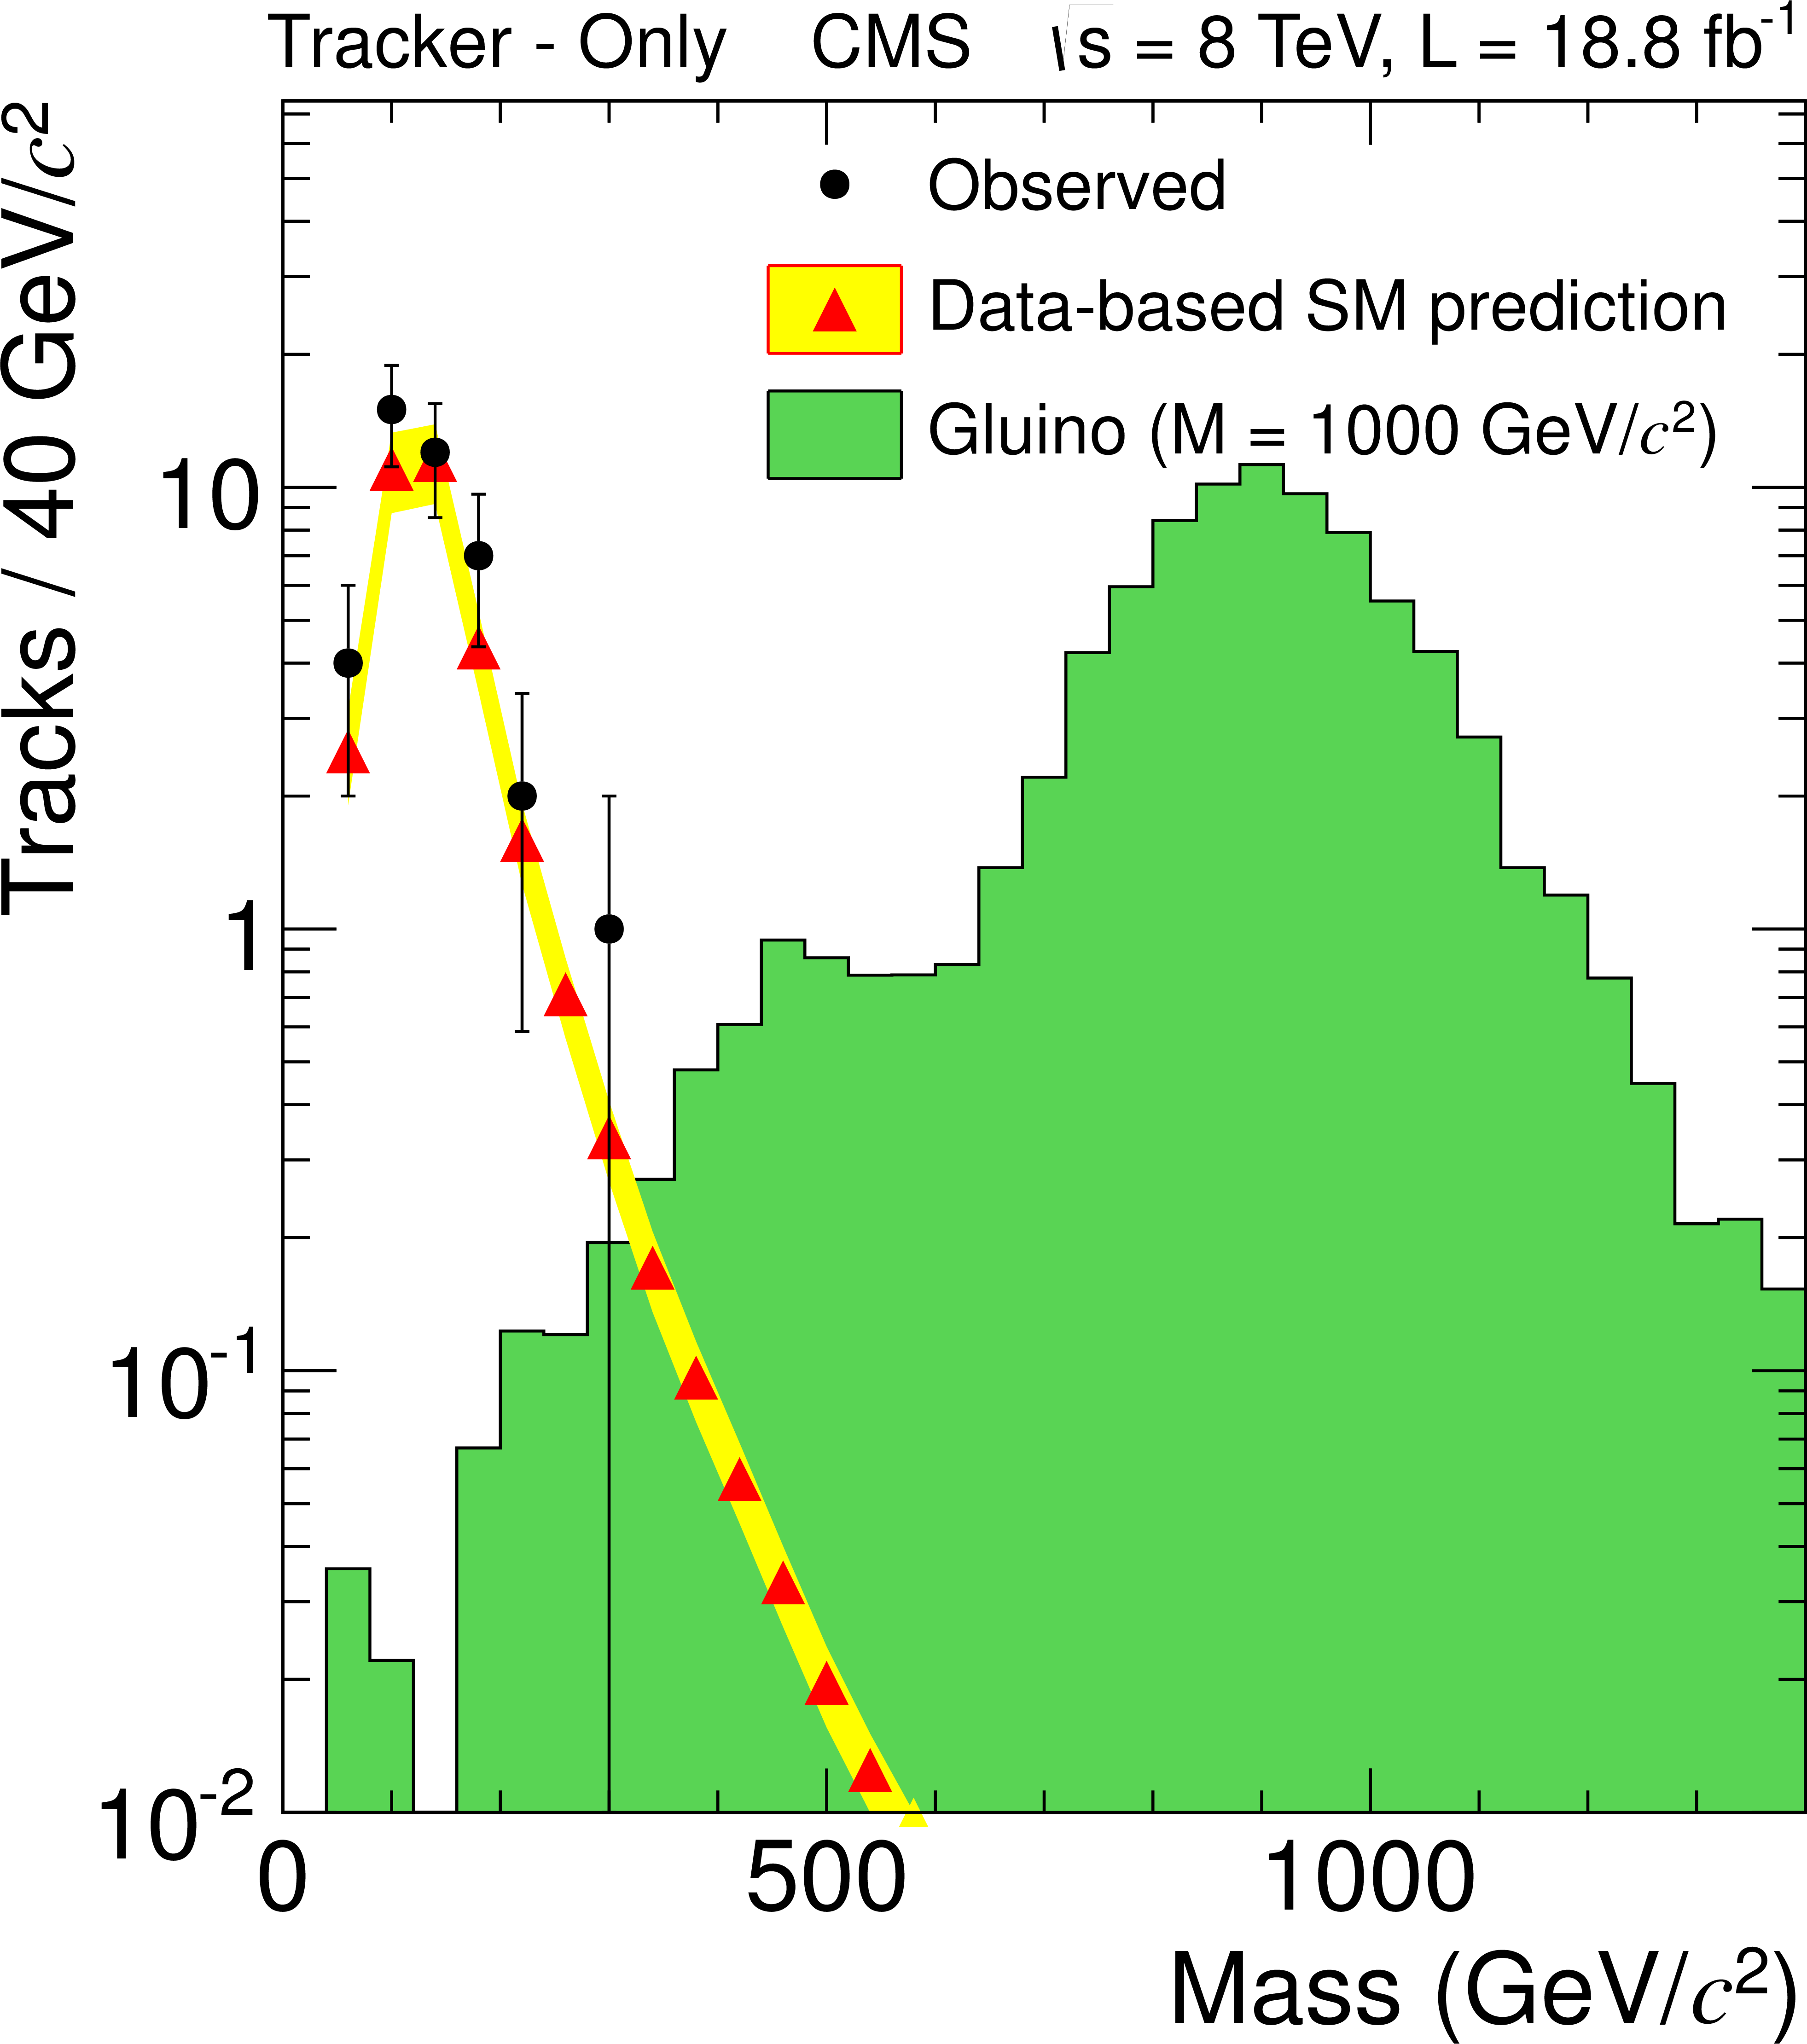
Observed and predicted mass spectra for candidates entering the tracker-only (a,c) or tracker+TOF (b,d) signal region for the loose selection. The expected distribution for a representative signal scaled to the integrated luminosity is shown as the shaded histogram. a,b (c,d) is for $\sqrt {s} =$ 7 (8) TeV. |
png pdf |
Figure 3-b:
Observed and predicted mass spectra for candidates entering the tracker-only (a,c) or tracker+TOF (b,d) signal region for the loose selection. The expected distribution for a representative signal scaled to the integrated luminosity is shown as the shaded histogram. a,b (c,d) is for $\sqrt {s} =$ 7 (8) TeV. |
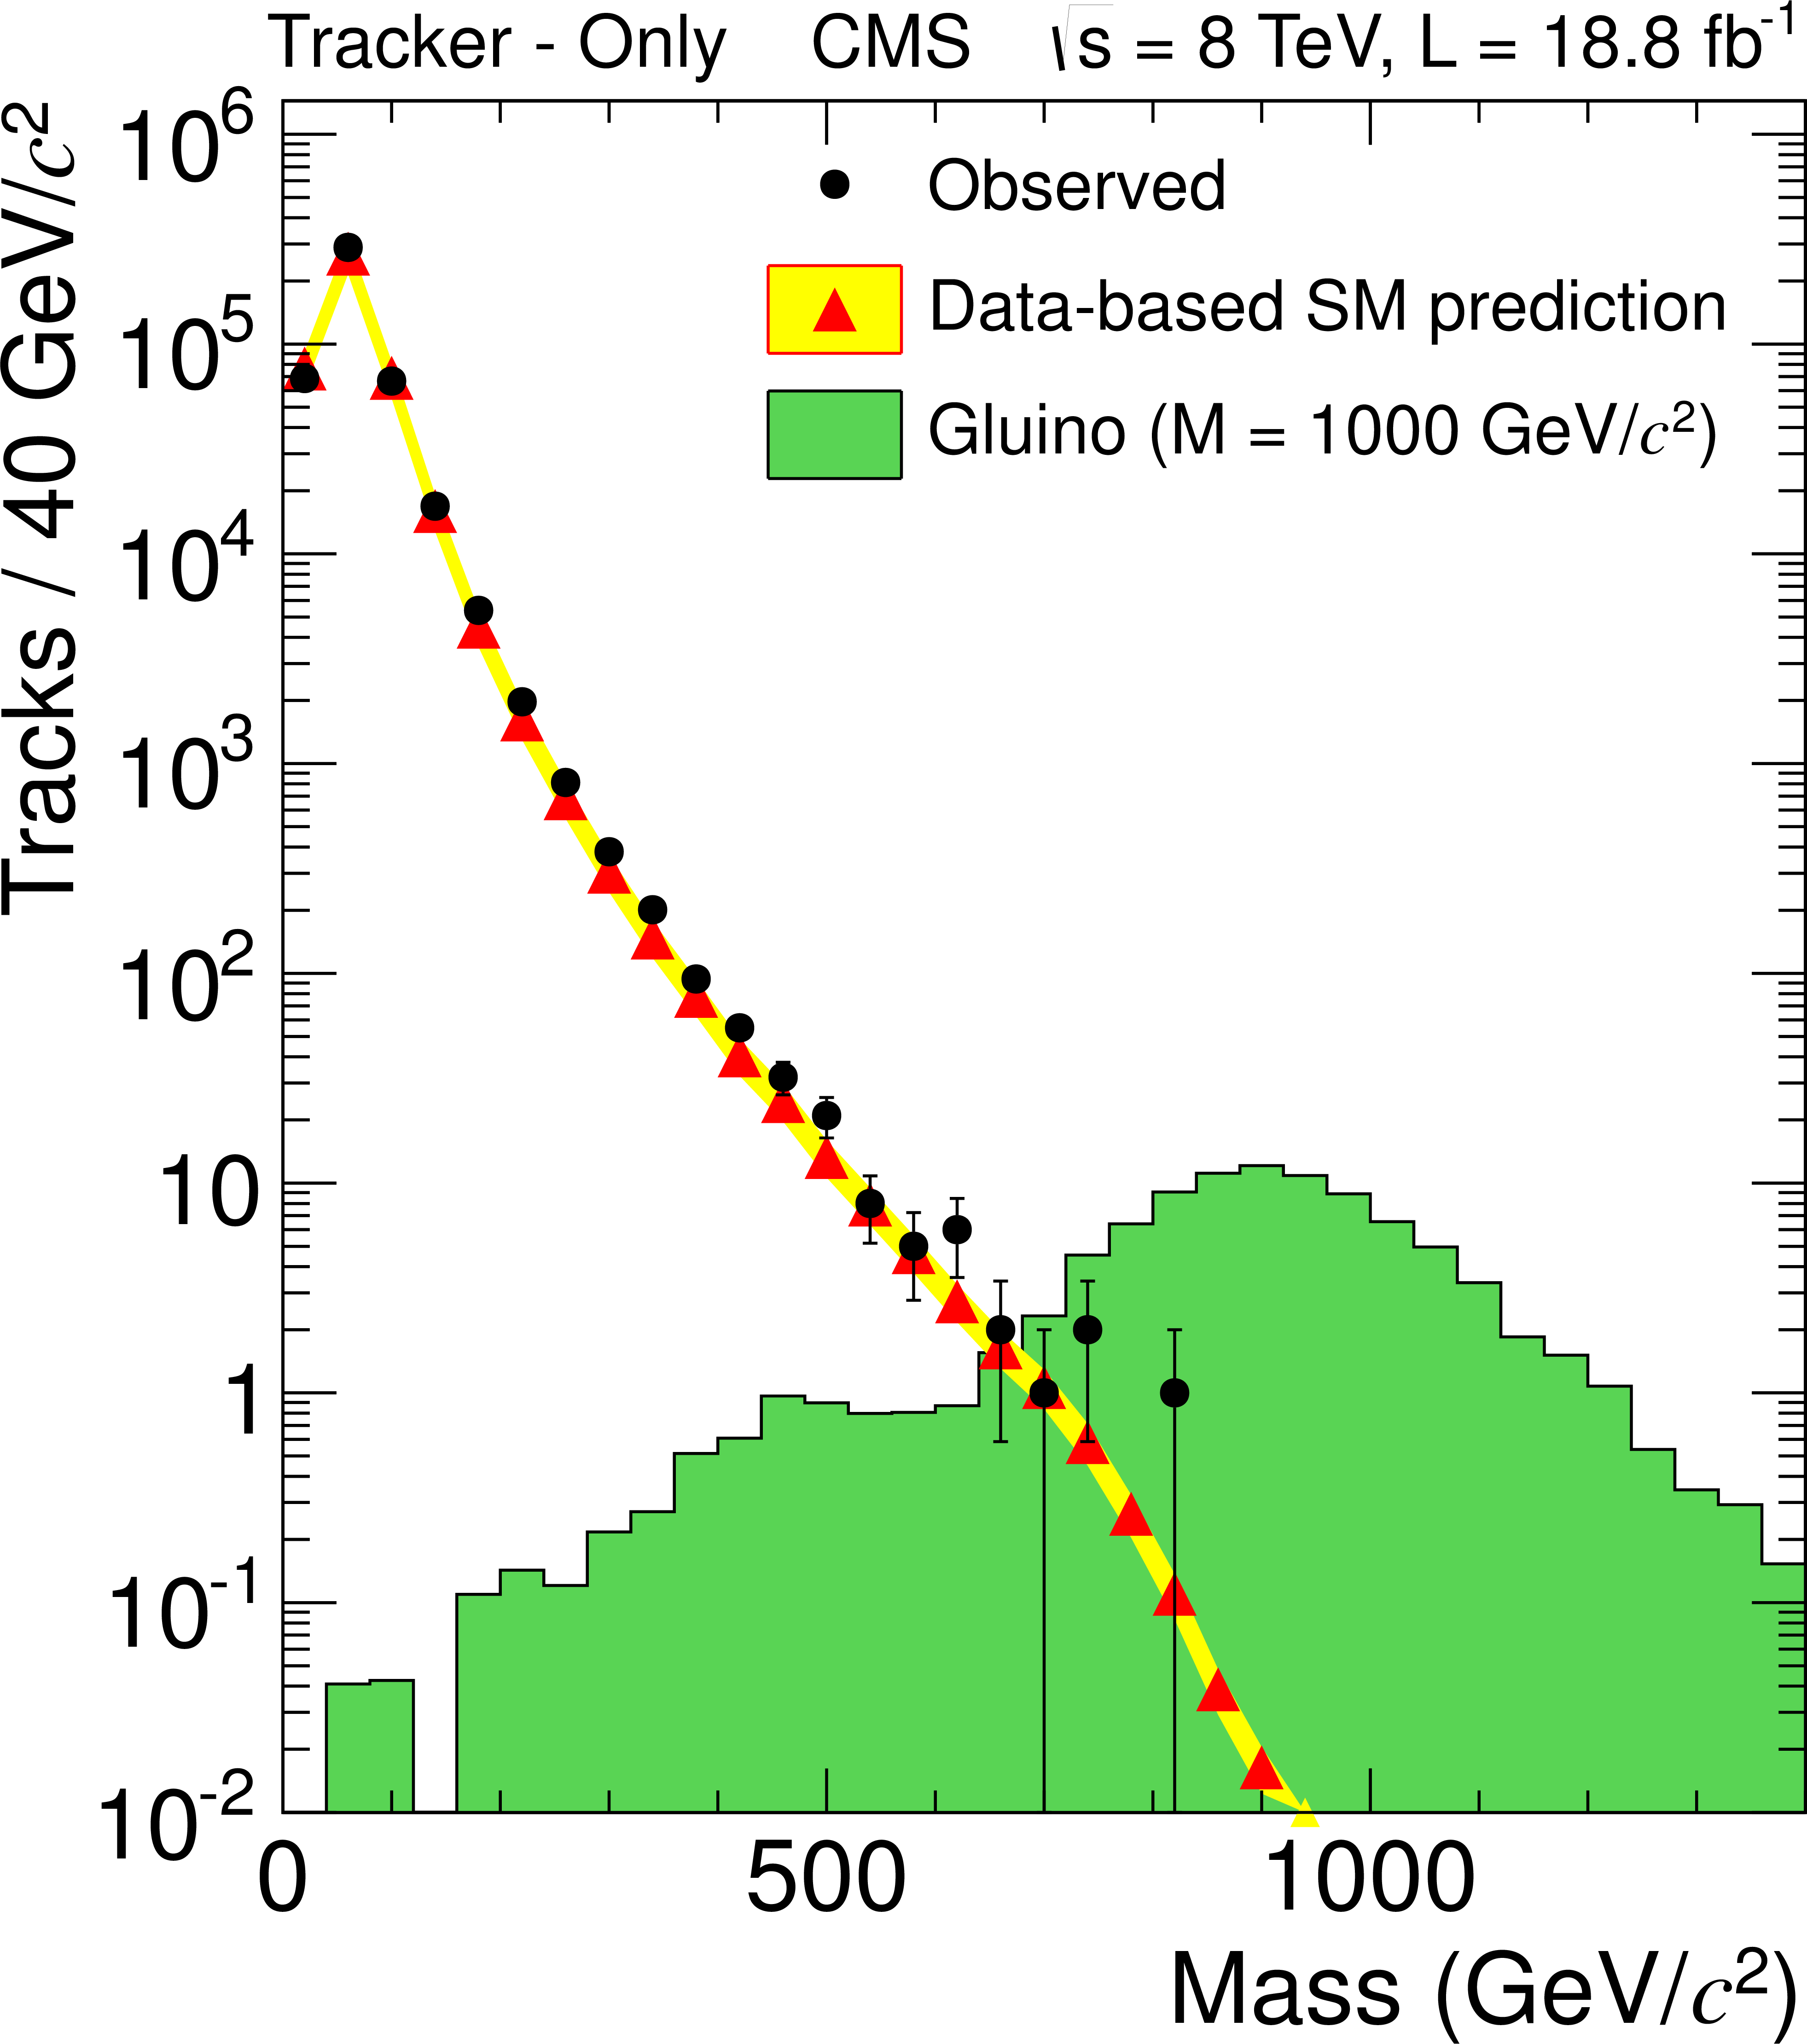
png pdf |
Figure 3-c:
Observed and predicted mass spectra for candidates entering the tracker-only (a,c) or tracker+TOF (b,d) signal region for the loose selection. The expected distribution for a representative signal scaled to the integrated luminosity is shown as the shaded histogram. a,b (c,d) is for $\sqrt {s} =$ 7 (8) TeV. |
png pdf |
Figure 3-d:
Observed and predicted mass spectra for candidates entering the tracker-only (a,c) or tracker+TOF (b,d) signal region for the loose selection. The expected distribution for a representative signal scaled to the integrated luminosity is shown as the shaded histogram. a,b (c,d) is for $\sqrt {s} =$ 7 (8) TeV. |
png pdf |
Figure 4-a:
Observed and predicted numbers of tracks in both the control region with $1/\beta < 1$ (a) and the signal region (b) as functions of the $ {1/\beta } $ threshold and for two different $ {p_{\mathrm {T}}}$ thresholds for the muon-only analysis at $\sqrt {s} =$ 8 TeV. Only statistical uncertainties are shown. |

png pdf |
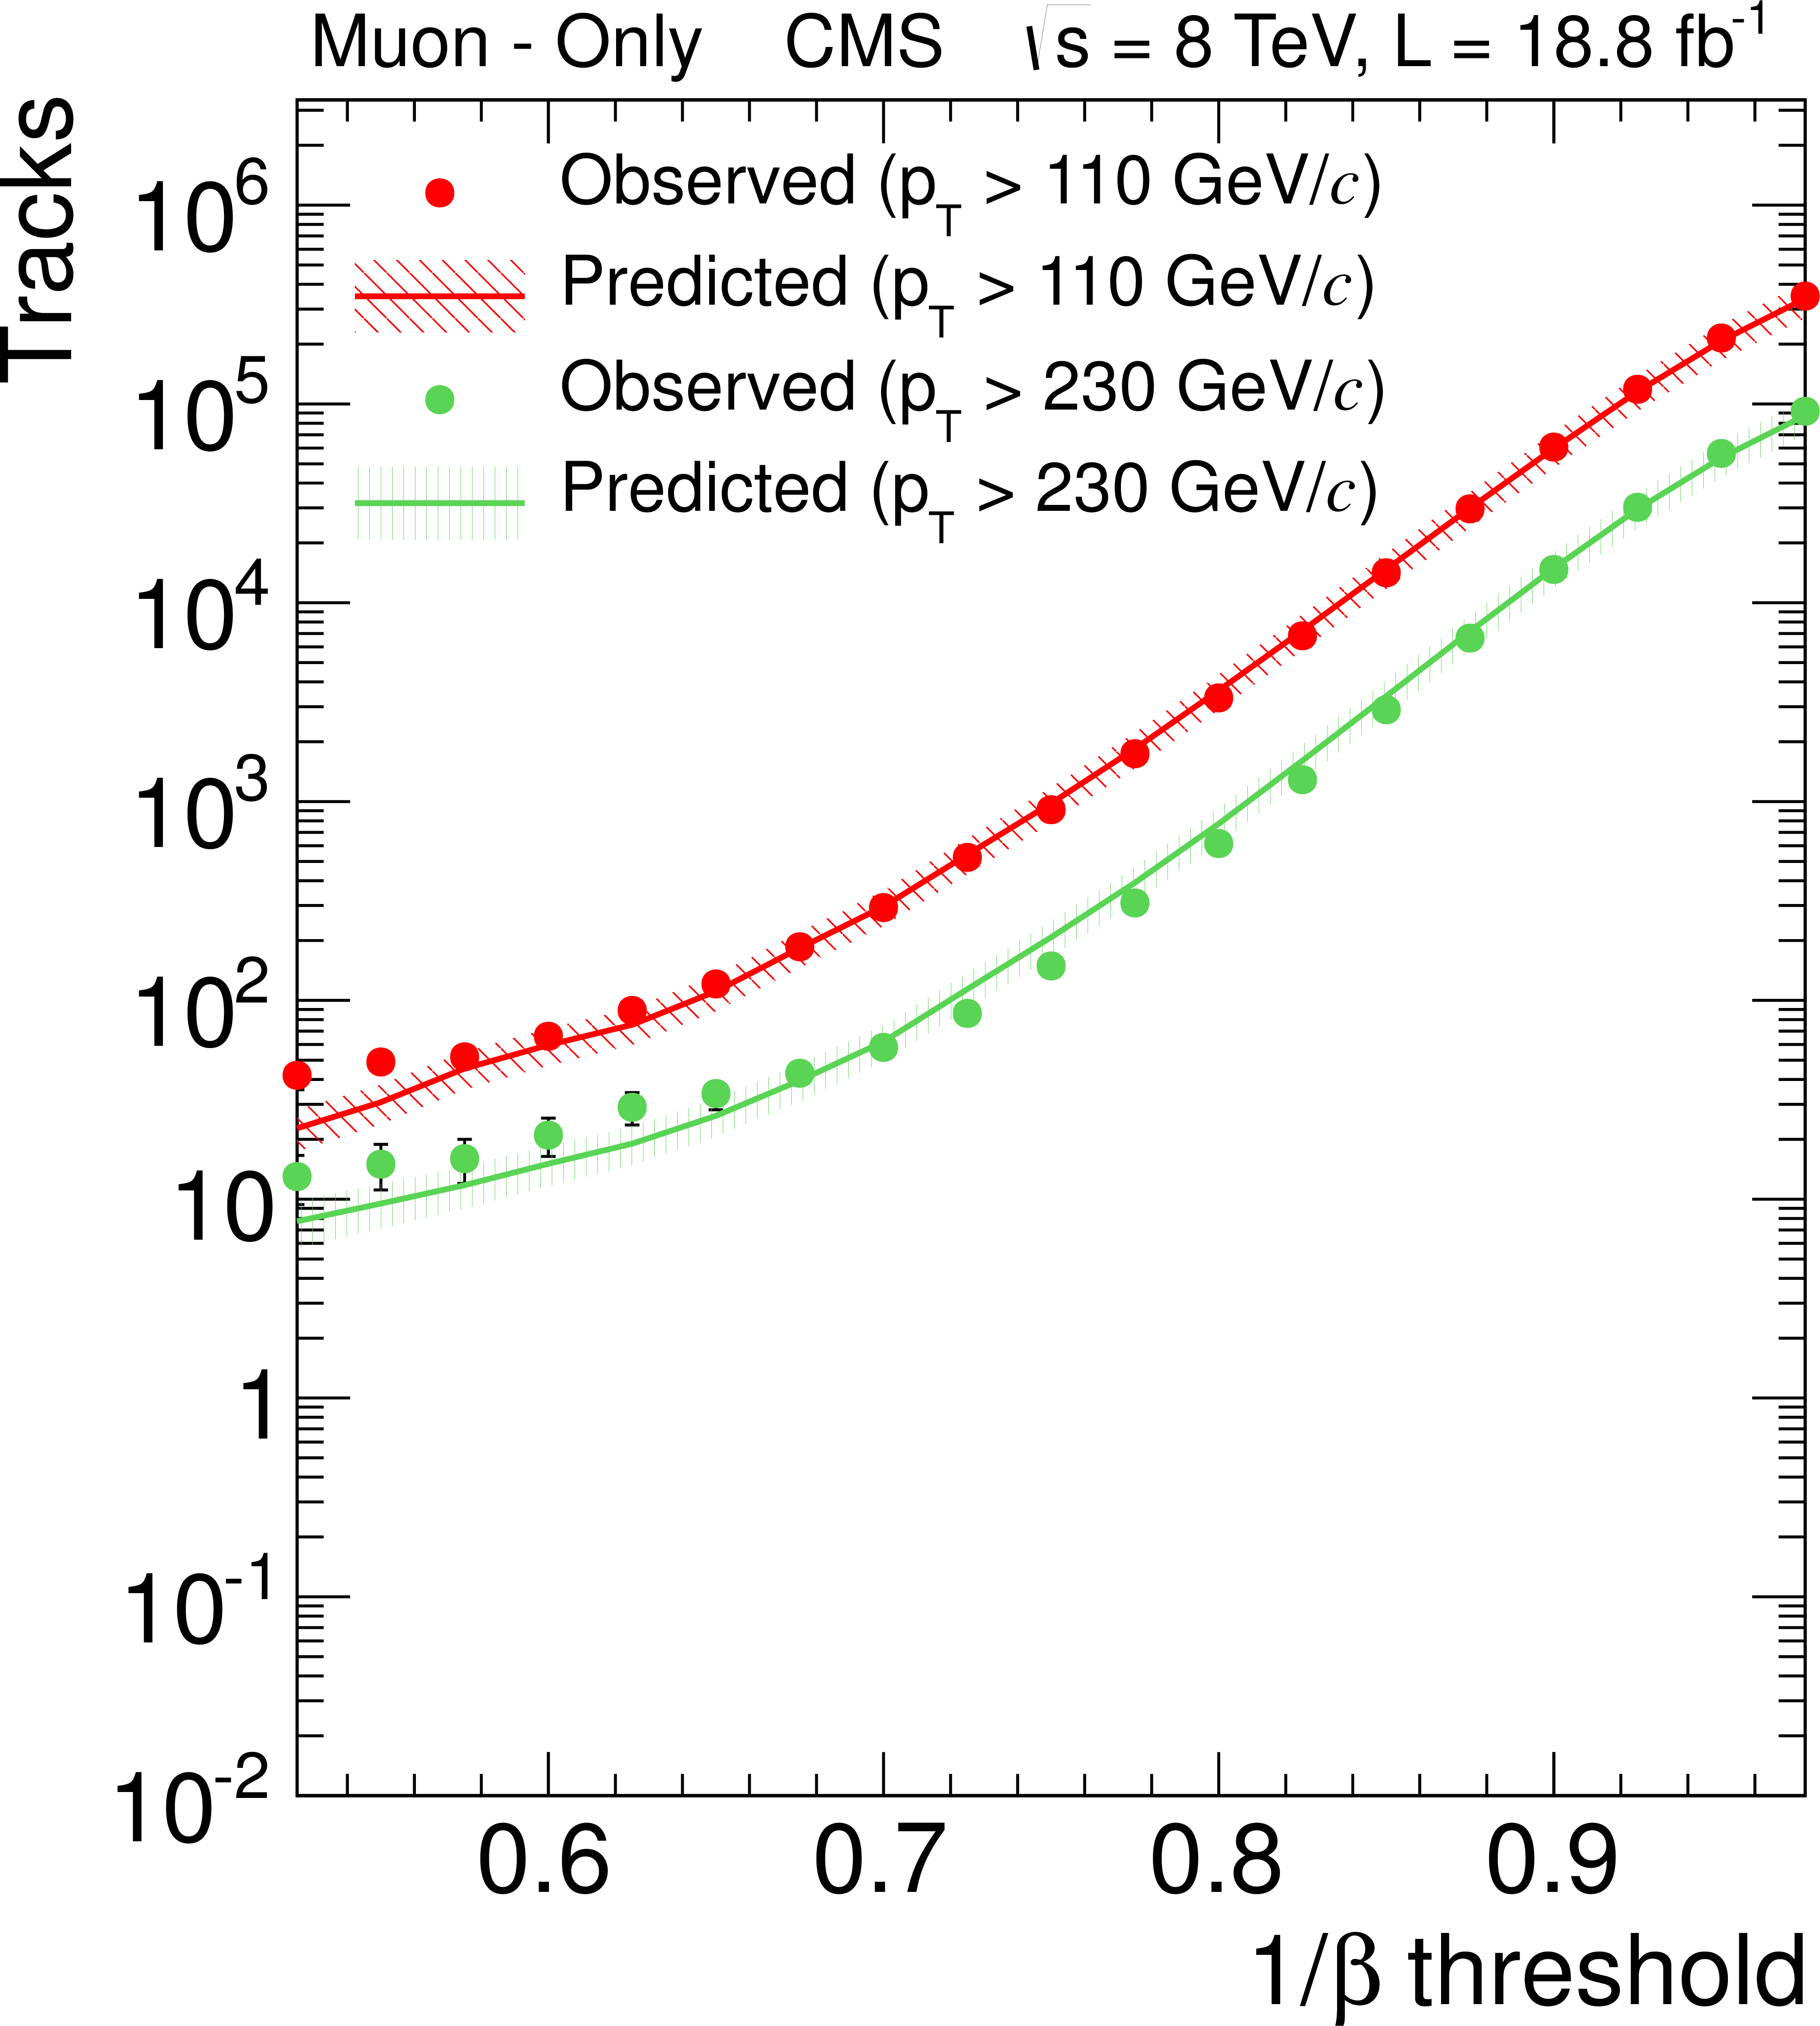
Figure 4-b:
Observed and predicted numbers of tracks in both the control region with $1/\beta < 1$ (a) and the signal region (b) as functions of the $ {1/\beta } $ threshold and for two different $ {p_{\mathrm {T}}}$ thresholds for the muon-only analysis at $\sqrt {s} =$ 8 TeV. Only statistical uncertainties are shown. |
png pdf |
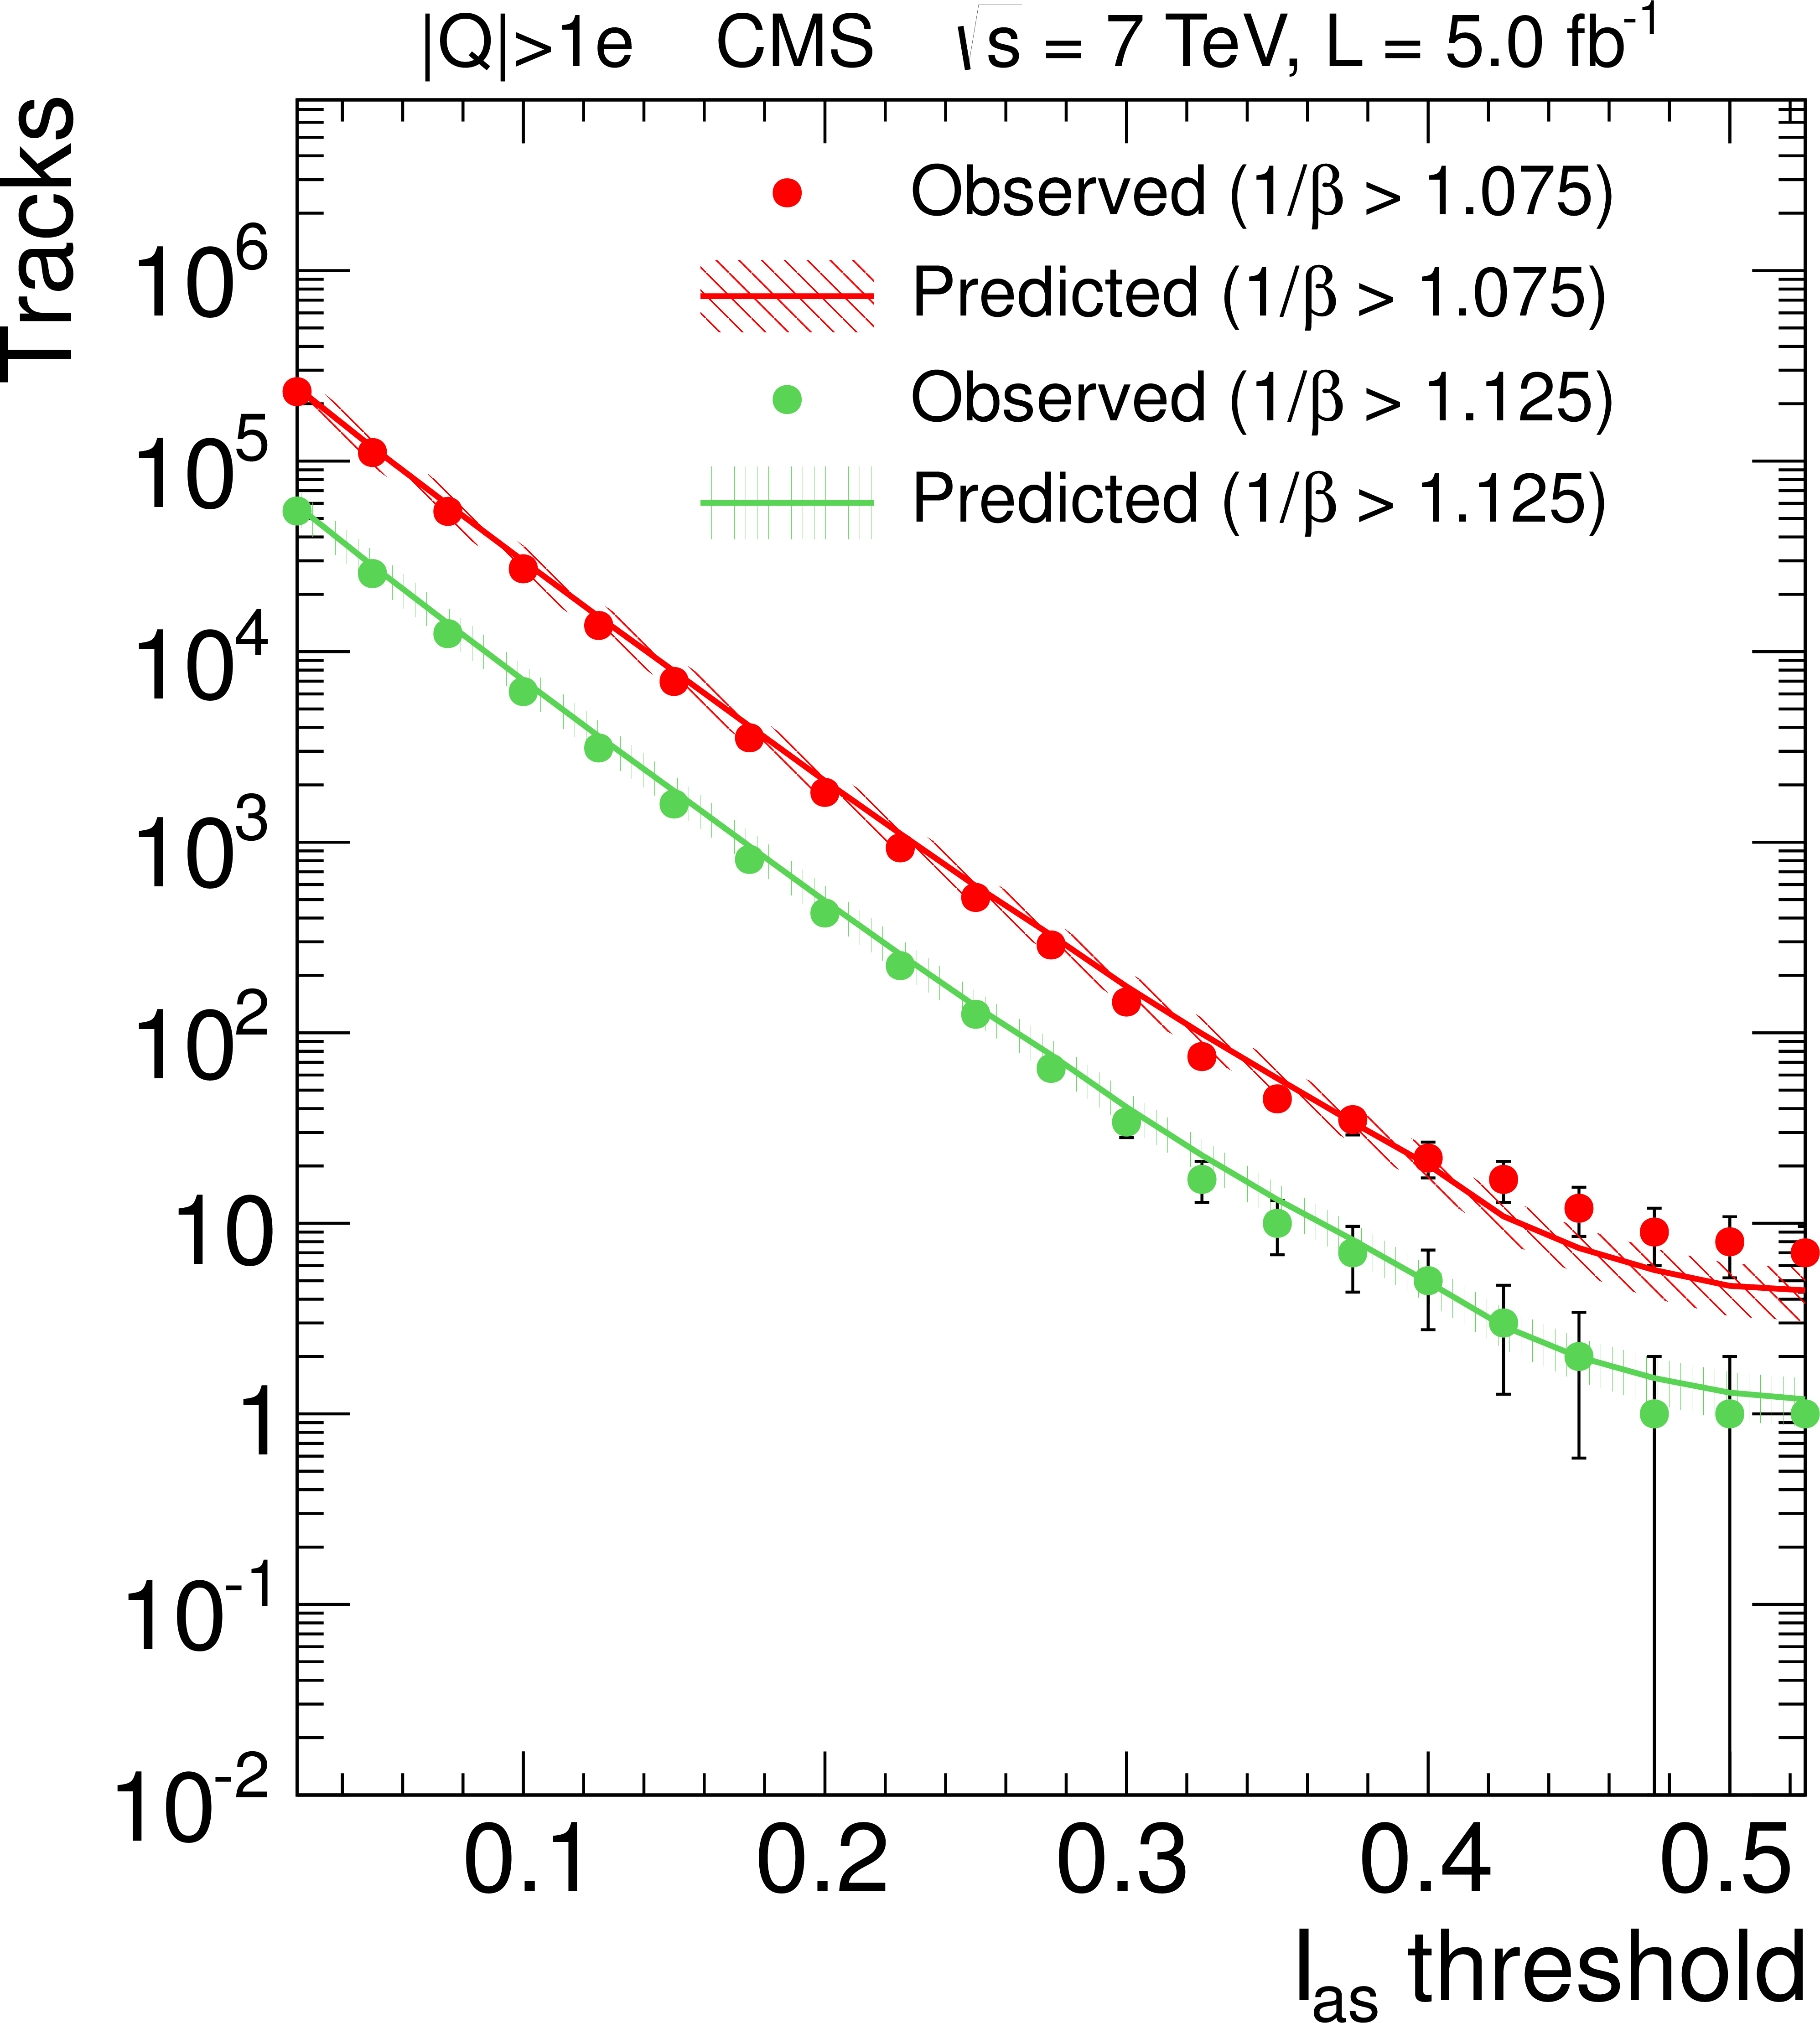
Figure 5-a:
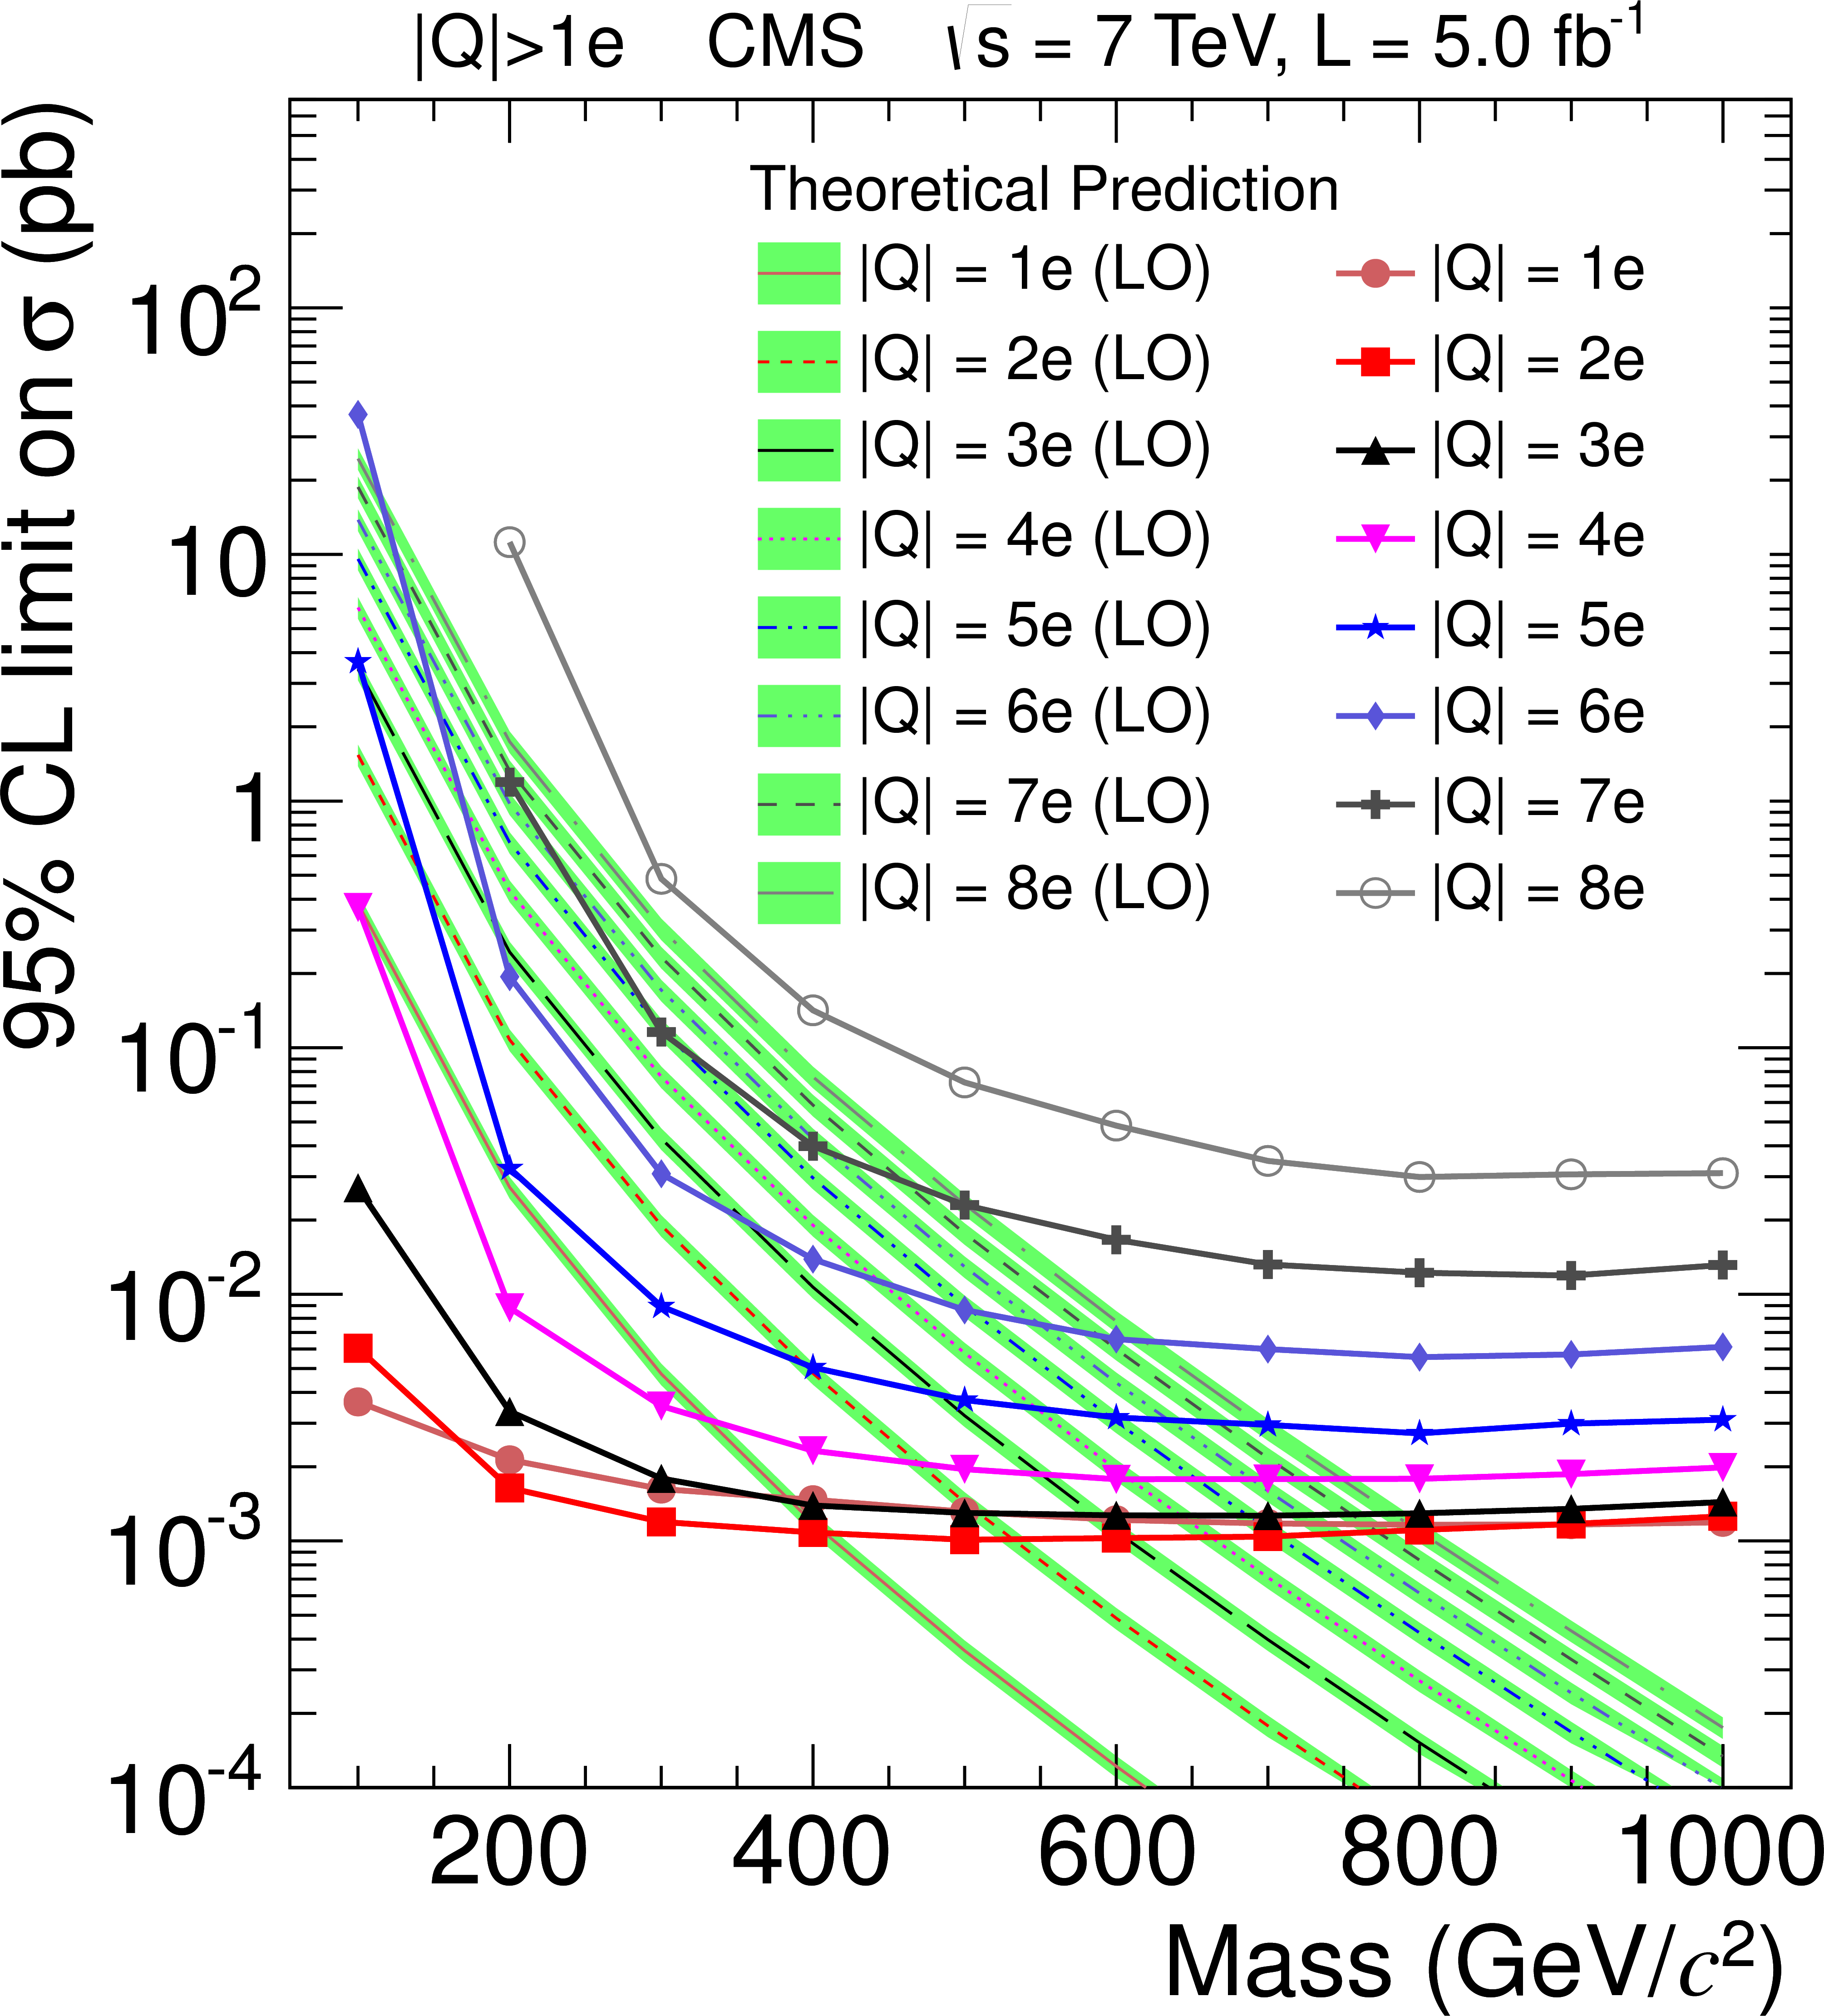
Observed and predicted numbers of tracks as a function of the $ {I_{as}}$ threshold for two different ${1/\beta } $ thresholds at $\sqrt {s} =$ 7 TeV (a) and 8 TeV (b) for the multiply charged analysis. Only statistical uncertainties are shown. |
png pdf |
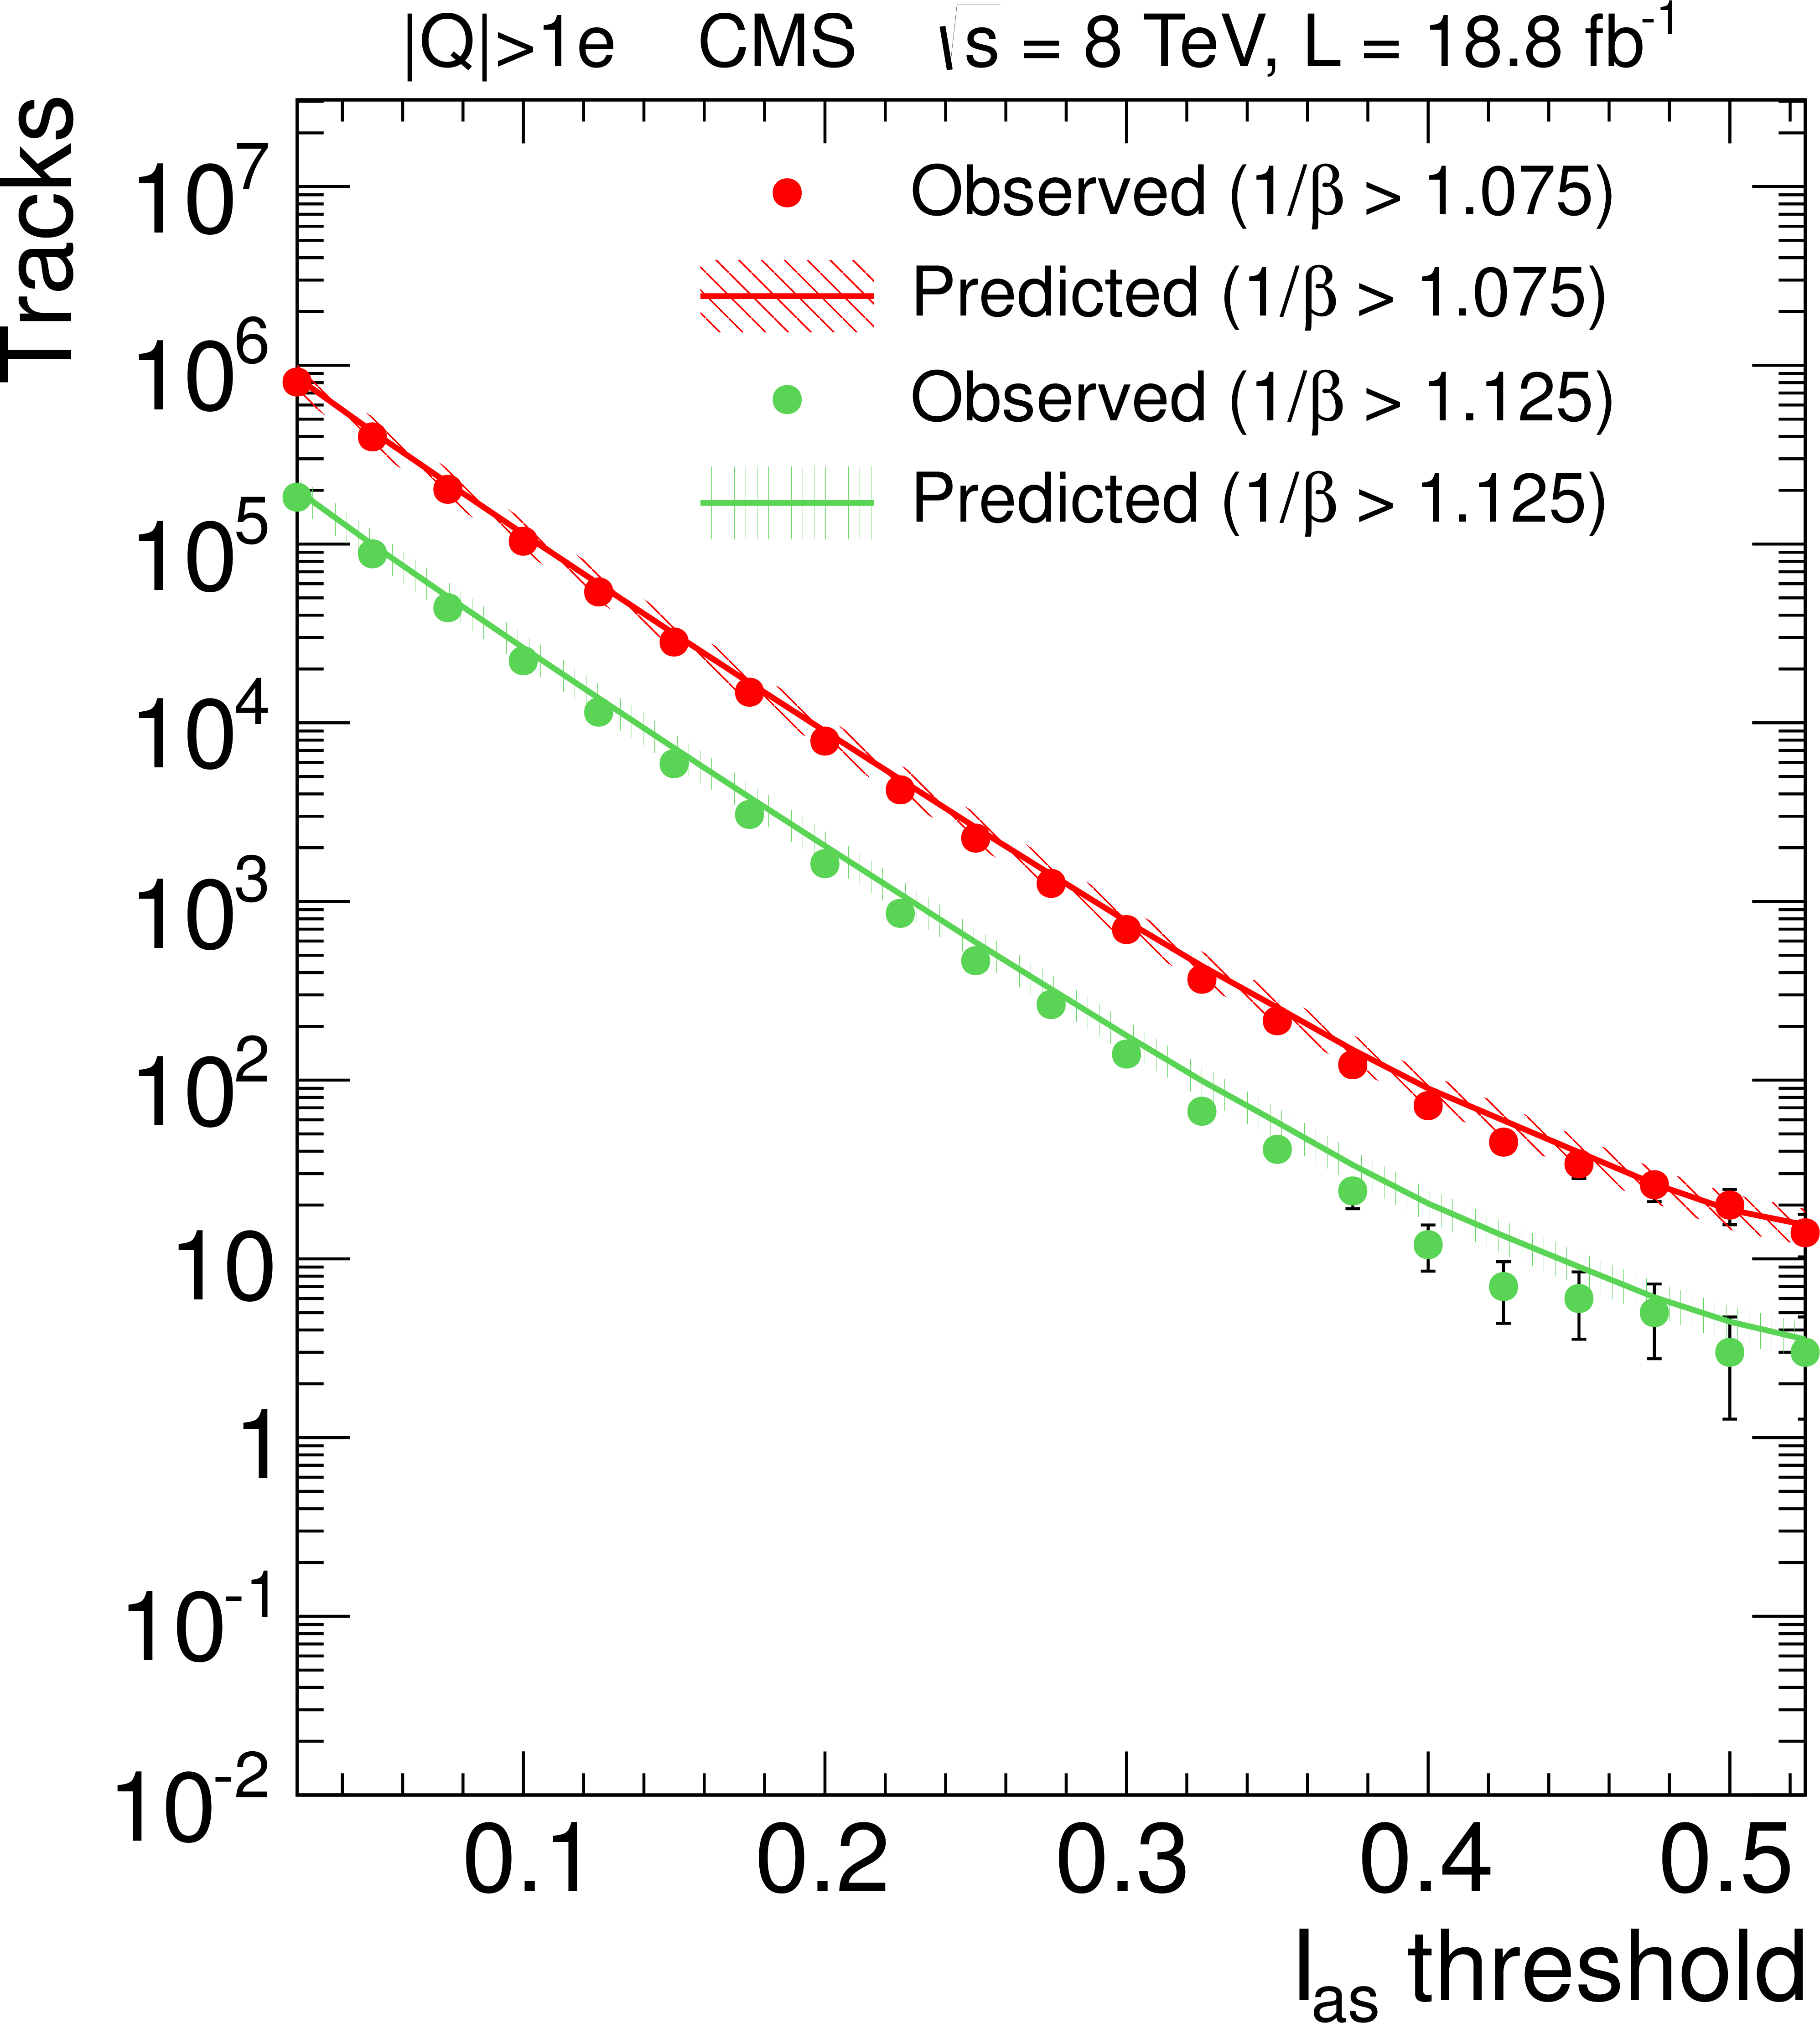
Figure 5-b:
Observed and predicted numbers of tracks as a function of the $ {I_{as}}$ threshold for two different ${1/\beta } $ thresholds at $\sqrt {s} =$ 7 TeV (a) and 8 TeV (b) for the multiply charged analysis. Only statistical uncertainties are shown. |
png pdf |
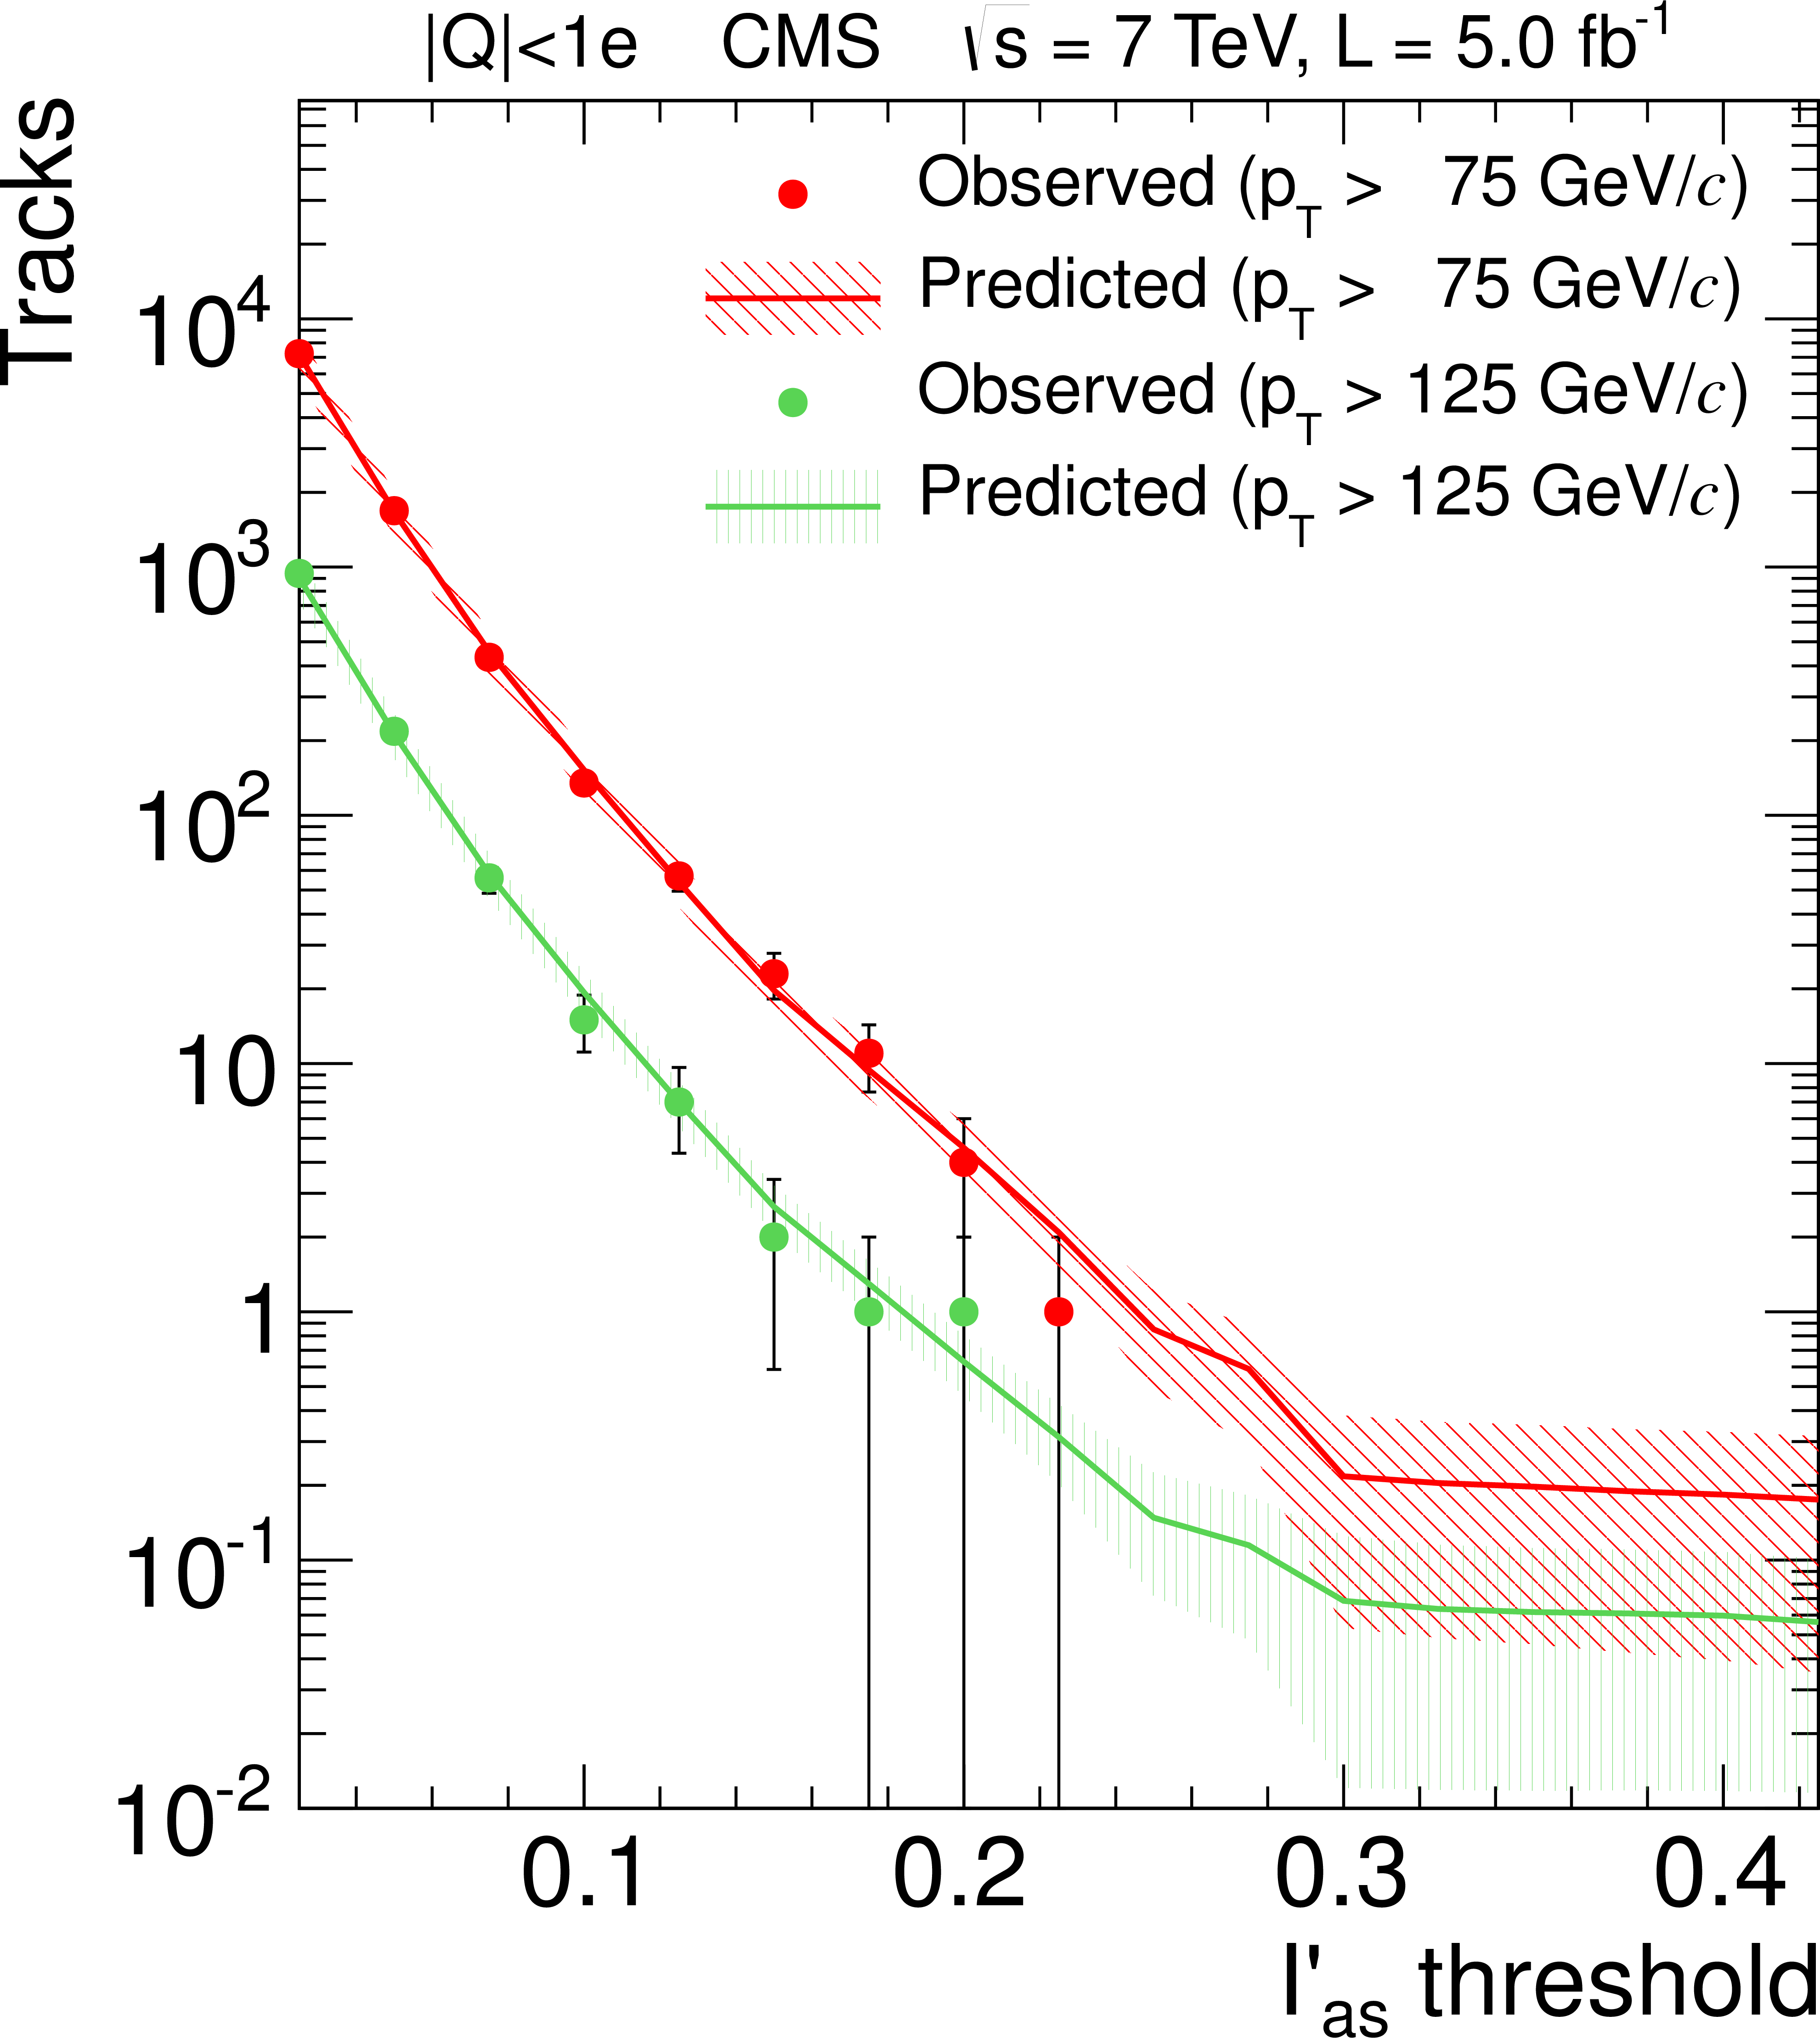
Figure 6-a:
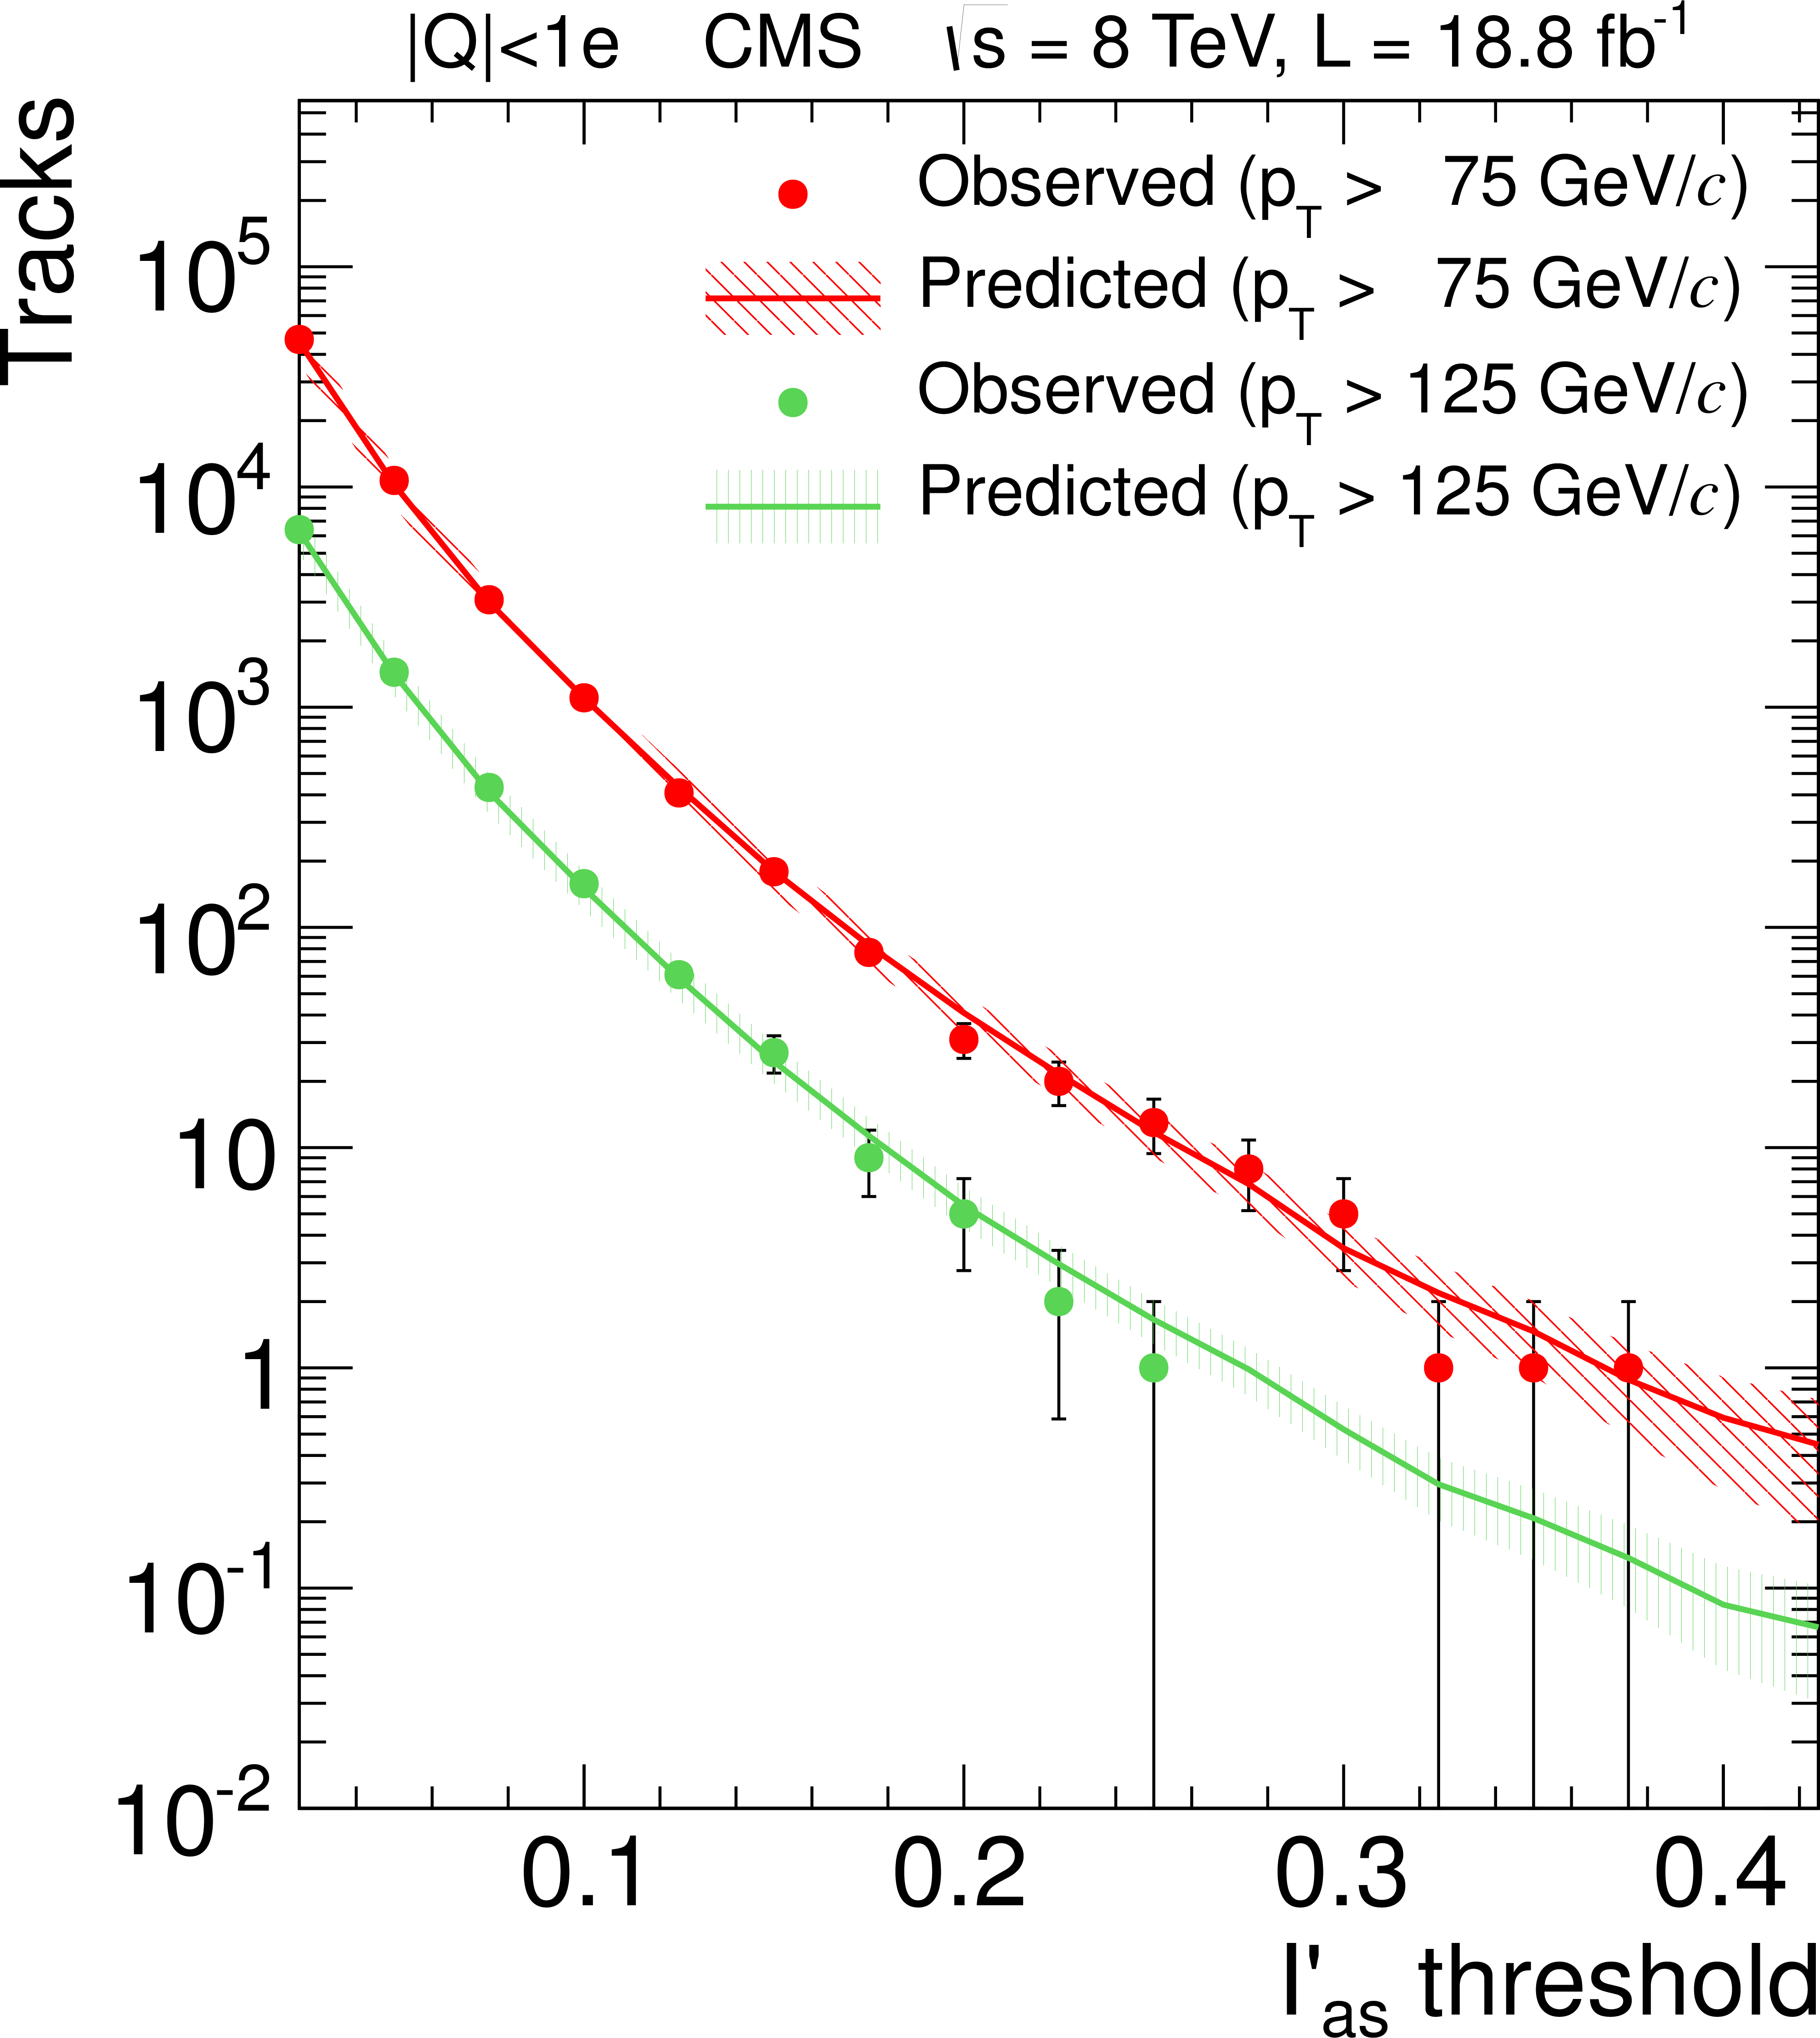
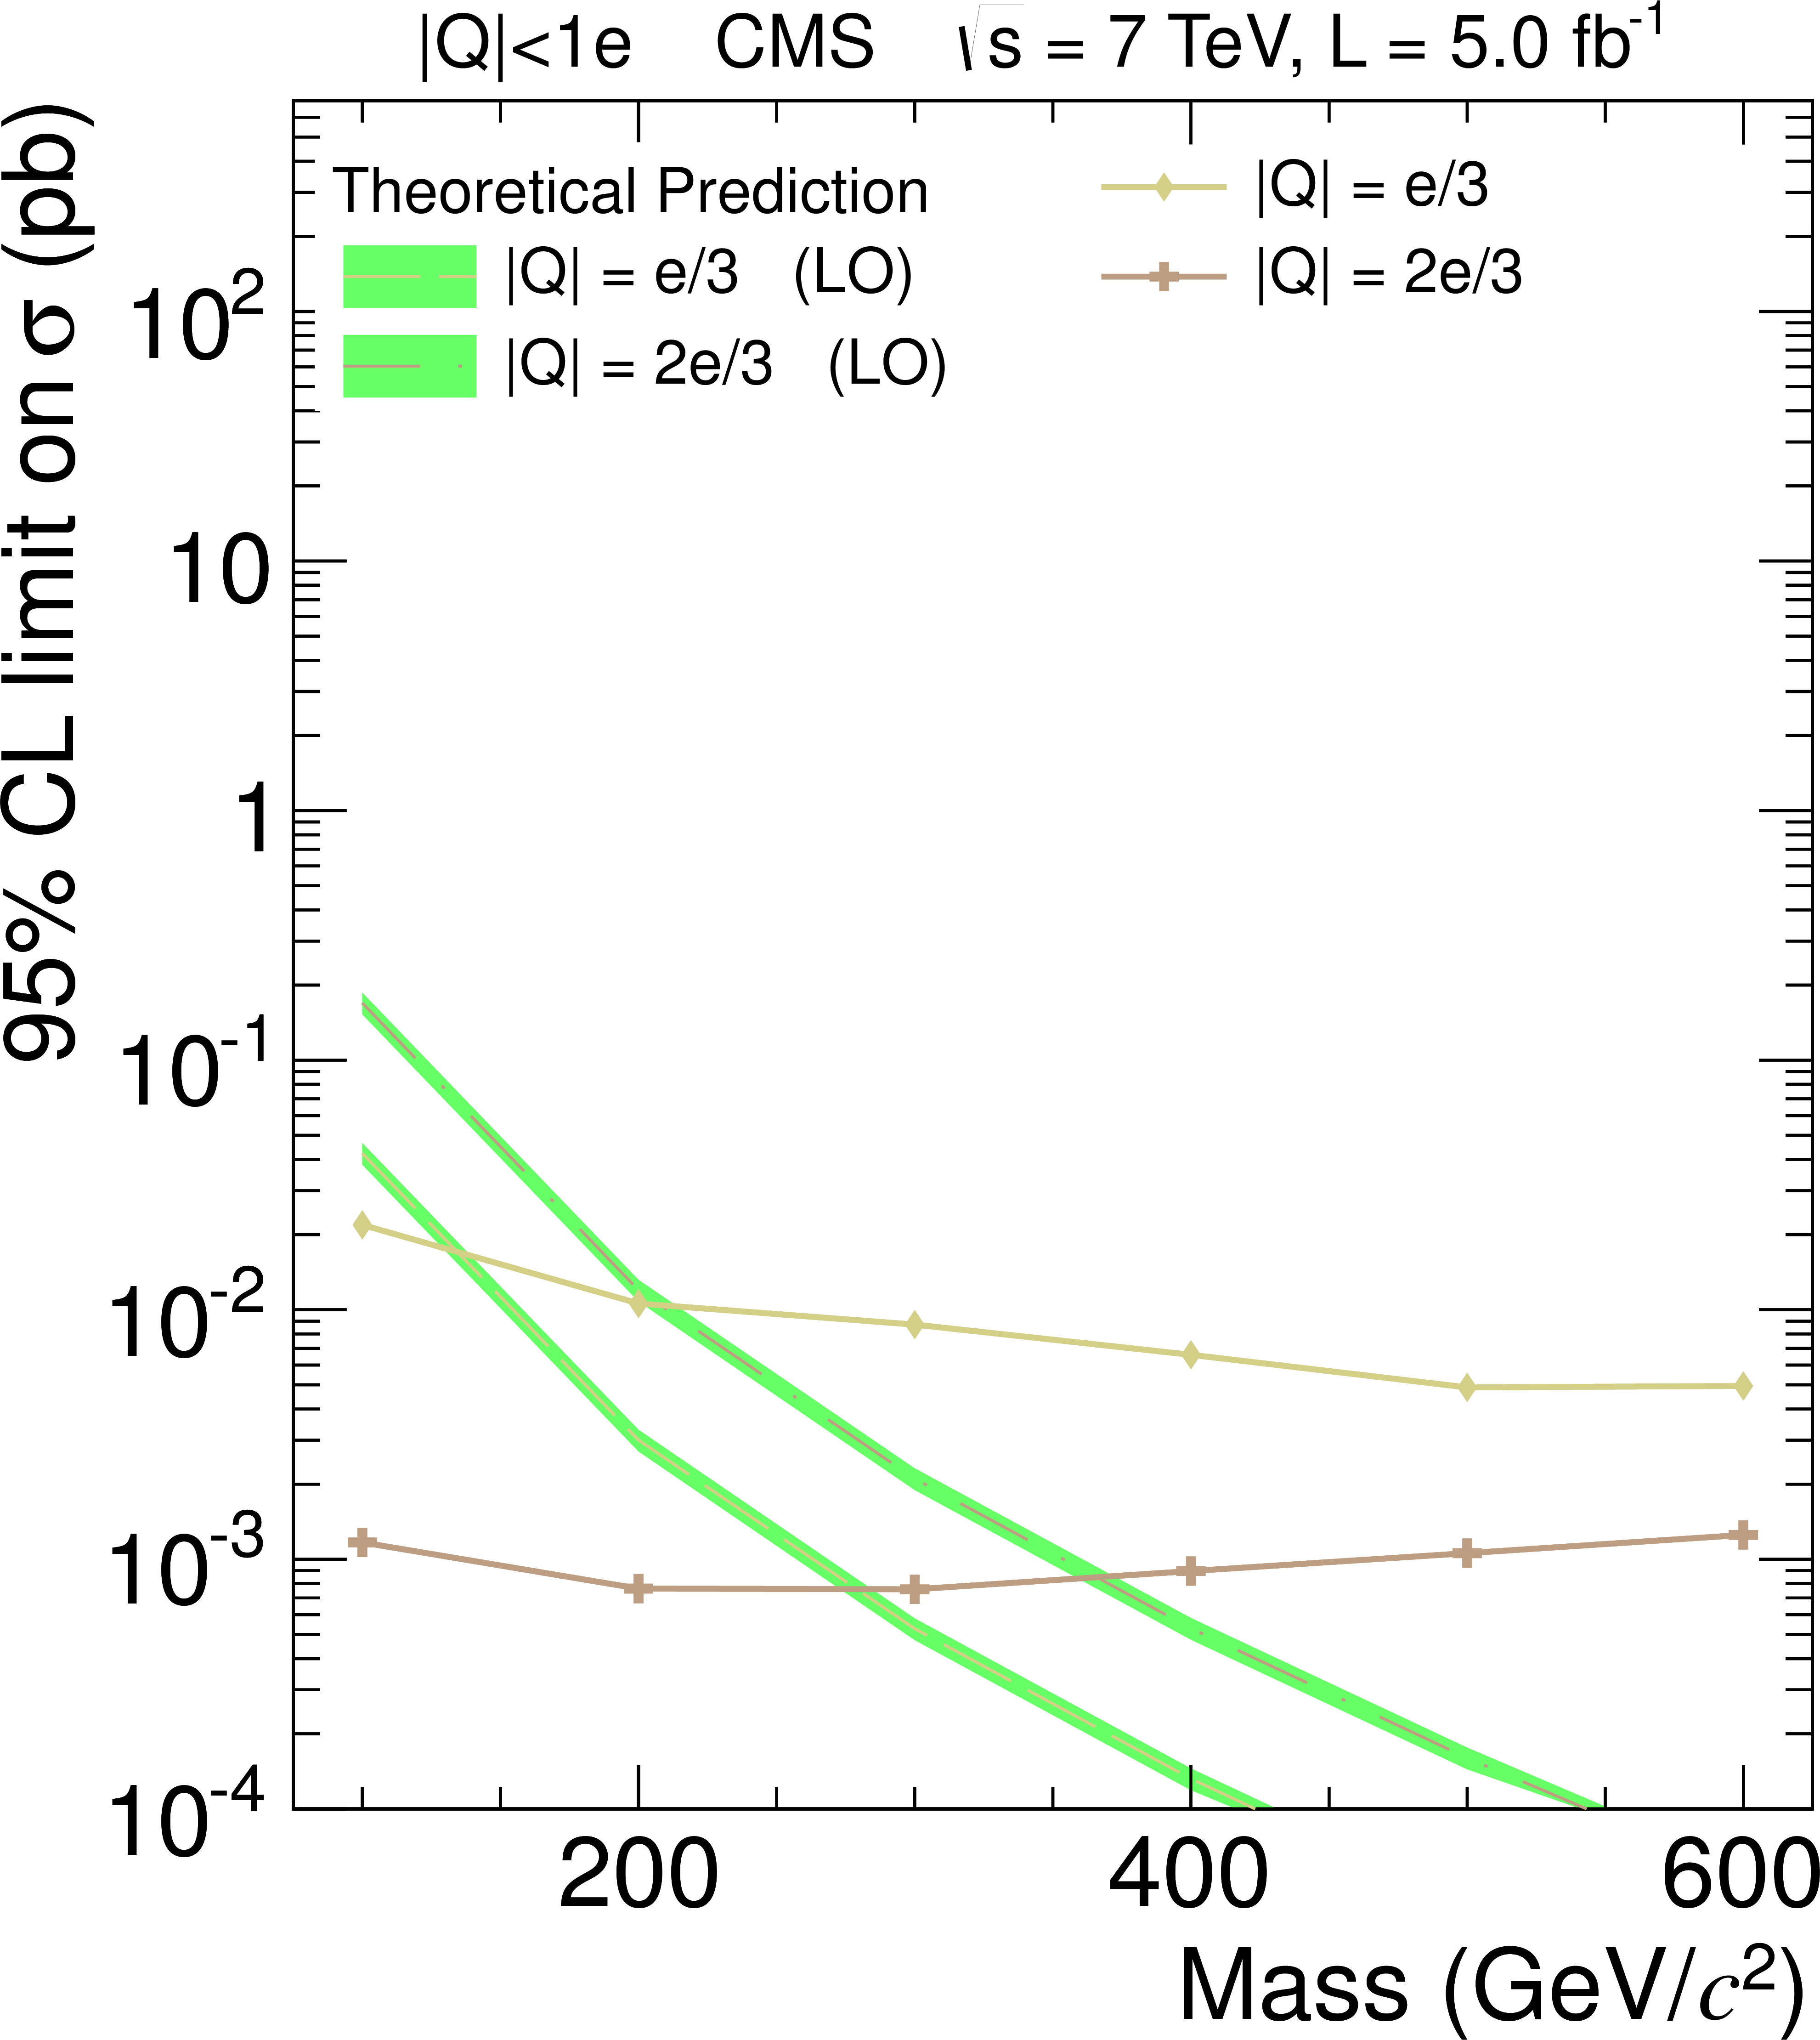
Observed and predicted numbers of tracks as a function of the $ {I_{as}^\prime }$ threshold for two different $ {p_{\mathrm {T}}} $ thresholds at $\sqrt {s} =$ 7 TeV (a) and 8 TeV (b) for the fractionally charged analysis. Only statistical uncertainties are shown. |
png pdf |
Figure 6-b:
Observed and predicted numbers of tracks as a function of the $ {I_{as}^\prime }$ threshold for two different $ {p_{\mathrm {T}}} $ thresholds at $\sqrt {s} =$ 7 TeV (a) and 8 TeV (b) for the fractionally charged analysis. Only statistical uncertainties are shown. |
png pdf |
Figure 7-a:
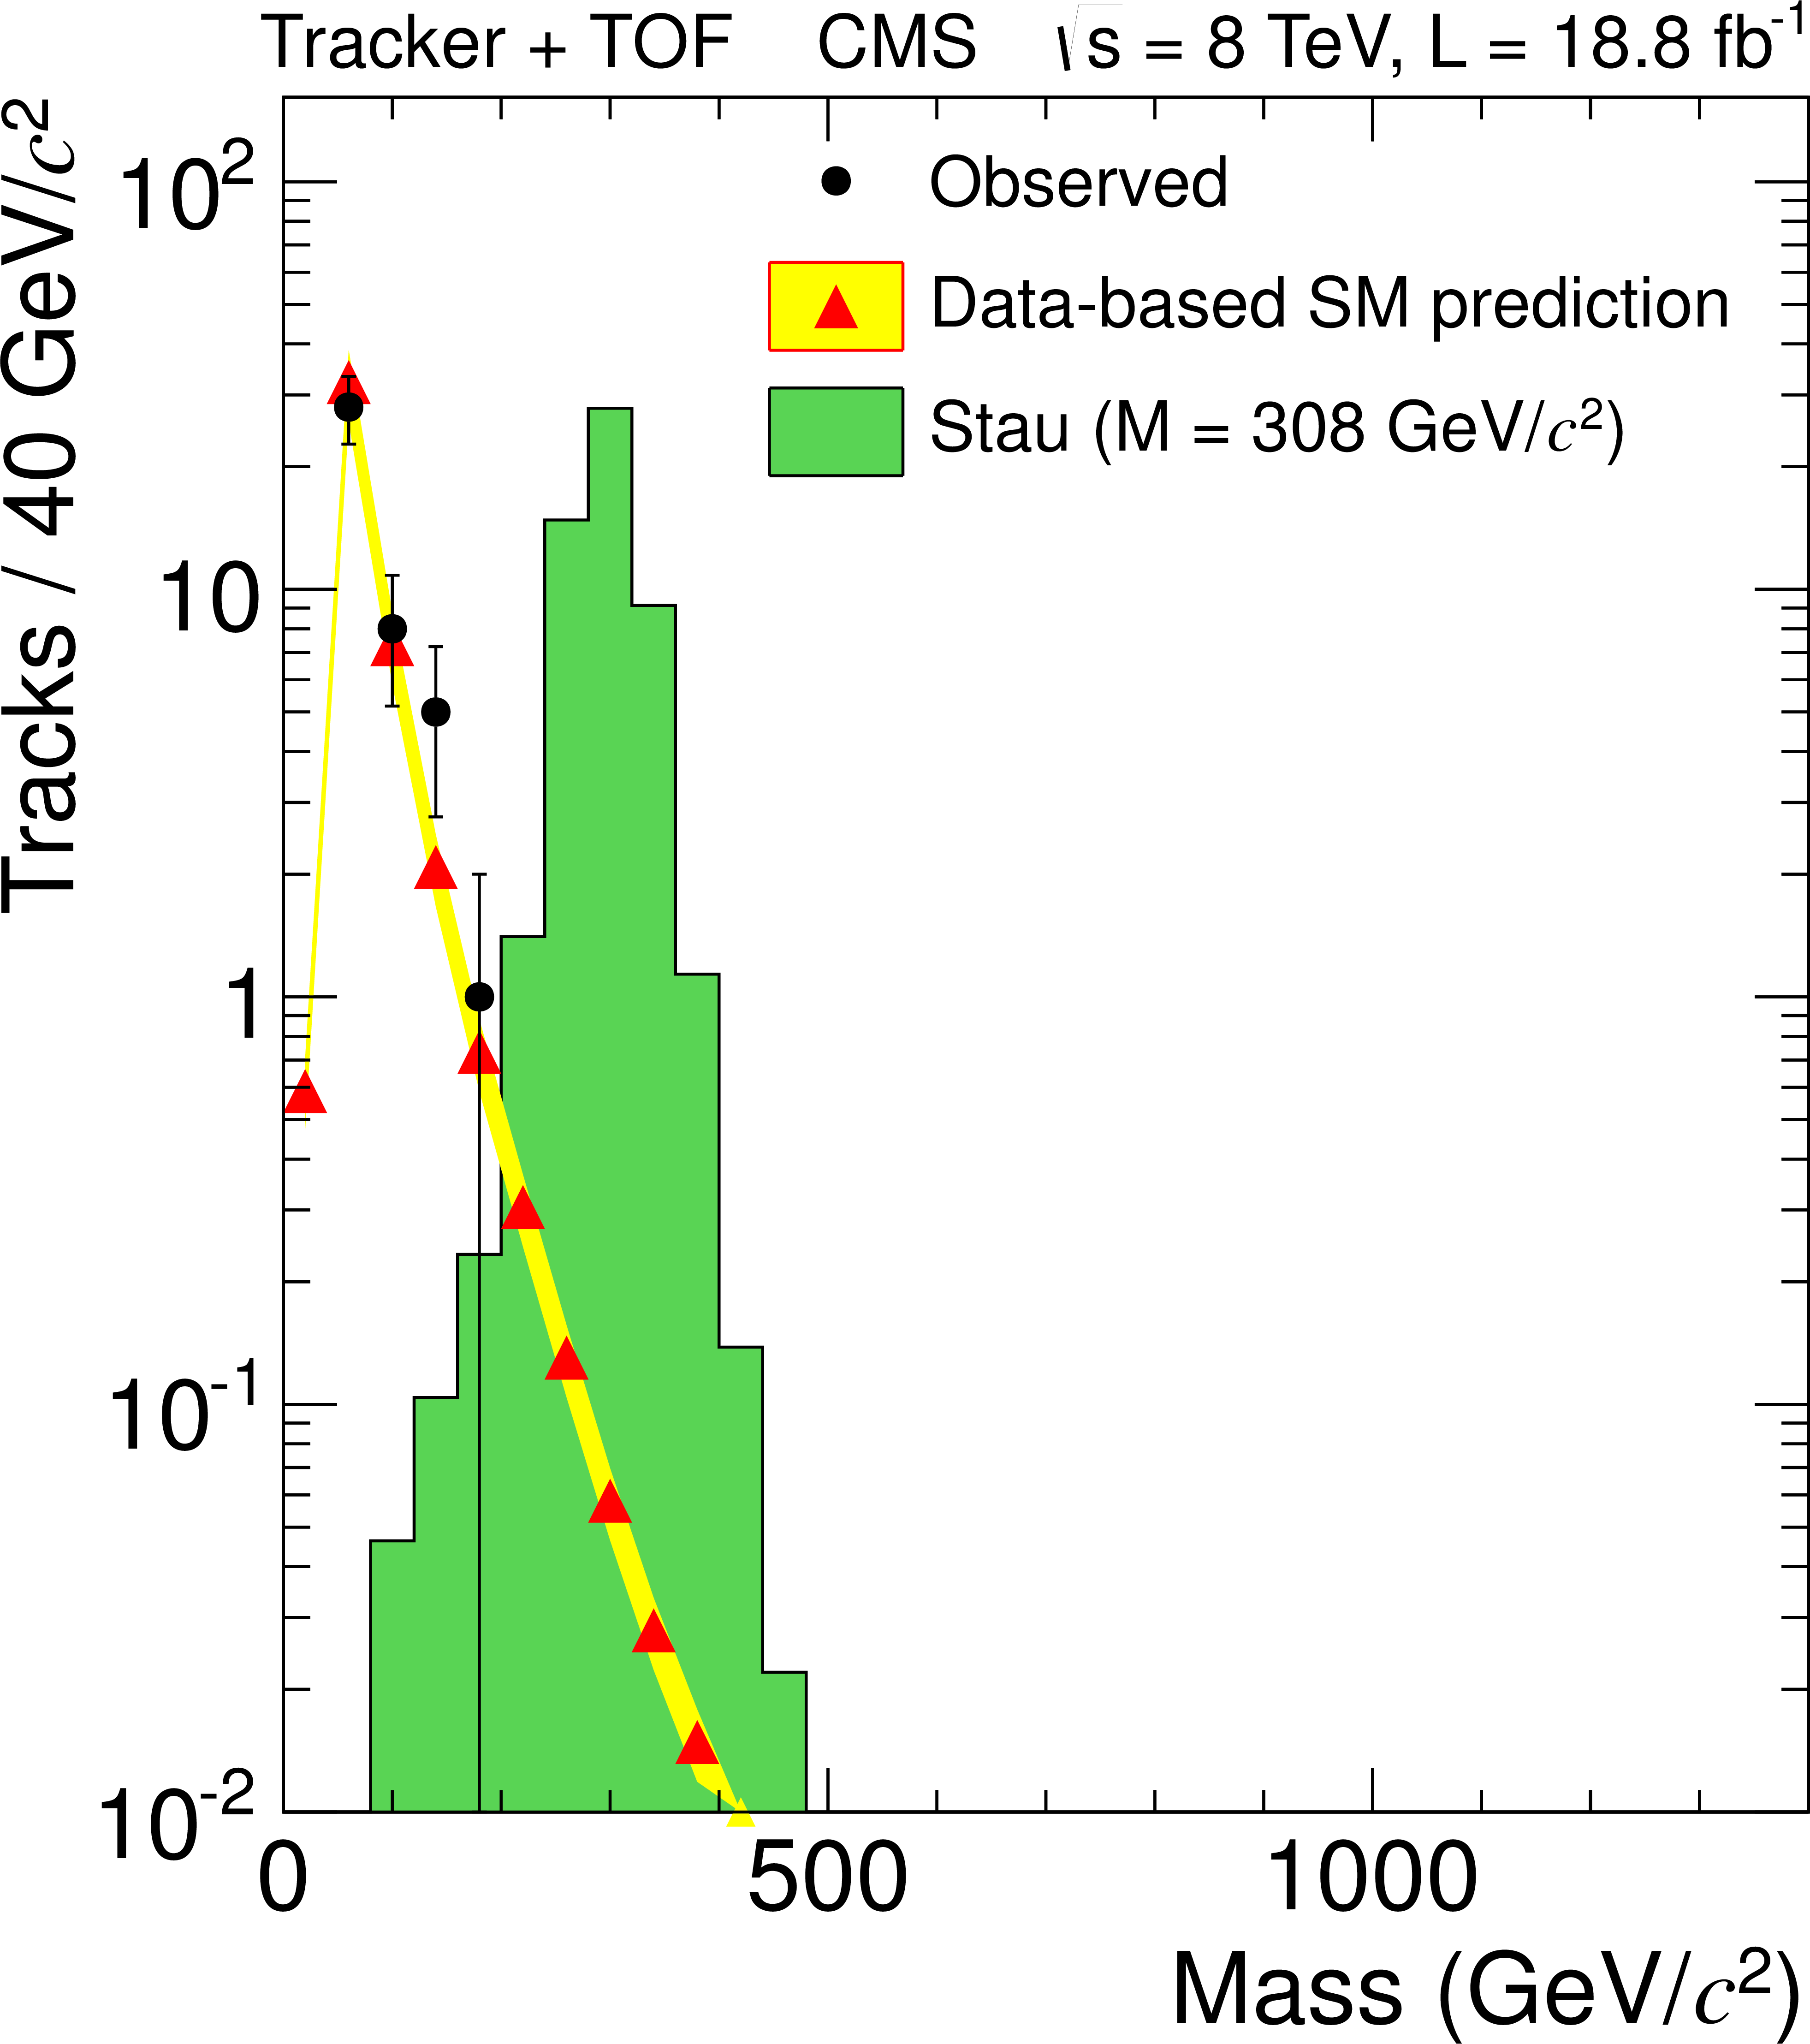
Observed and predicted mass spectra for candidates entering the tracker-only (a,c) or tracker+TOF (b,d) signal region for the tight selection. The expected distribution for a representative signal scaled to the integrated luminosity is shown as the shaded histogram. a,b (c,d) is for $\sqrt {s} =$ 7 (8) TeV. |
png pdf |
Figure 7-b:
Observed and predicted mass spectra for candidates entering the tracker-only (a,c) or tracker+TOF (b,d) signal region for the tight selection. The expected distribution for a representative signal scaled to the integrated luminosity is shown as the shaded histogram. a,b (c,d) is for $\sqrt {s} =$ 7 (8) TeV. |
png pdf |
Figure 7-c:
Observed and predicted mass spectra for candidates entering the tracker-only (a,c) or tracker+TOF (b,d) signal region for the tight selection. The expected distribution for a representative signal scaled to the integrated luminosity is shown as the shaded histogram. a,b (c,d) is for $\sqrt {s} =$ 7 (8) TeV. |
png pdf |
Figure 7-d:
Observed and predicted mass spectra for candidates entering the tracker-only (a,c) or tracker+TOF (b,d) signal region for the tight selection. The expected distribution for a representative signal scaled to the integrated luminosity is shown as the shaded histogram. a,b (c,d) is for $\sqrt {s} =$ 7 (8) TeV. |
png pdf |
Figure 8-a:
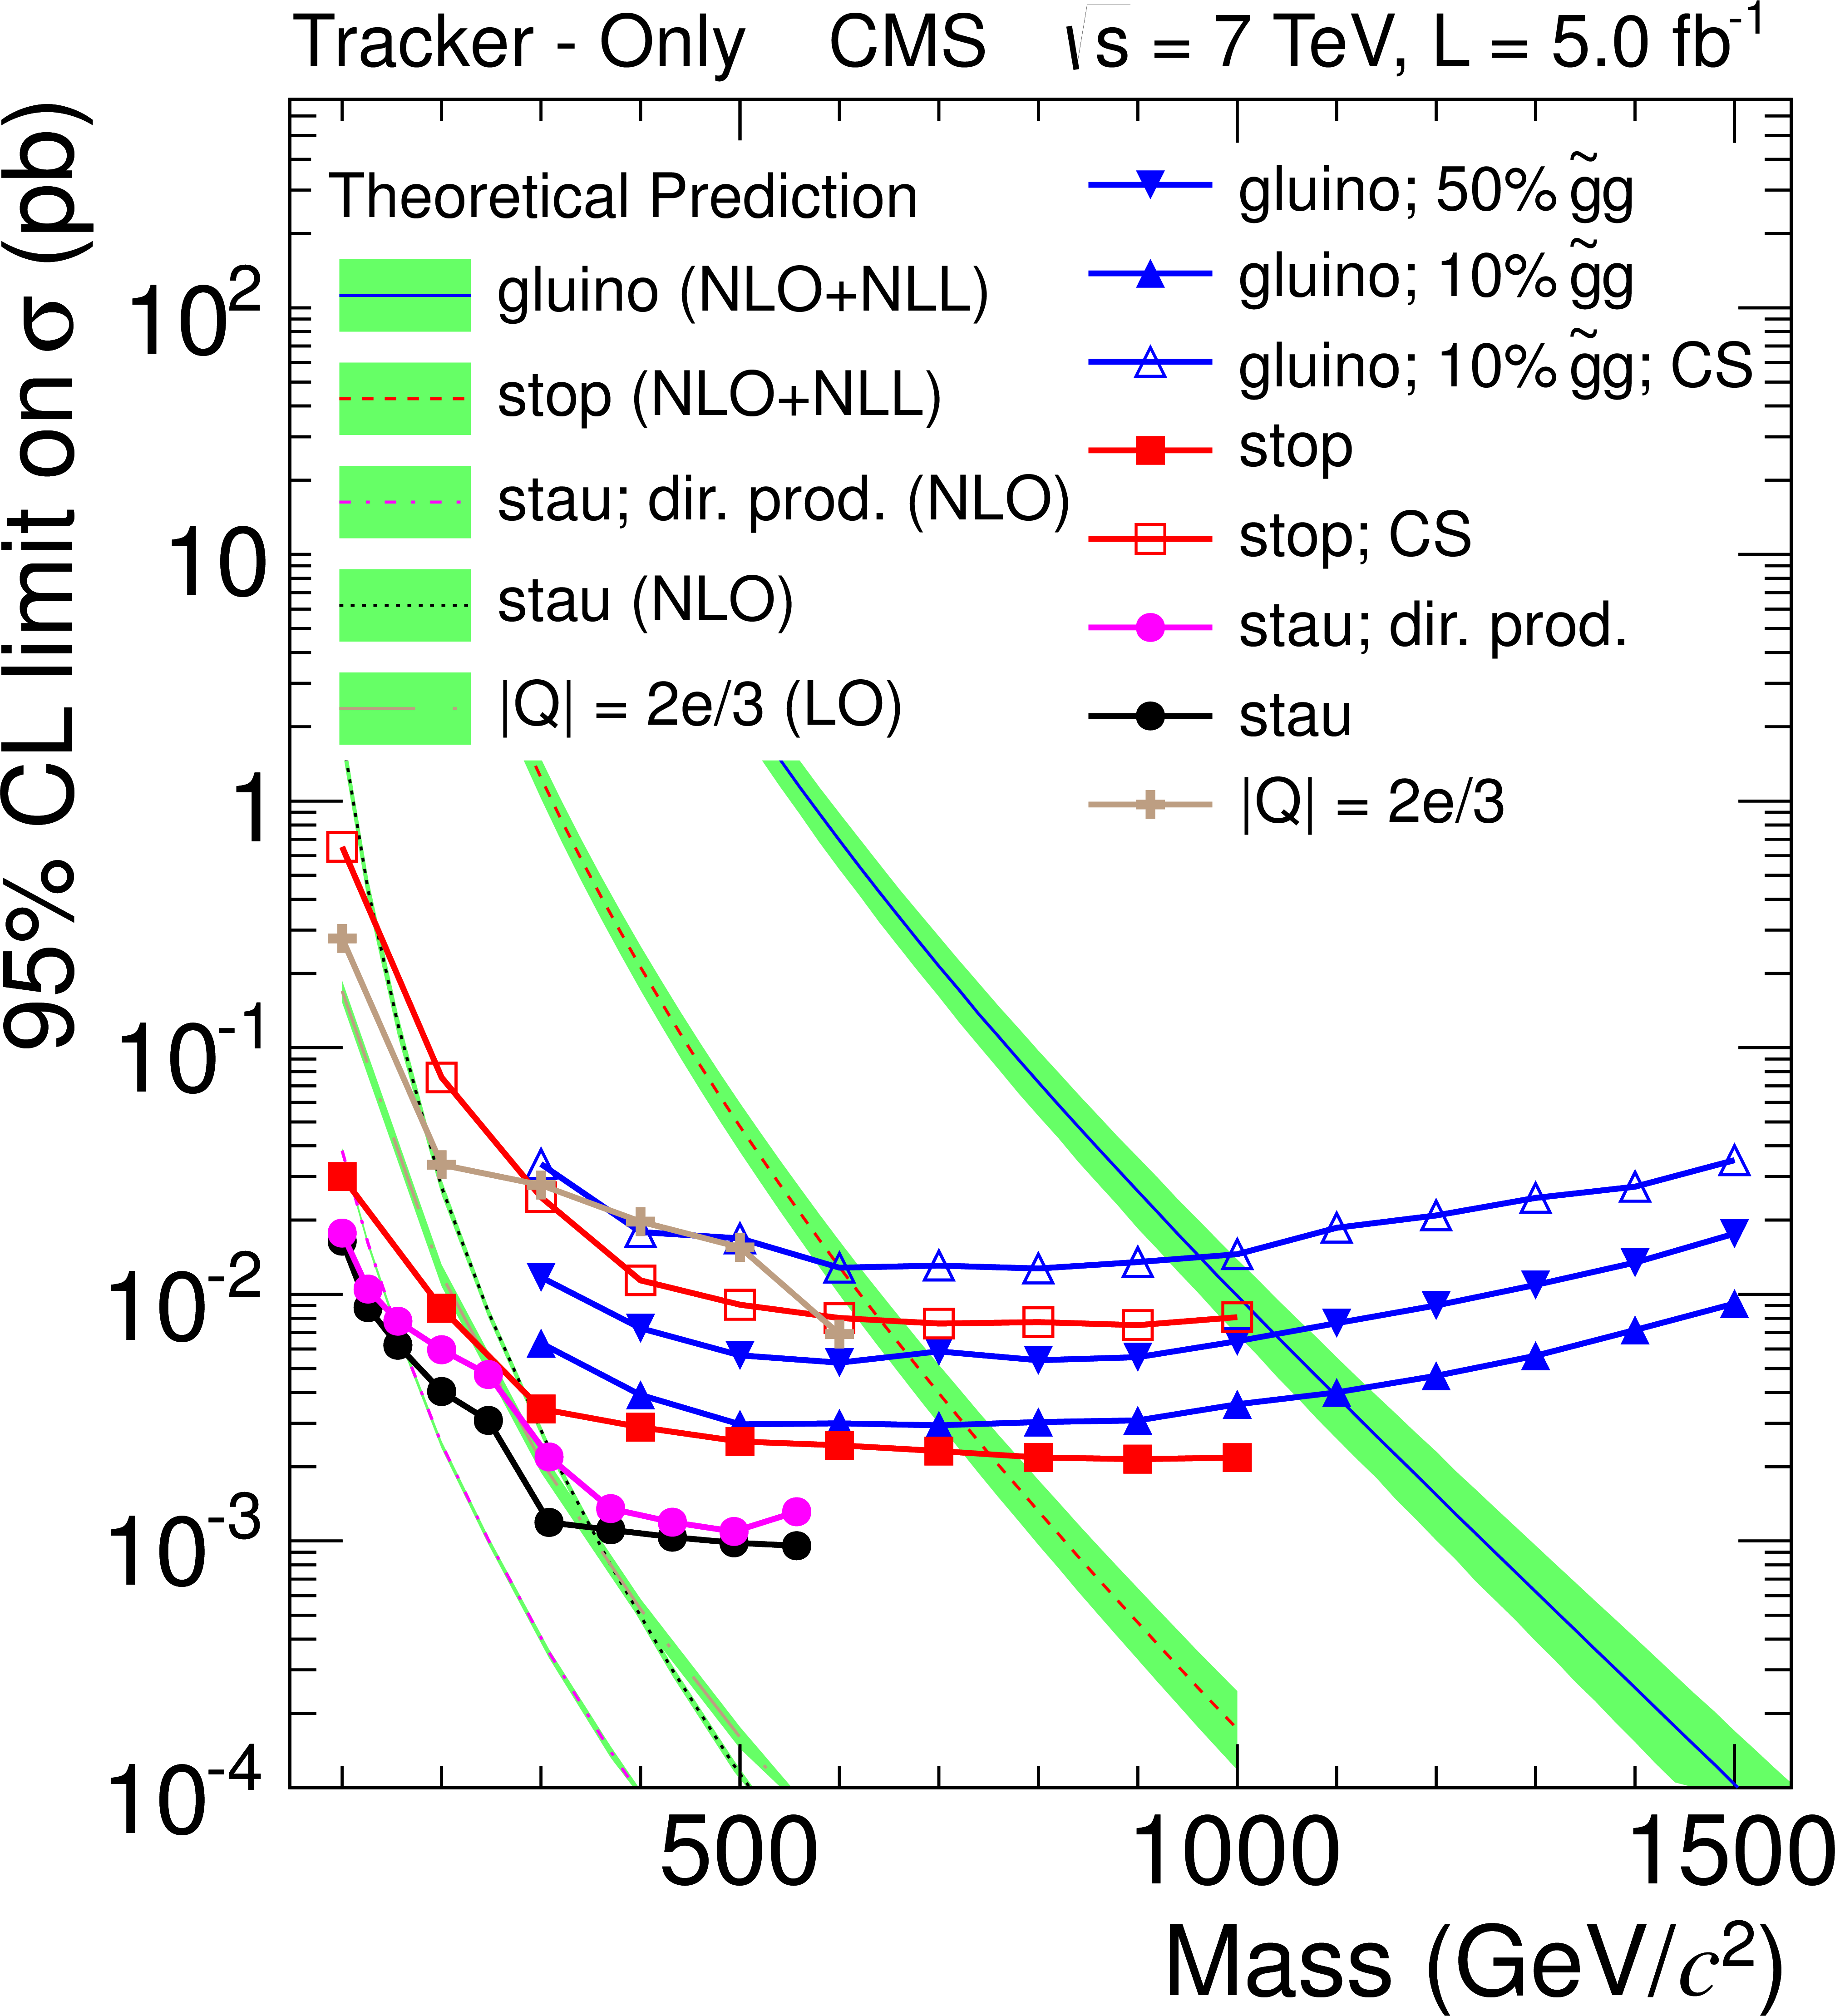
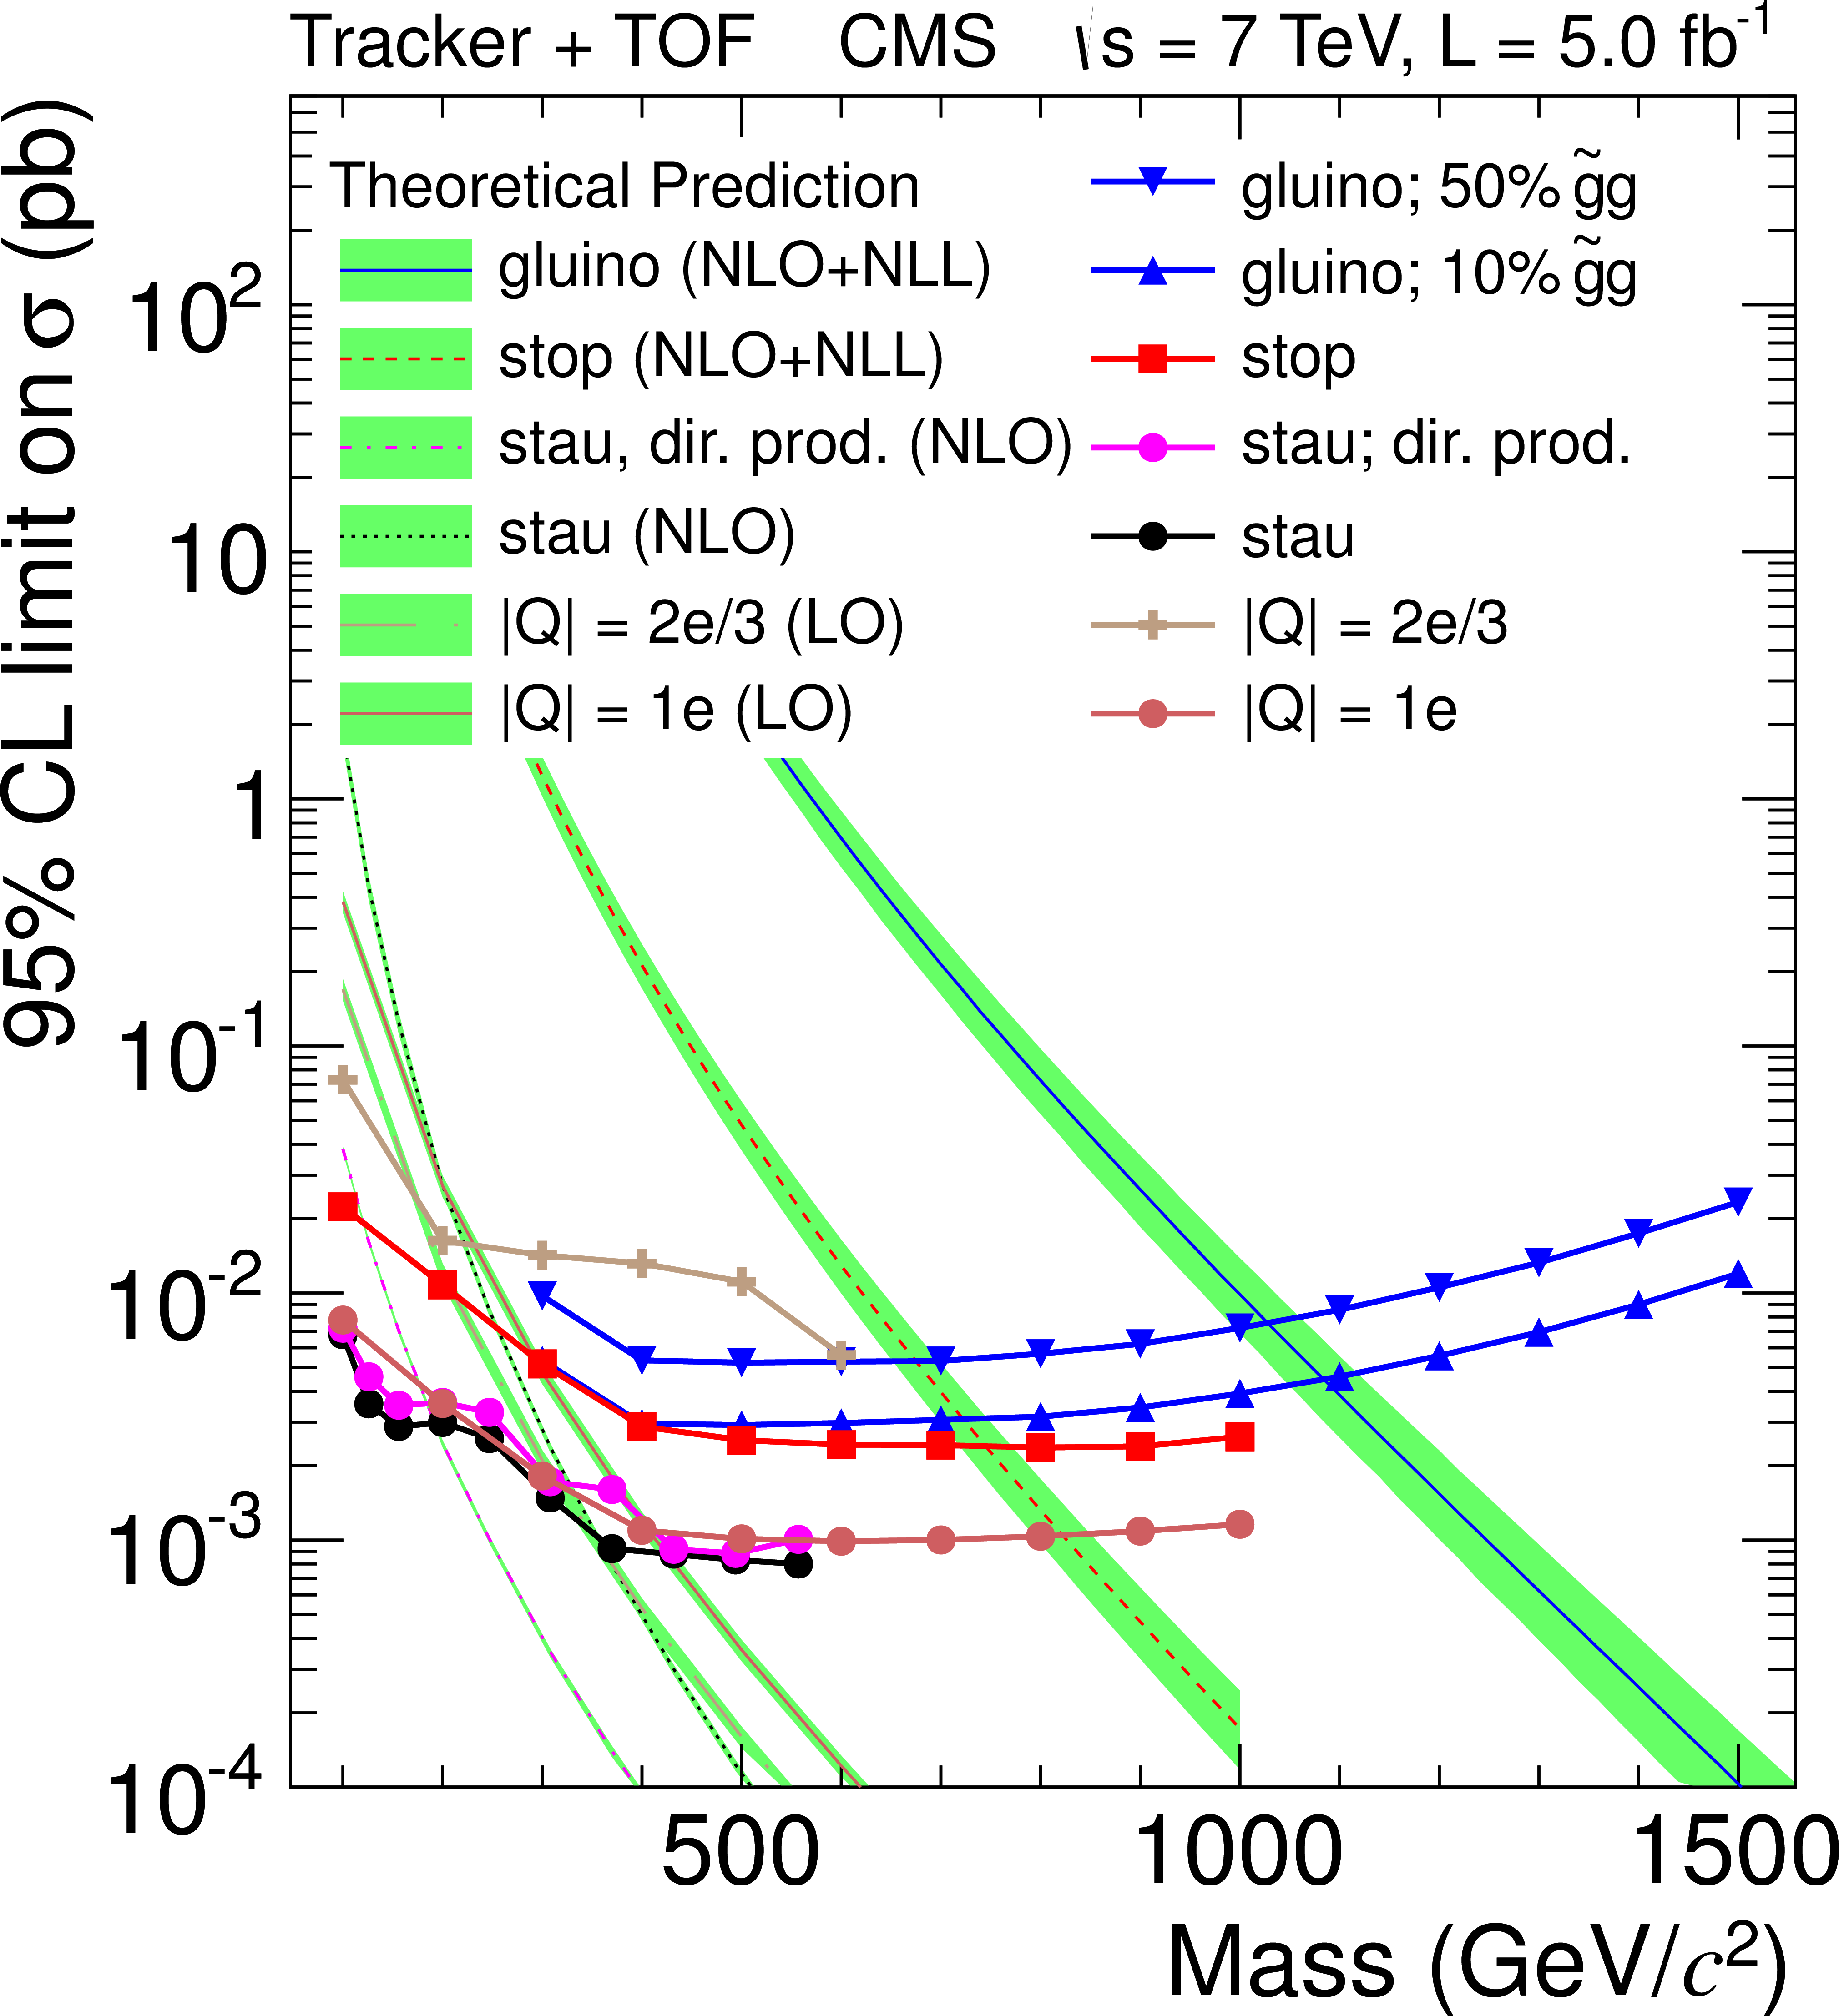
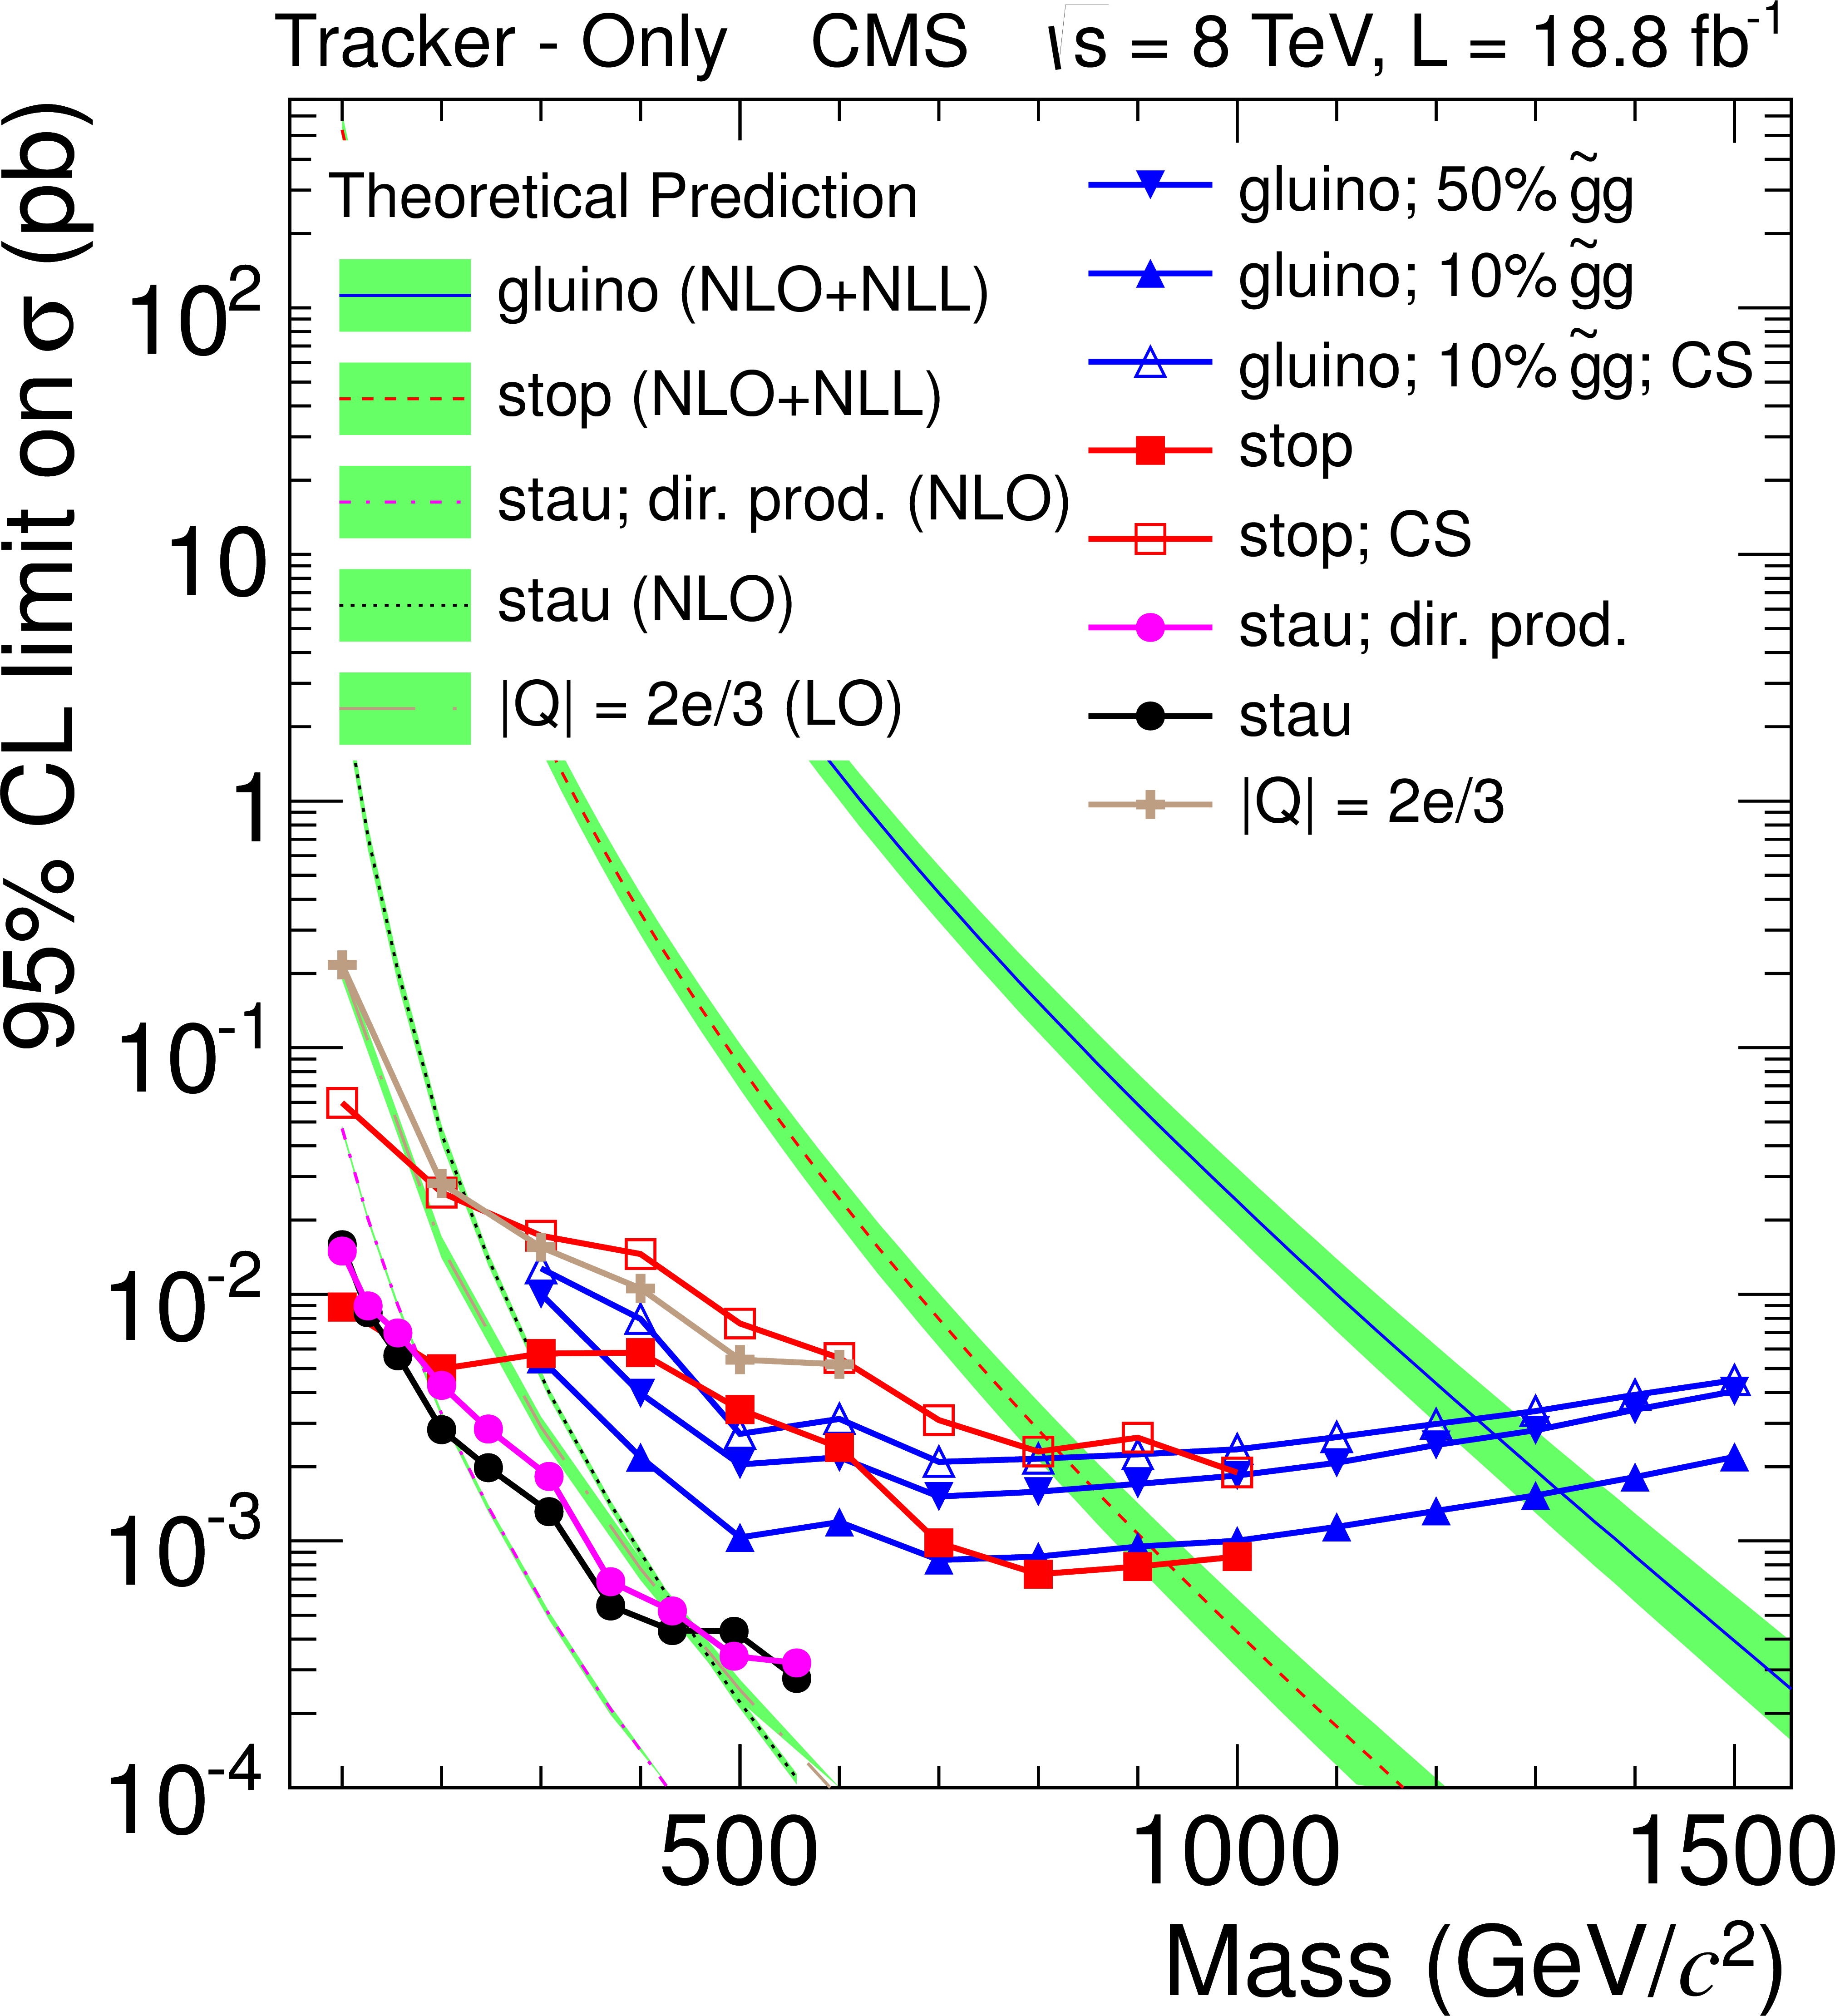
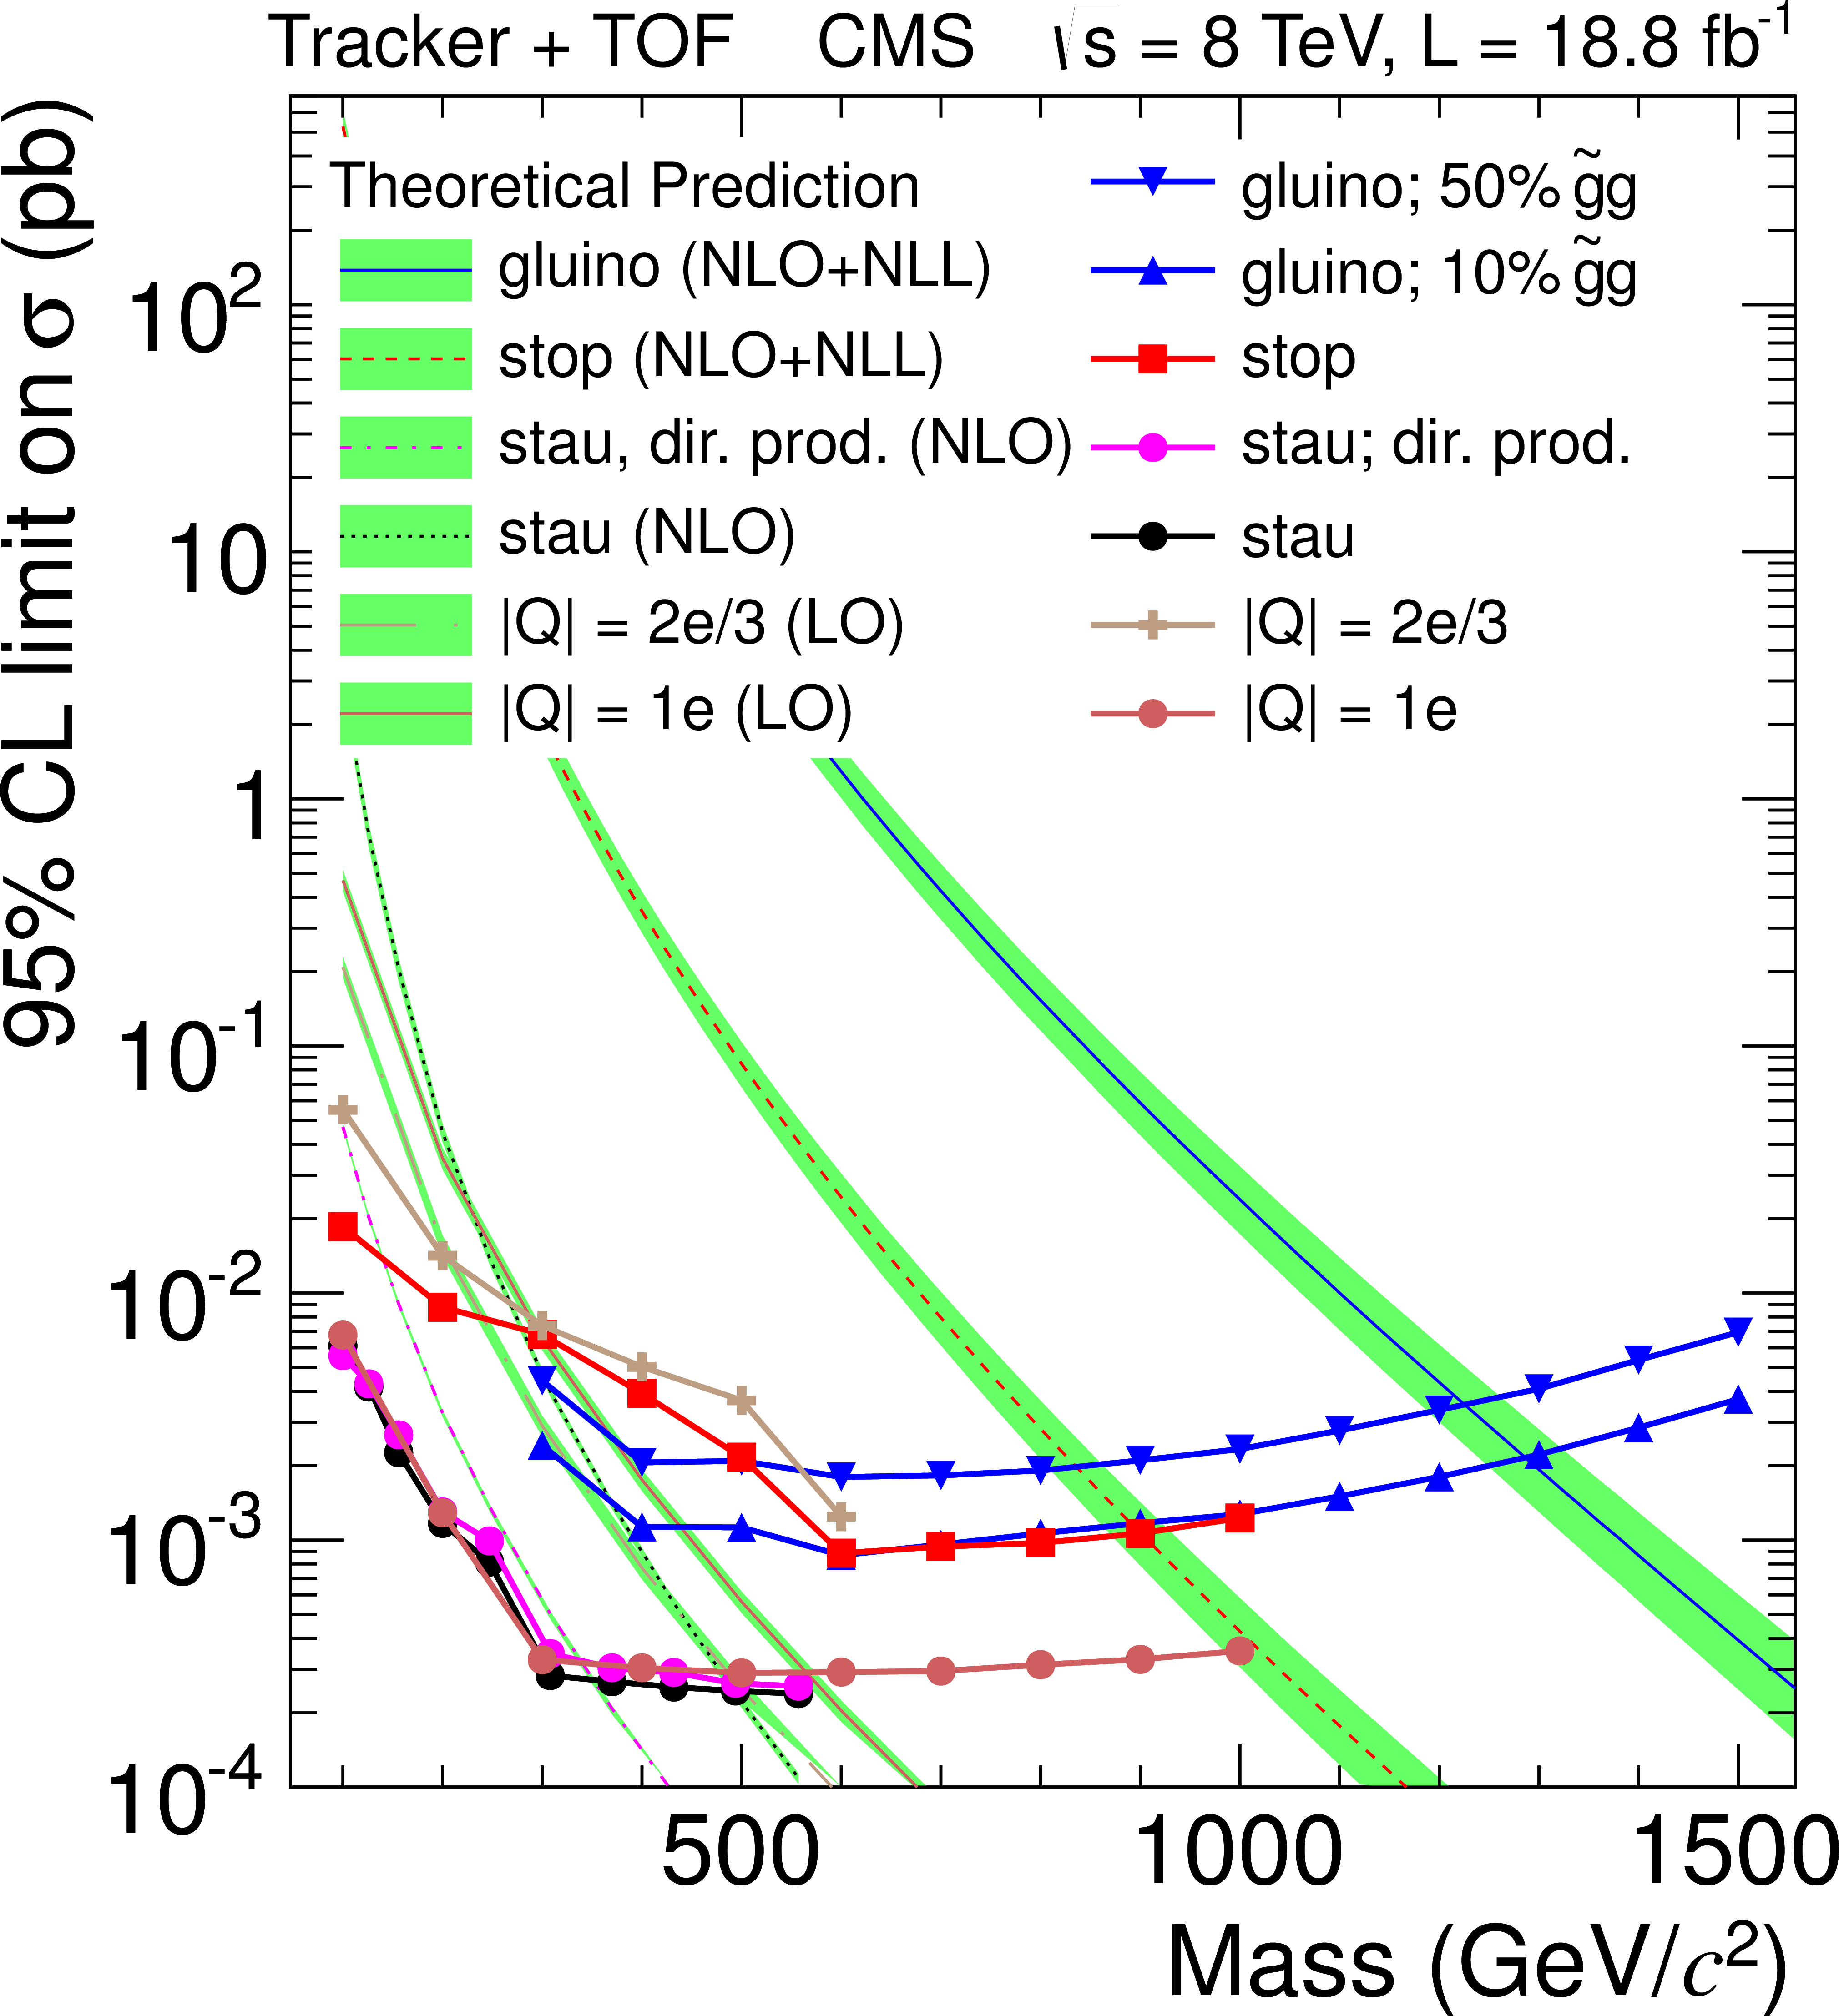
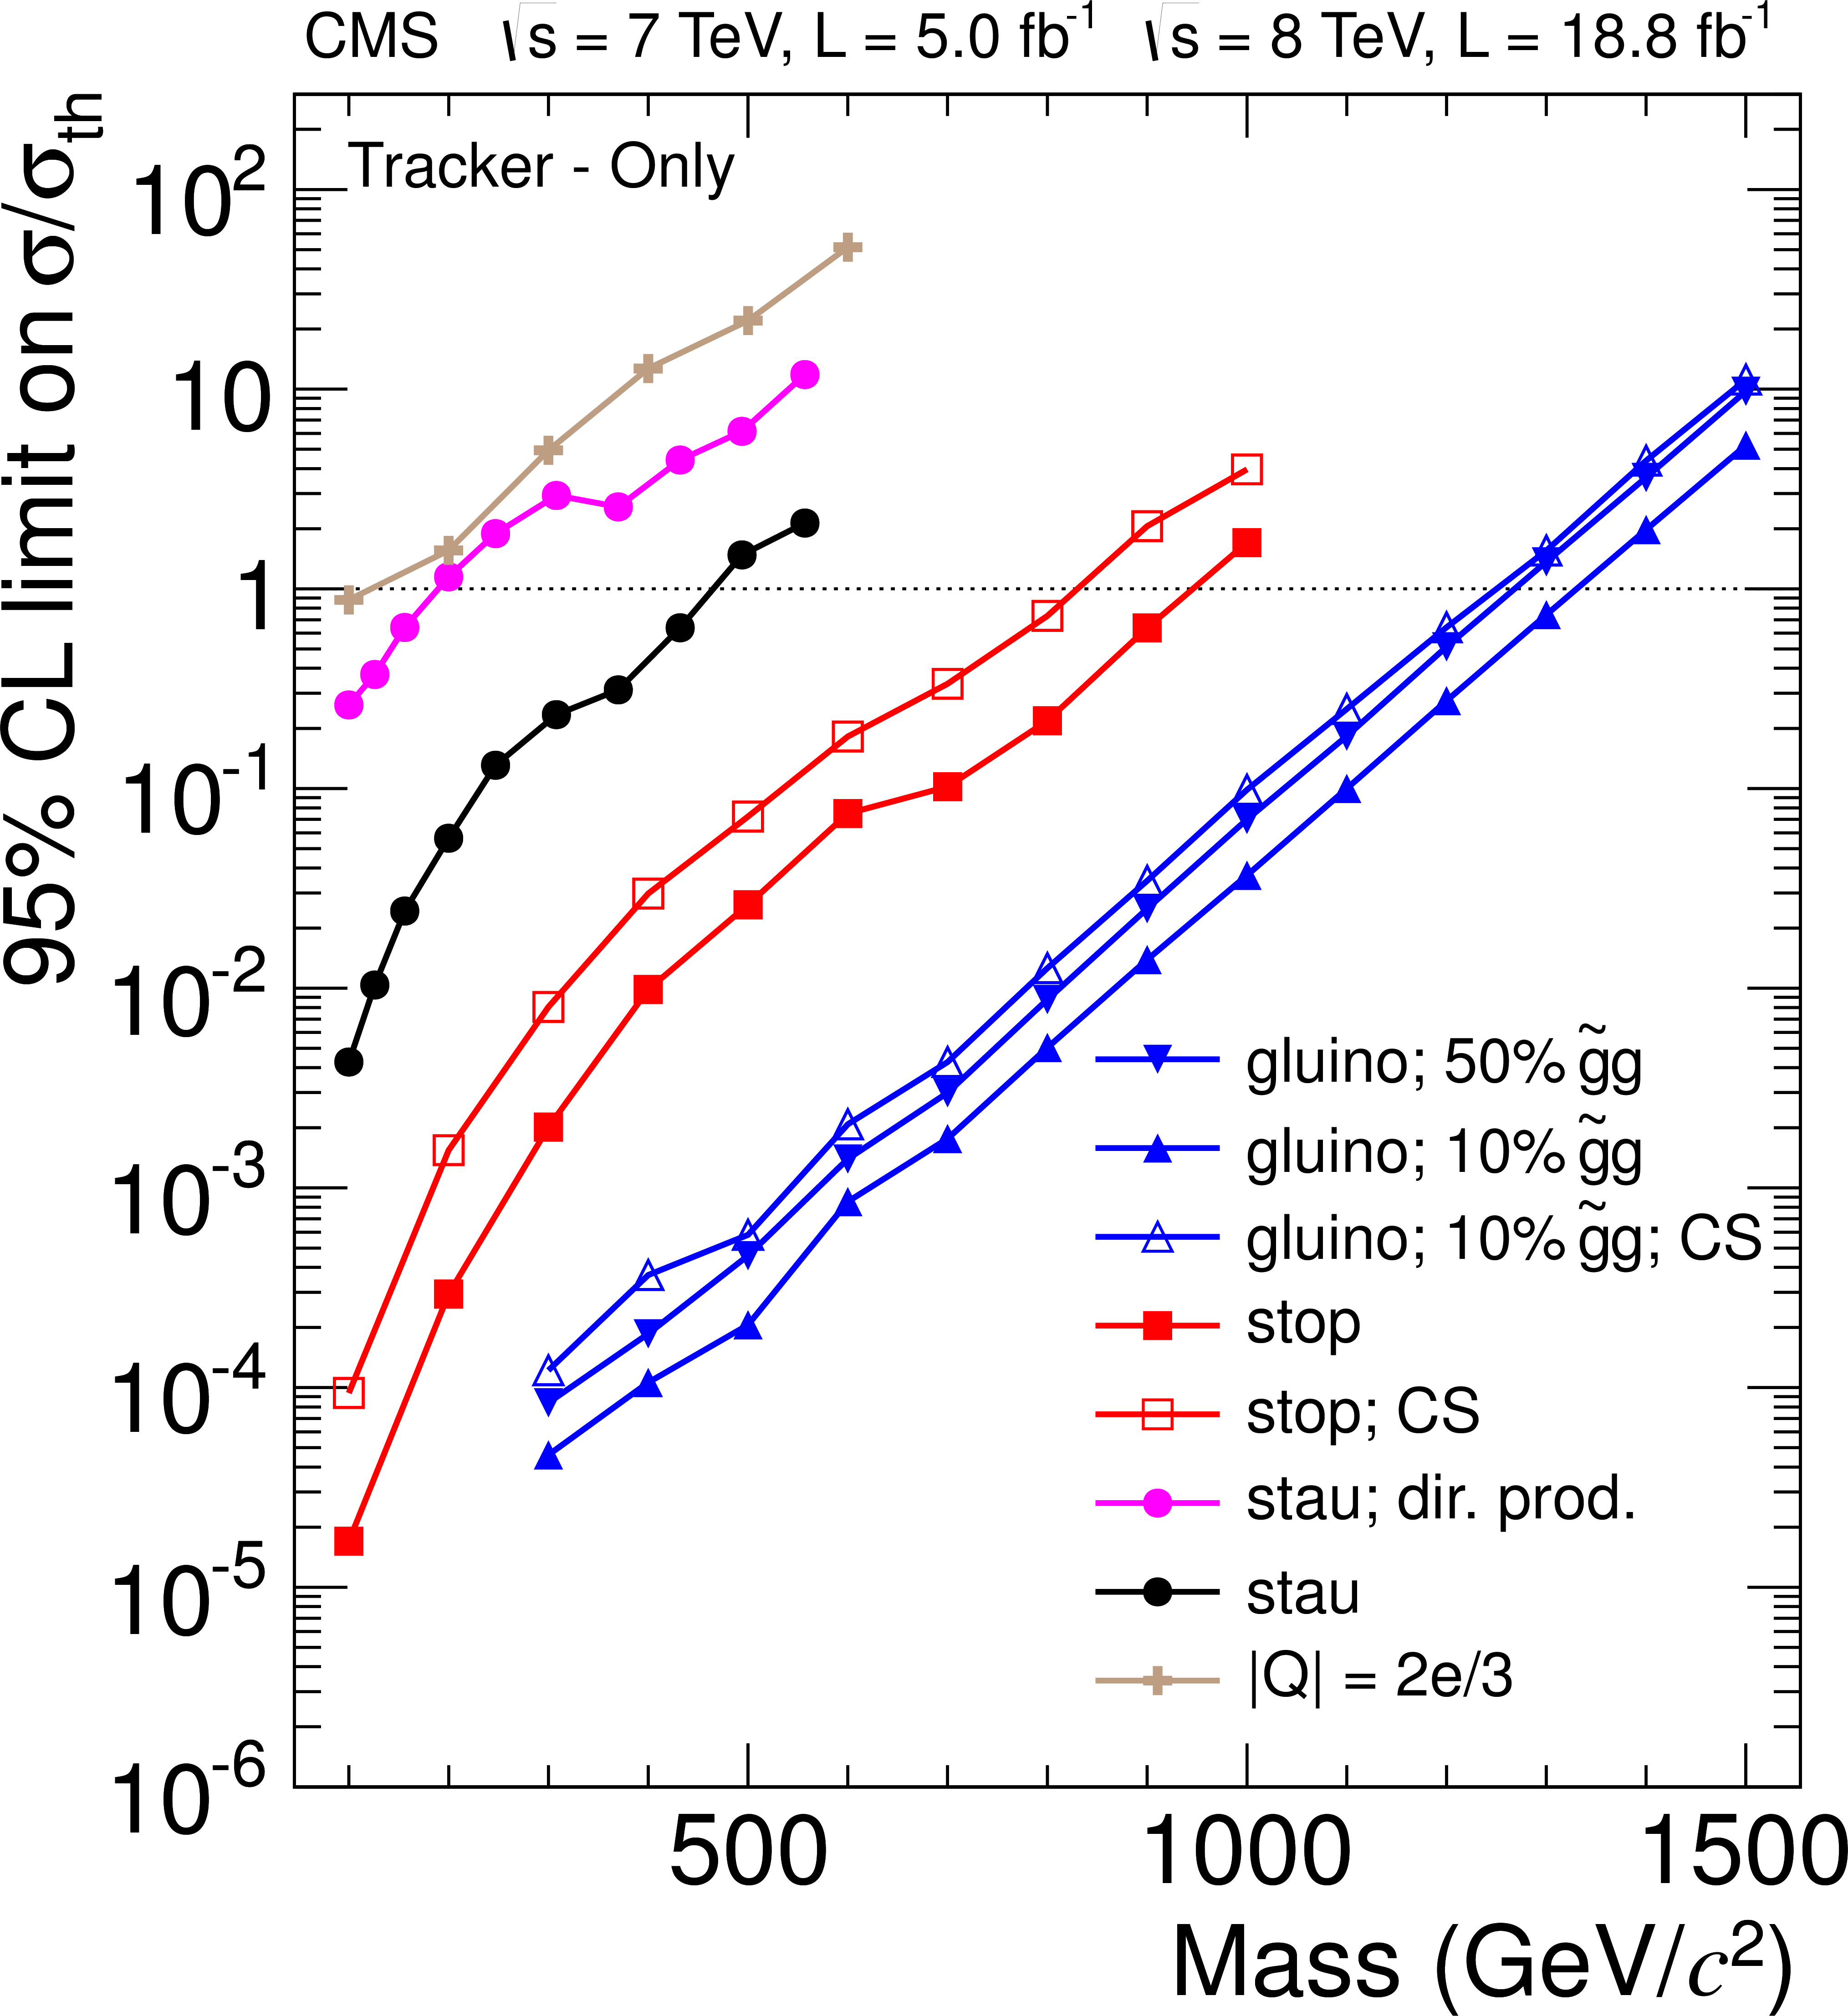
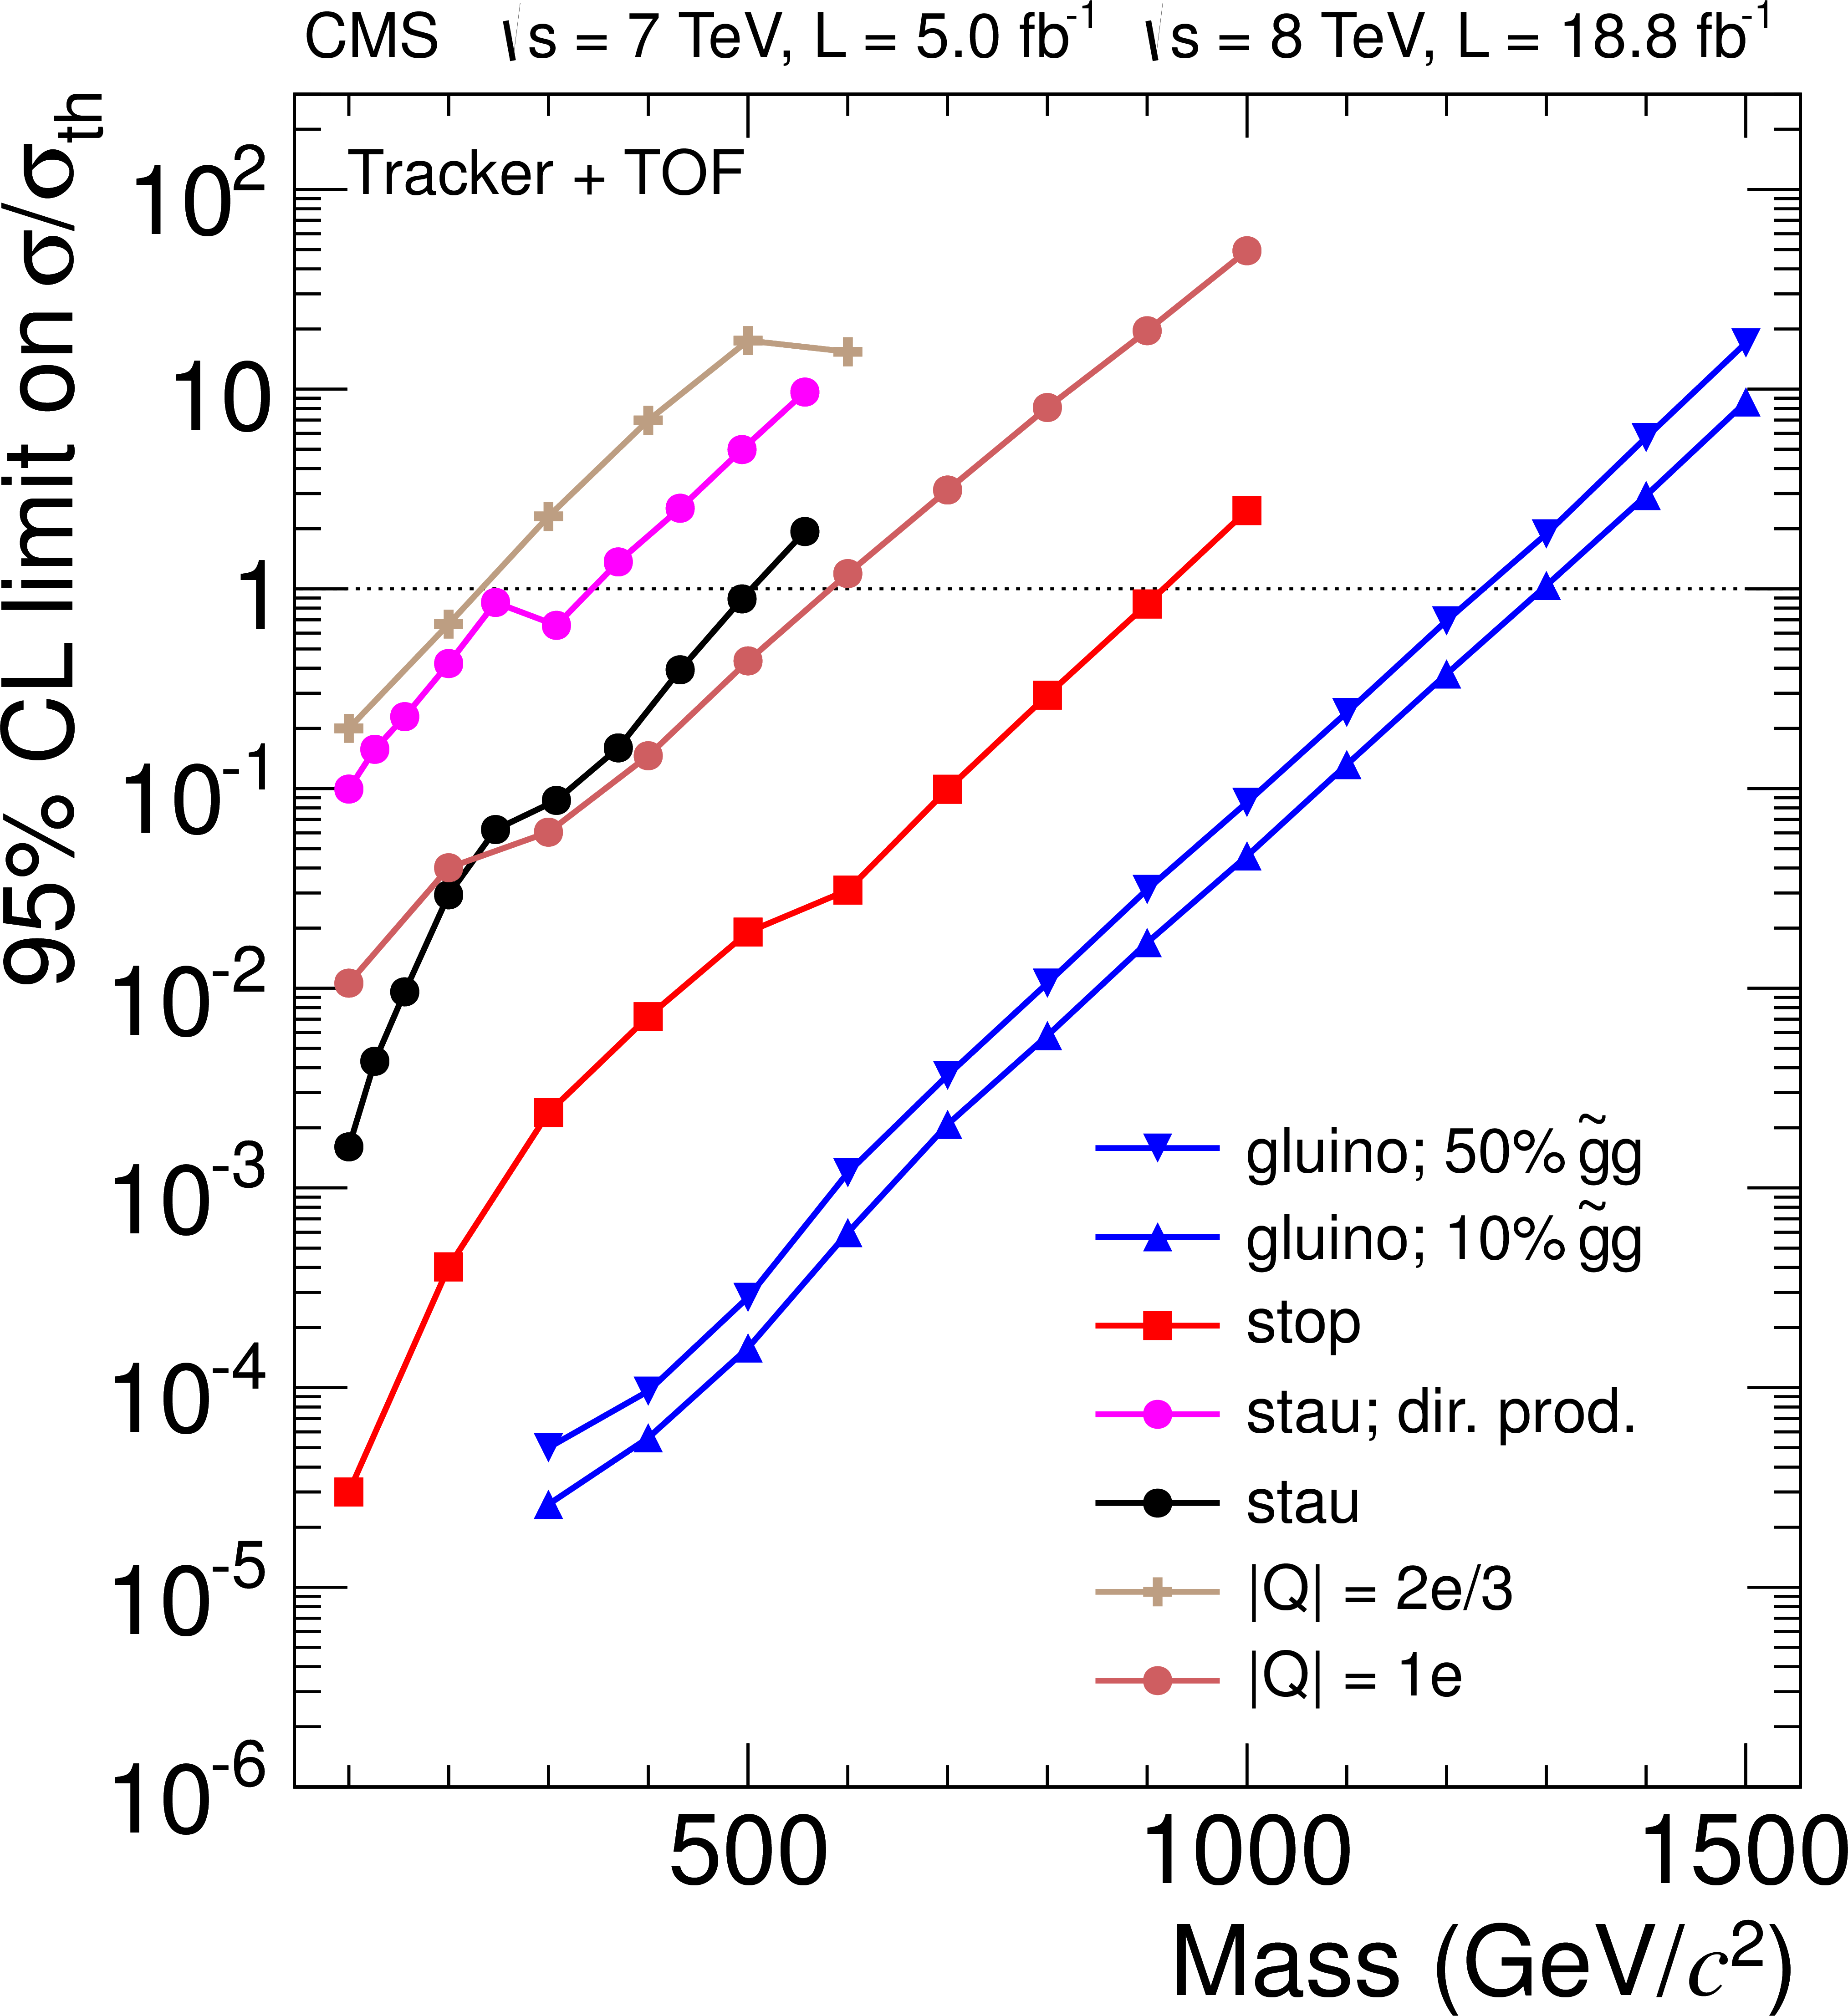
Upper cross section limits at 95% CL on various signal models for the tracker-only analysis (a,c,e) and tracker+TOF analysis (b,d,f). a,b is for the data at $\sqrt {s} =$ 7 TeV, c,d is for the data at $\sqrt {s} =$ 8 TeV, e,f shows the ratio of the limit to the theoretical value for the combined dataset. In the legend, 'CS' stands for the charge-suppressed interaction model. |
png pdf |
Figure 8-b:
Upper cross section limits at 95% CL on various signal models for the tracker-only analysis (a,c,e) and tracker+TOF analysis (b,d,f). a,b is for the data at $\sqrt {s} =$ 7 TeV, c,d is for the data at $\sqrt {s} =$ 8 TeV, e,f shows the ratio of the limit to the theoretical value for the combined dataset. In the legend, 'CS' stands for the charge-suppressed interaction model. |
png pdf |
Figure 8-c:
Upper cross section limits at 95% CL on various signal models for the tracker-only analysis (a,c,e) and tracker+TOF analysis (b,d,f). a,b is for the data at $\sqrt {s} =$ 7 TeV, c,d is for the data at $\sqrt {s} =$ 8 TeV, e,f shows the ratio of the limit to the theoretical value for the combined dataset. In the legend, 'CS' stands for the charge-suppressed interaction model. |
png pdf |
Figure 8-d:
Upper cross section limits at 95% CL on various signal models for the tracker-only analysis (a,c,e) and tracker+TOF analysis (b,d,f). a,b is for the data at $\sqrt {s} =$ 7 TeV, c,d is for the data at $\sqrt {s} =$ 8 TeV, e,f shows the ratio of the limit to the theoretical value for the combined dataset. In the legend, 'CS' stands for the charge-suppressed interaction model. |
png pdf |
Figure 8-e:
Upper cross section limits at 95% CL on various signal models for the tracker-only analysis (a,c,e) and tracker+TOF analysis (b,d,f). a,b is for the data at $\sqrt {s} =$ 7 TeV, c,d is for the data at $\sqrt {s} =$ 8 TeV, e,f shows the ratio of the limit to the theoretical value for the combined dataset. In the legend, 'CS' stands for the charge-suppressed interaction model. |
png pdf |
Figure 8-f:
Upper cross section limits at 95% CL on various signal models for the tracker-only analysis (a,c,e) and tracker+TOF analysis (b,d,f). a,b is for the data at $\sqrt {s} =$ 7 TeV, c,d is for the data at $\sqrt {s} =$ 8 TeV, e,f shows the ratio of the limit to the theoretical value for the combined dataset. In the legend, 'CS' stands for the charge-suppressed interaction model. |
png pdf |
Figure 9-a:
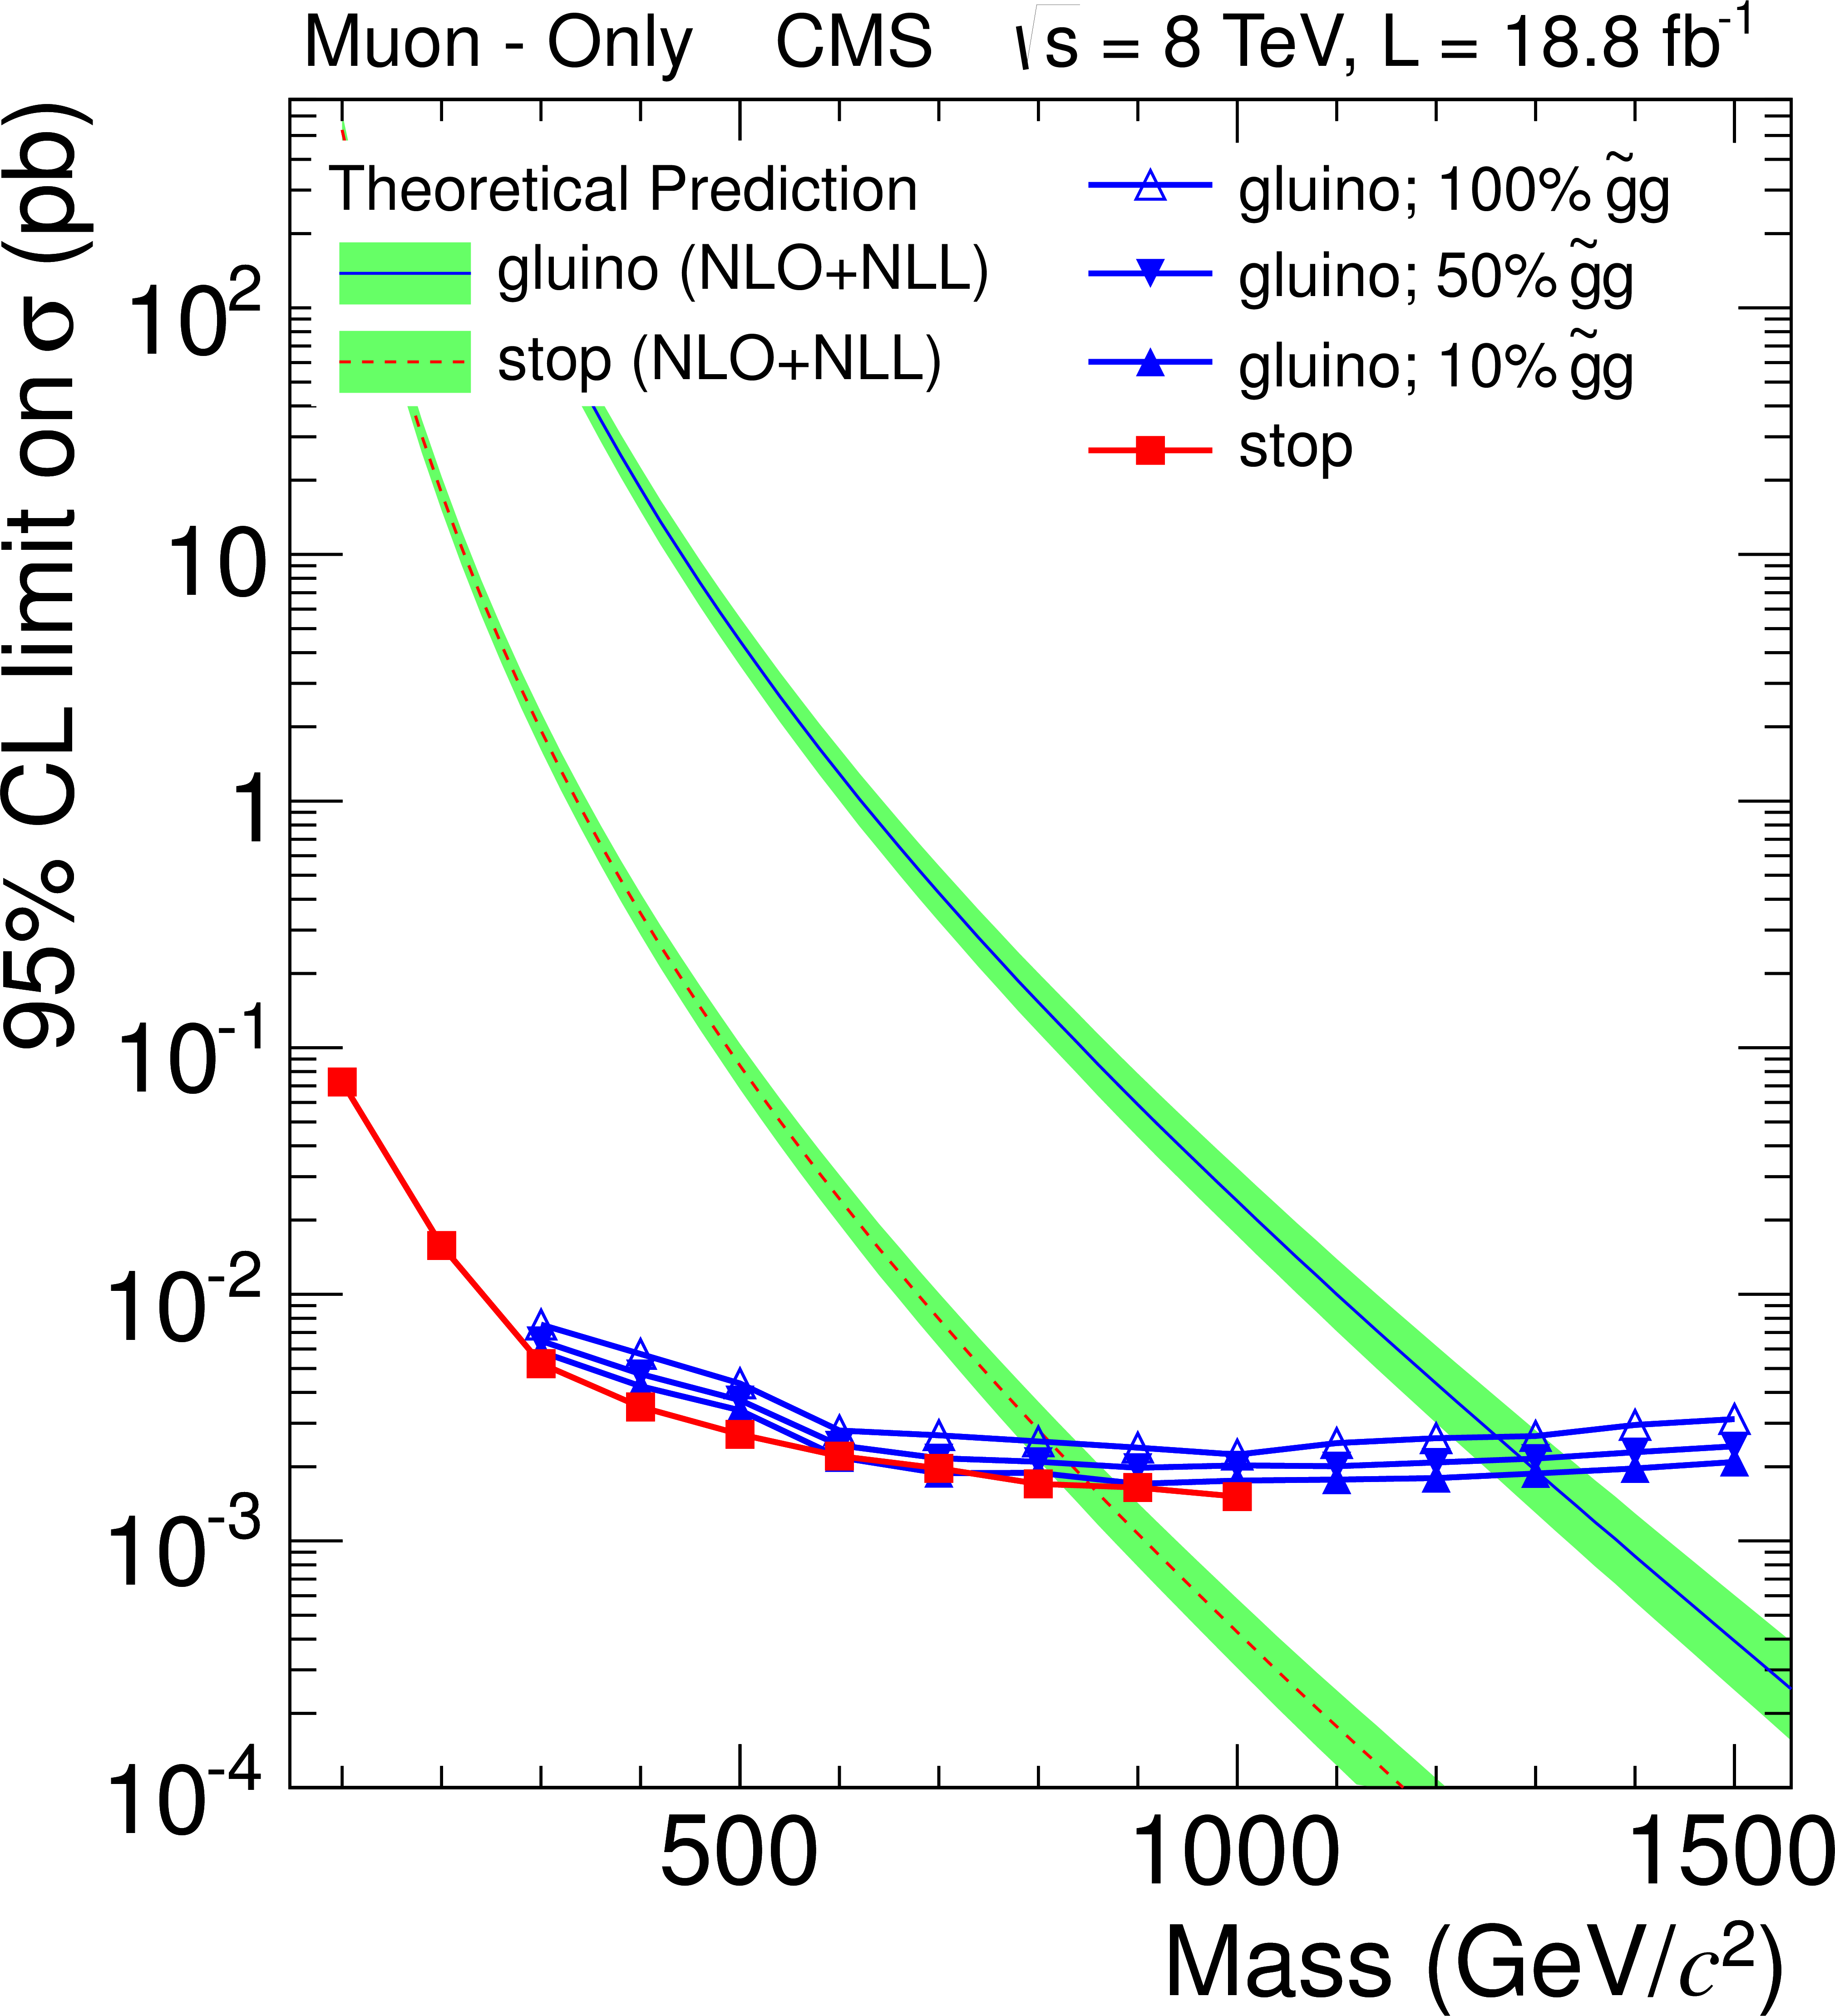
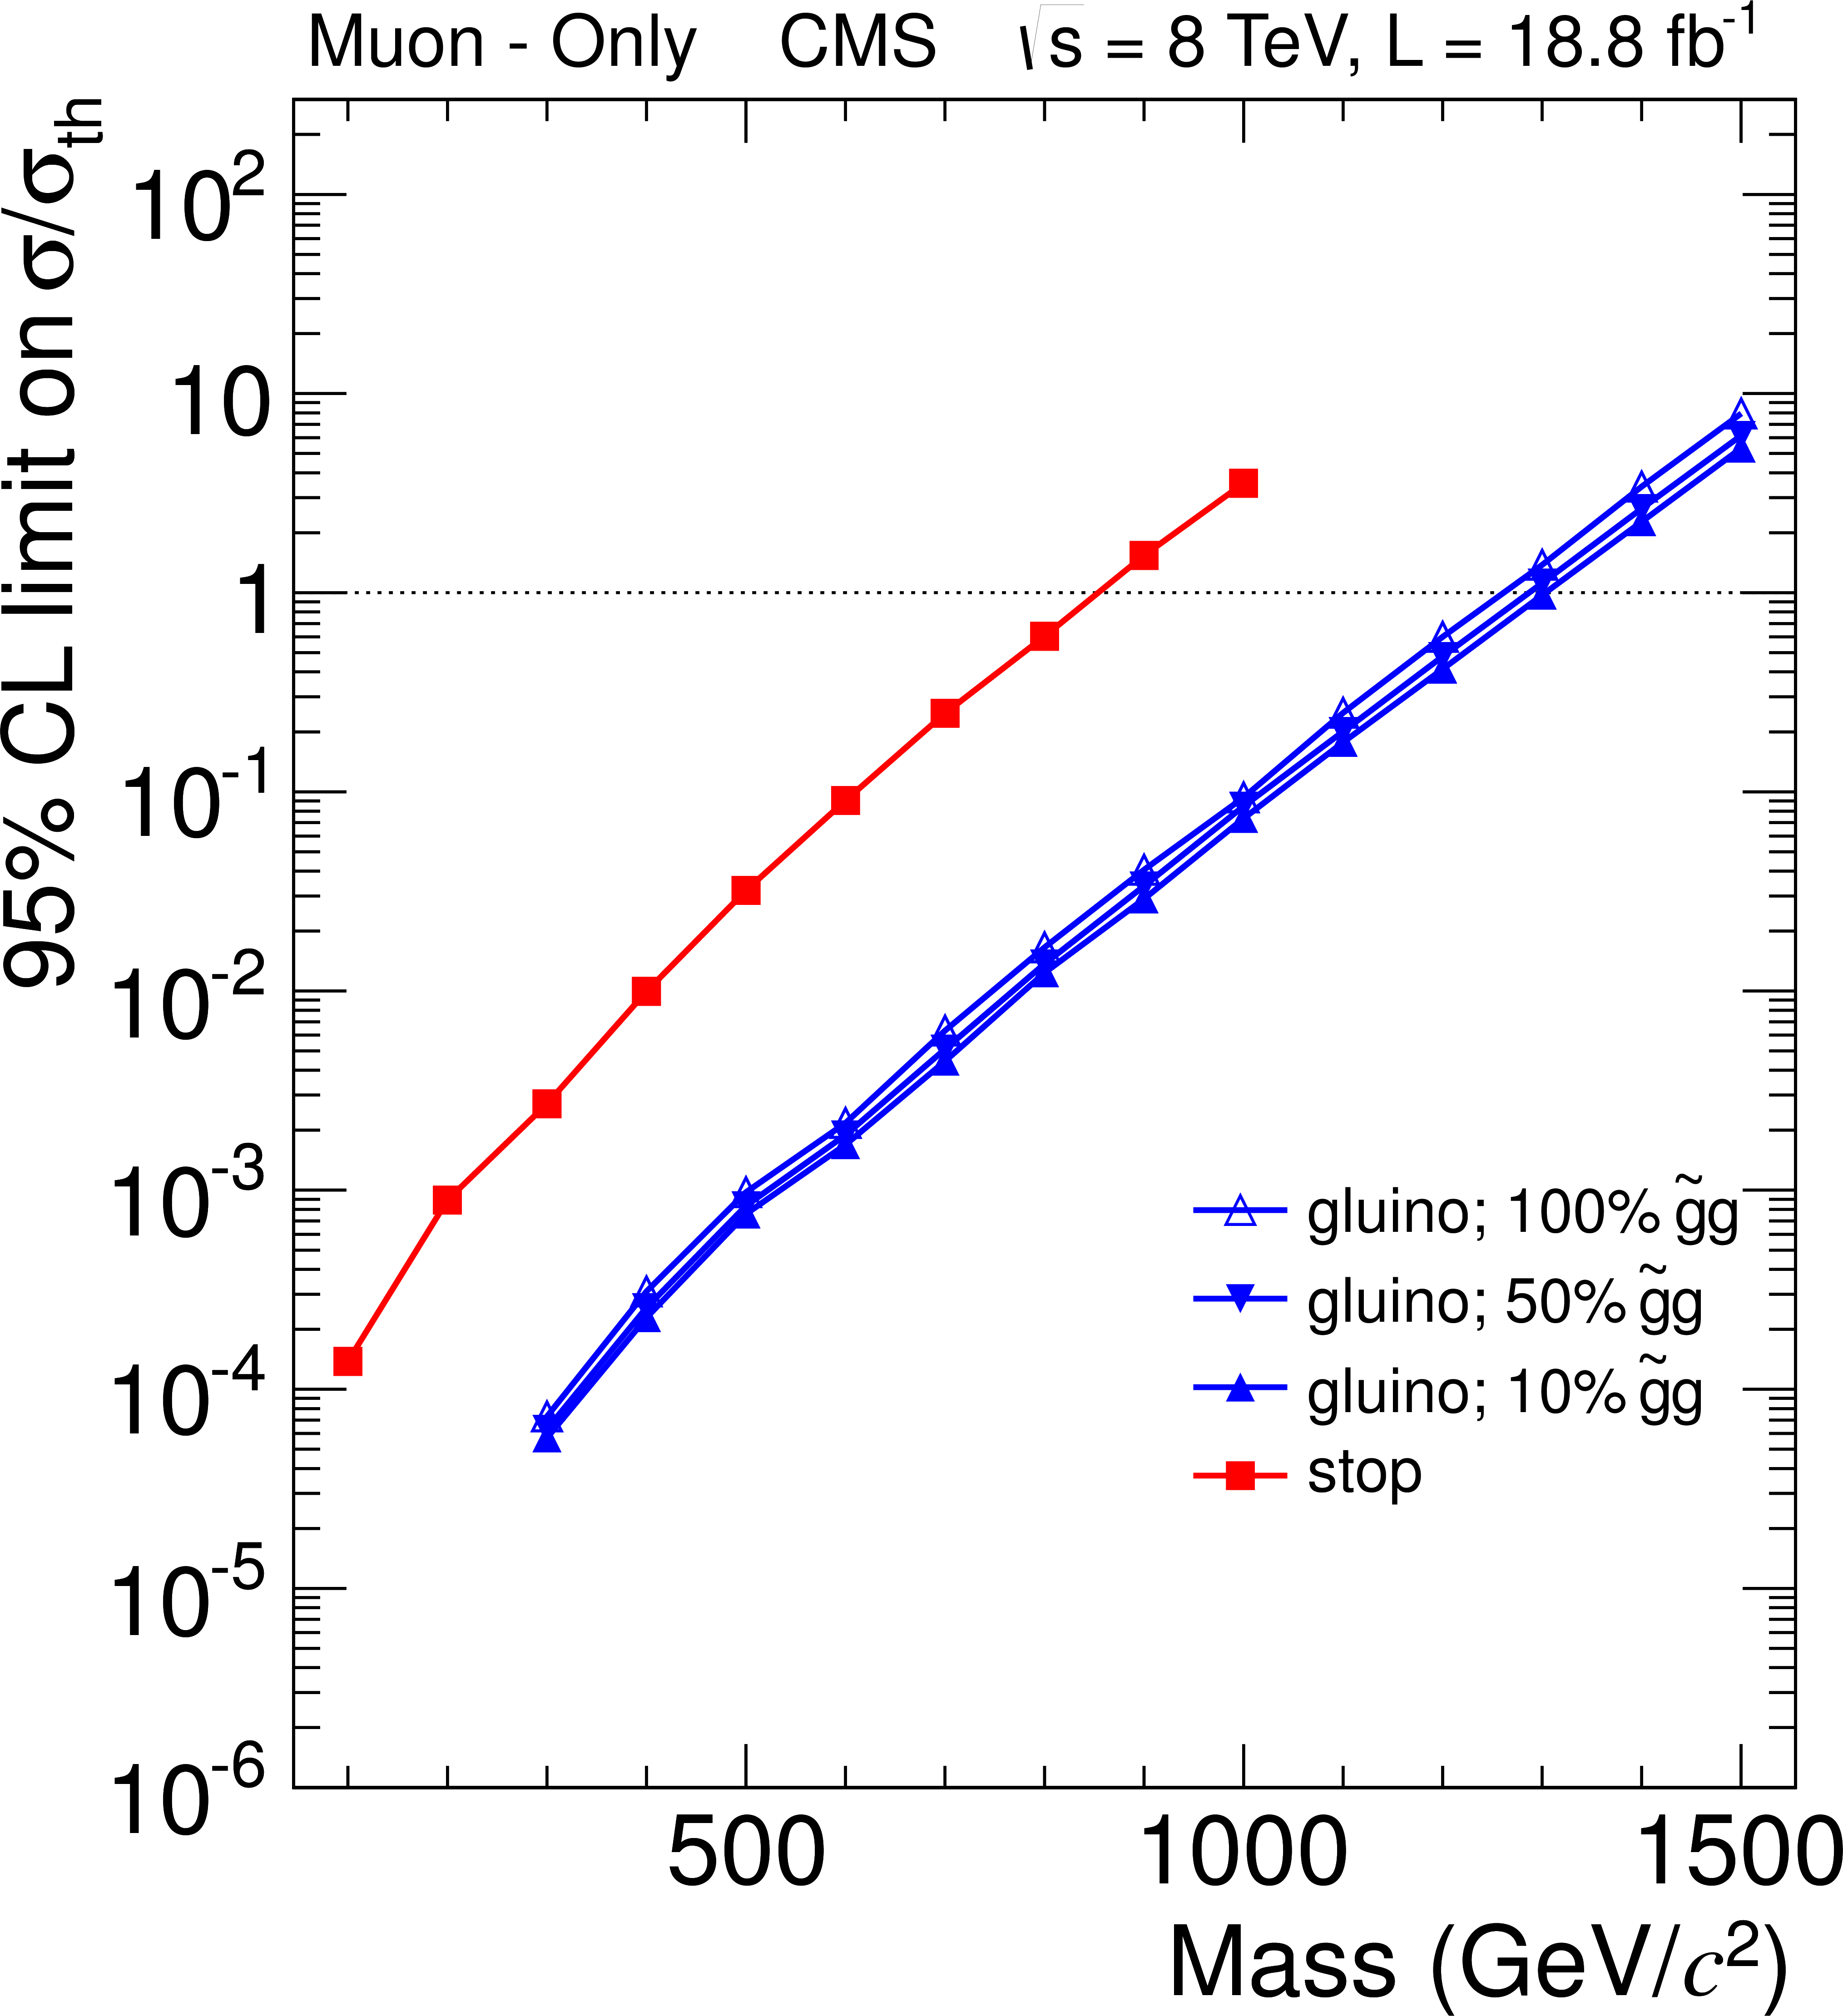
Upper cross section limits at 95% CL on various signal models for the muon-only analysis for the data at $\sqrt {s} =$ 8 TeV (a). Limits on the signal strength ($\mu = \sigma /\sigma _{\text {th}}$) for the same data (b). |
png pdf |
Figure 9-b:
Upper cross section limits at 95% CL on various signal models for the muon-only analysis for the data at $\sqrt {s} =$ 8 TeV (a). Limits on the signal strength ($\mu = \sigma /\sigma _{\text {th}}$) for the same data (b). |
png pdf |
Figure 10-a:
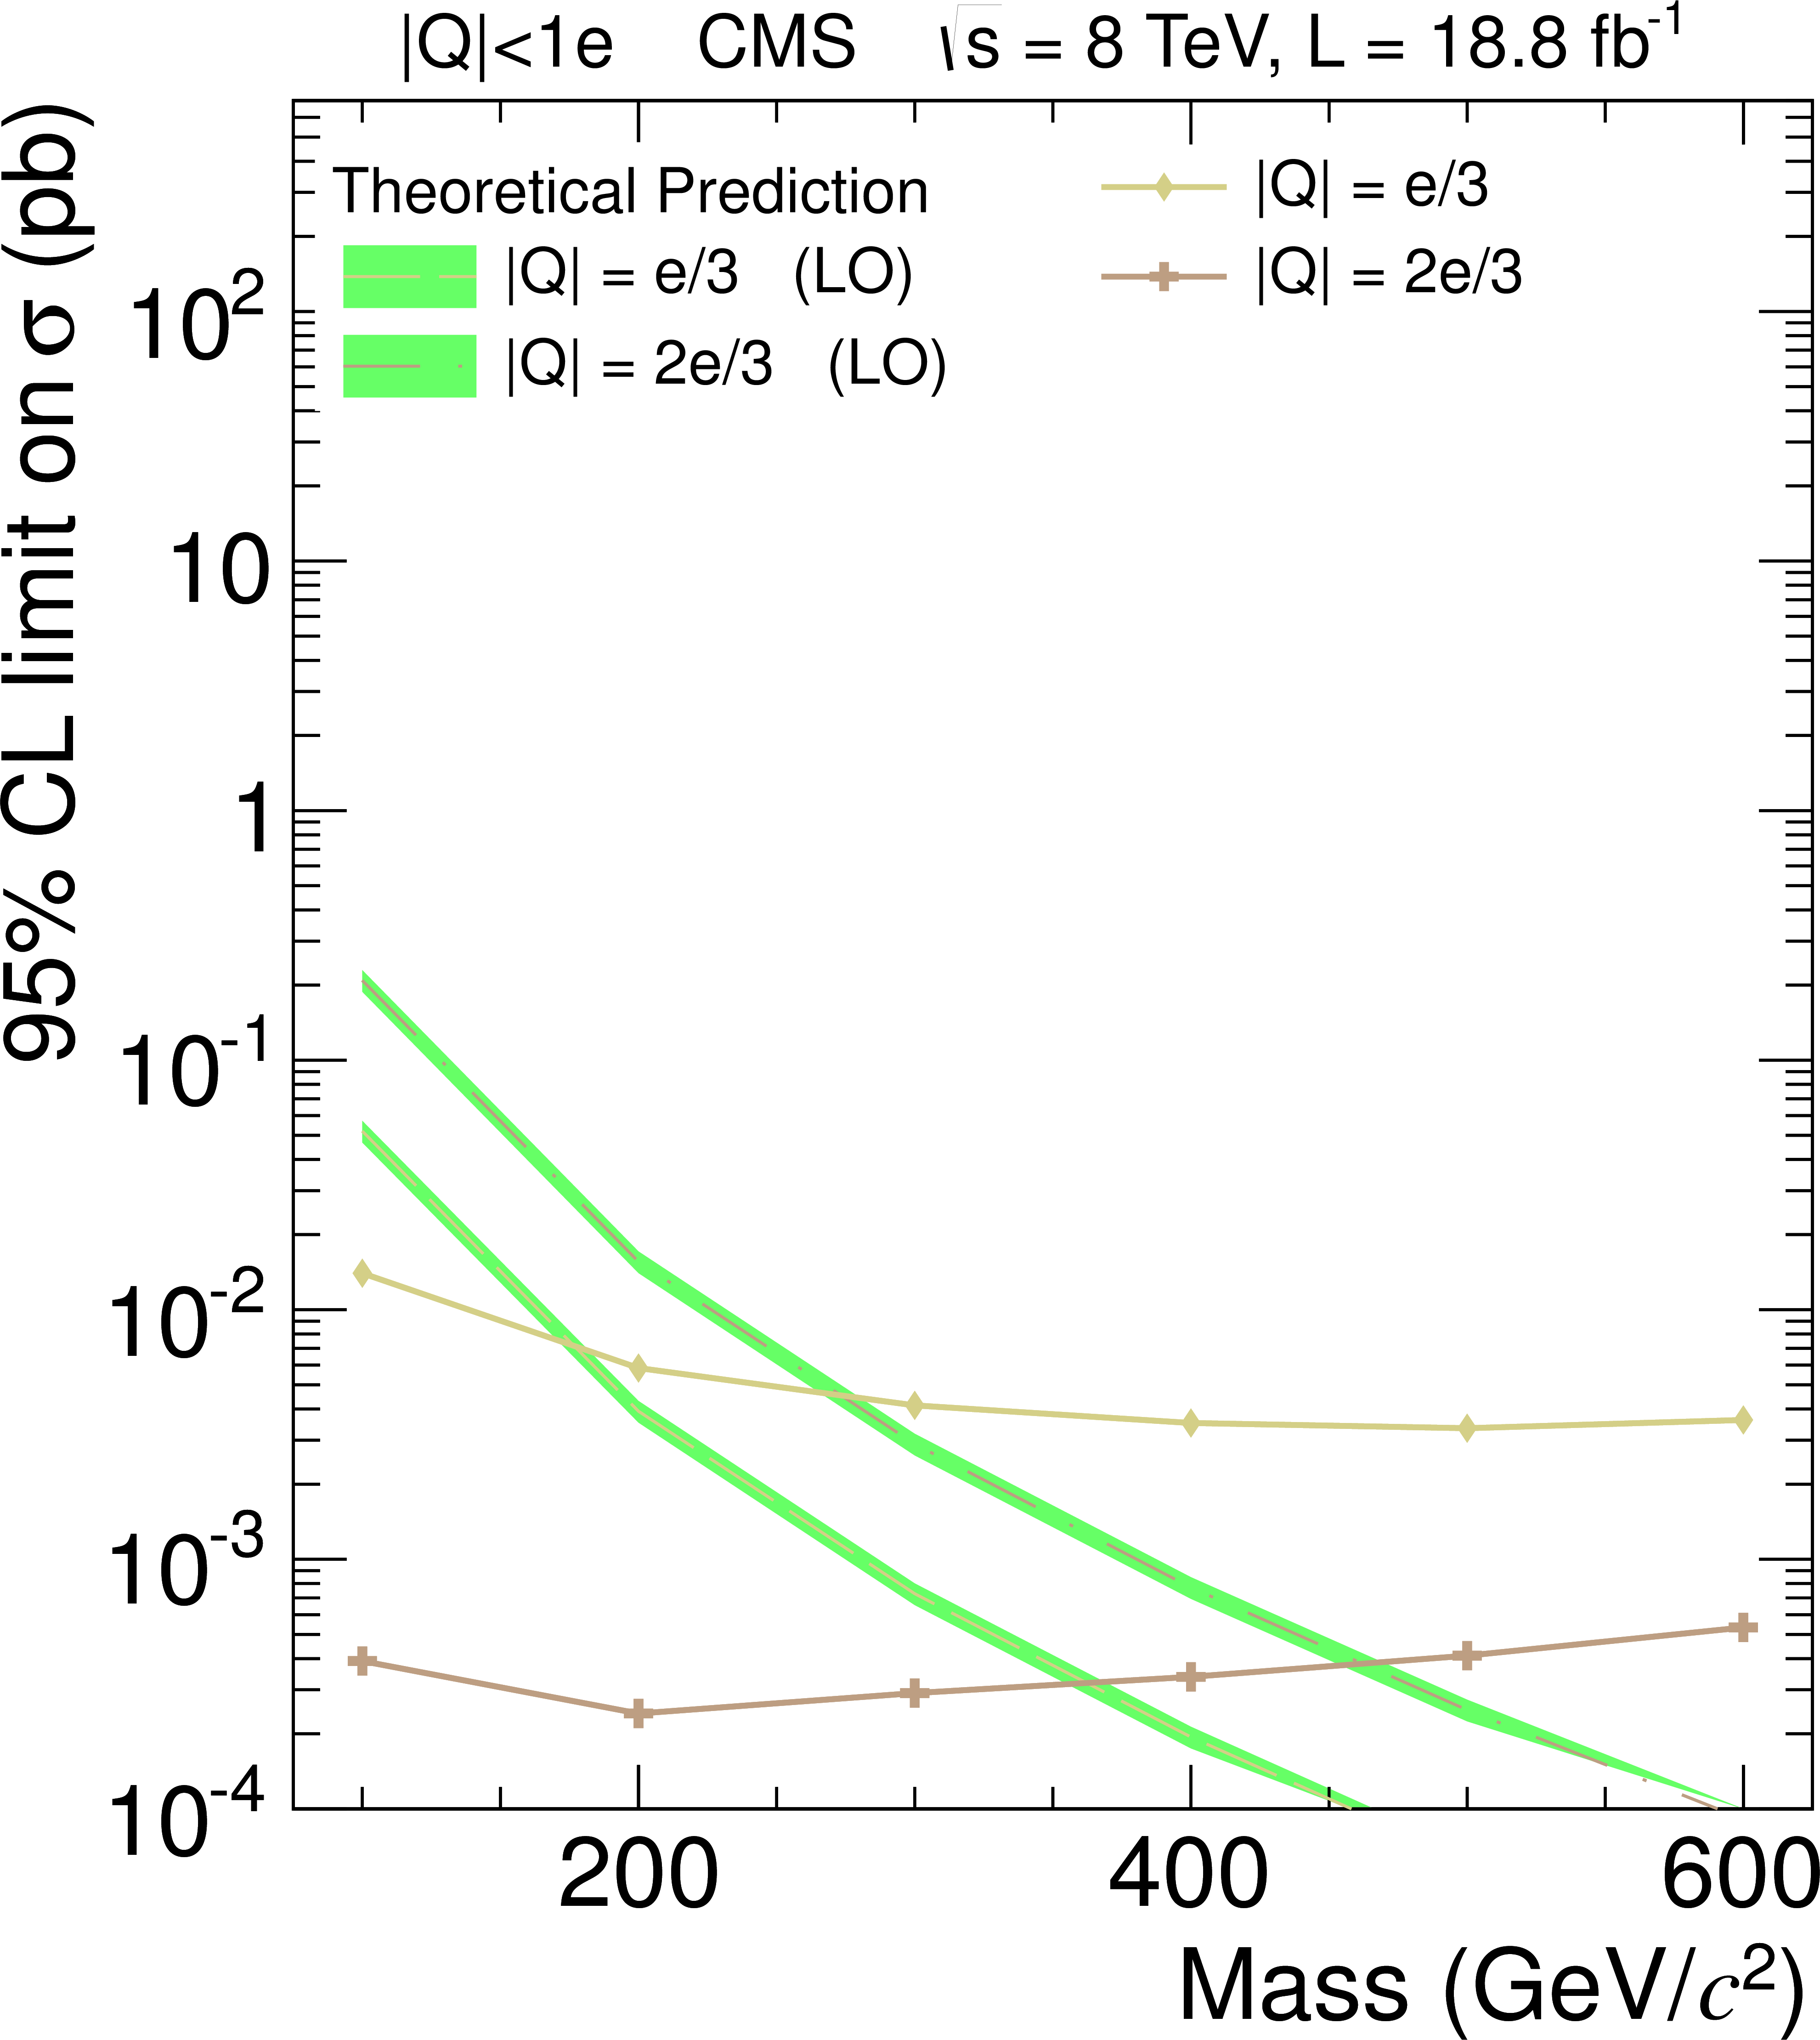
Upper cross section limits at 95% CL on various signal models for the fractionally charged analysis (a,c,e) and multiply charged analysis (b,d,f). a,b is for the data at $\sqrt {s} =$ 7 TeV, c.d is for the data at $\sqrt {s} =$ 8 TeV, e,f shows the ratio of the limit to the theoretical value for the combined dataset. |
png pdf |
Figure 10-b:
Upper cross section limits at 95% CL on various signal models for the fractionally charged analysis (a,c,e) and multiply charged analysis (b,d,f). a,b is for the data at $\sqrt {s} =$ 7 TeV, c.d is for the data at $\sqrt {s} =$ 8 TeV, e,f shows the ratio of the limit to the theoretical value for the combined dataset. |
png pdf |
Figure 10-c:
Upper cross section limits at 95% CL on various signal models for the fractionally charged analysis (a,c,e) and multiply charged analysis (b,d,f). a,b is for the data at $\sqrt {s} =$ 7 TeV, c.d is for the data at $\sqrt {s} =$ 8 TeV, e,f shows the ratio of the limit to the theoretical value for the combined dataset. |

png pdf |
Figure 10-d:
Upper cross section limits at 95% CL on various signal models for the fractionally charged analysis (a,c,e) and multiply charged analysis (b,d,f). a,b is for the data at $\sqrt {s} =$ 7 TeV, c.d is for the data at $\sqrt {s} =$ 8 TeV, e,f shows the ratio of the limit to the theoretical value for the combined dataset. |
png pdf |
Figure 10-e:
Upper cross section limits at 95% CL on various signal models for the fractionally charged analysis (a,c,e) and multiply charged analysis (b,d,f). a,b is for the data at $\sqrt {s} =$ 7 TeV, c.d is for the data at $\sqrt {s} =$ 8 TeV, e,f shows the ratio of the limit to the theoretical value for the combined dataset. |
png pdf |
Figure 10-f:
Upper cross section limits at 95% CL on various signal models for the fractionally charged analysis (a,c,e) and multiply charged analysis (b,d,f). a,b is for the data at $\sqrt {s} =$ 7 TeV, c.d is for the data at $\sqrt {s} =$ 8 TeV, e,f shows the ratio of the limit to the theoretical value for the combined dataset. |
png pdf |
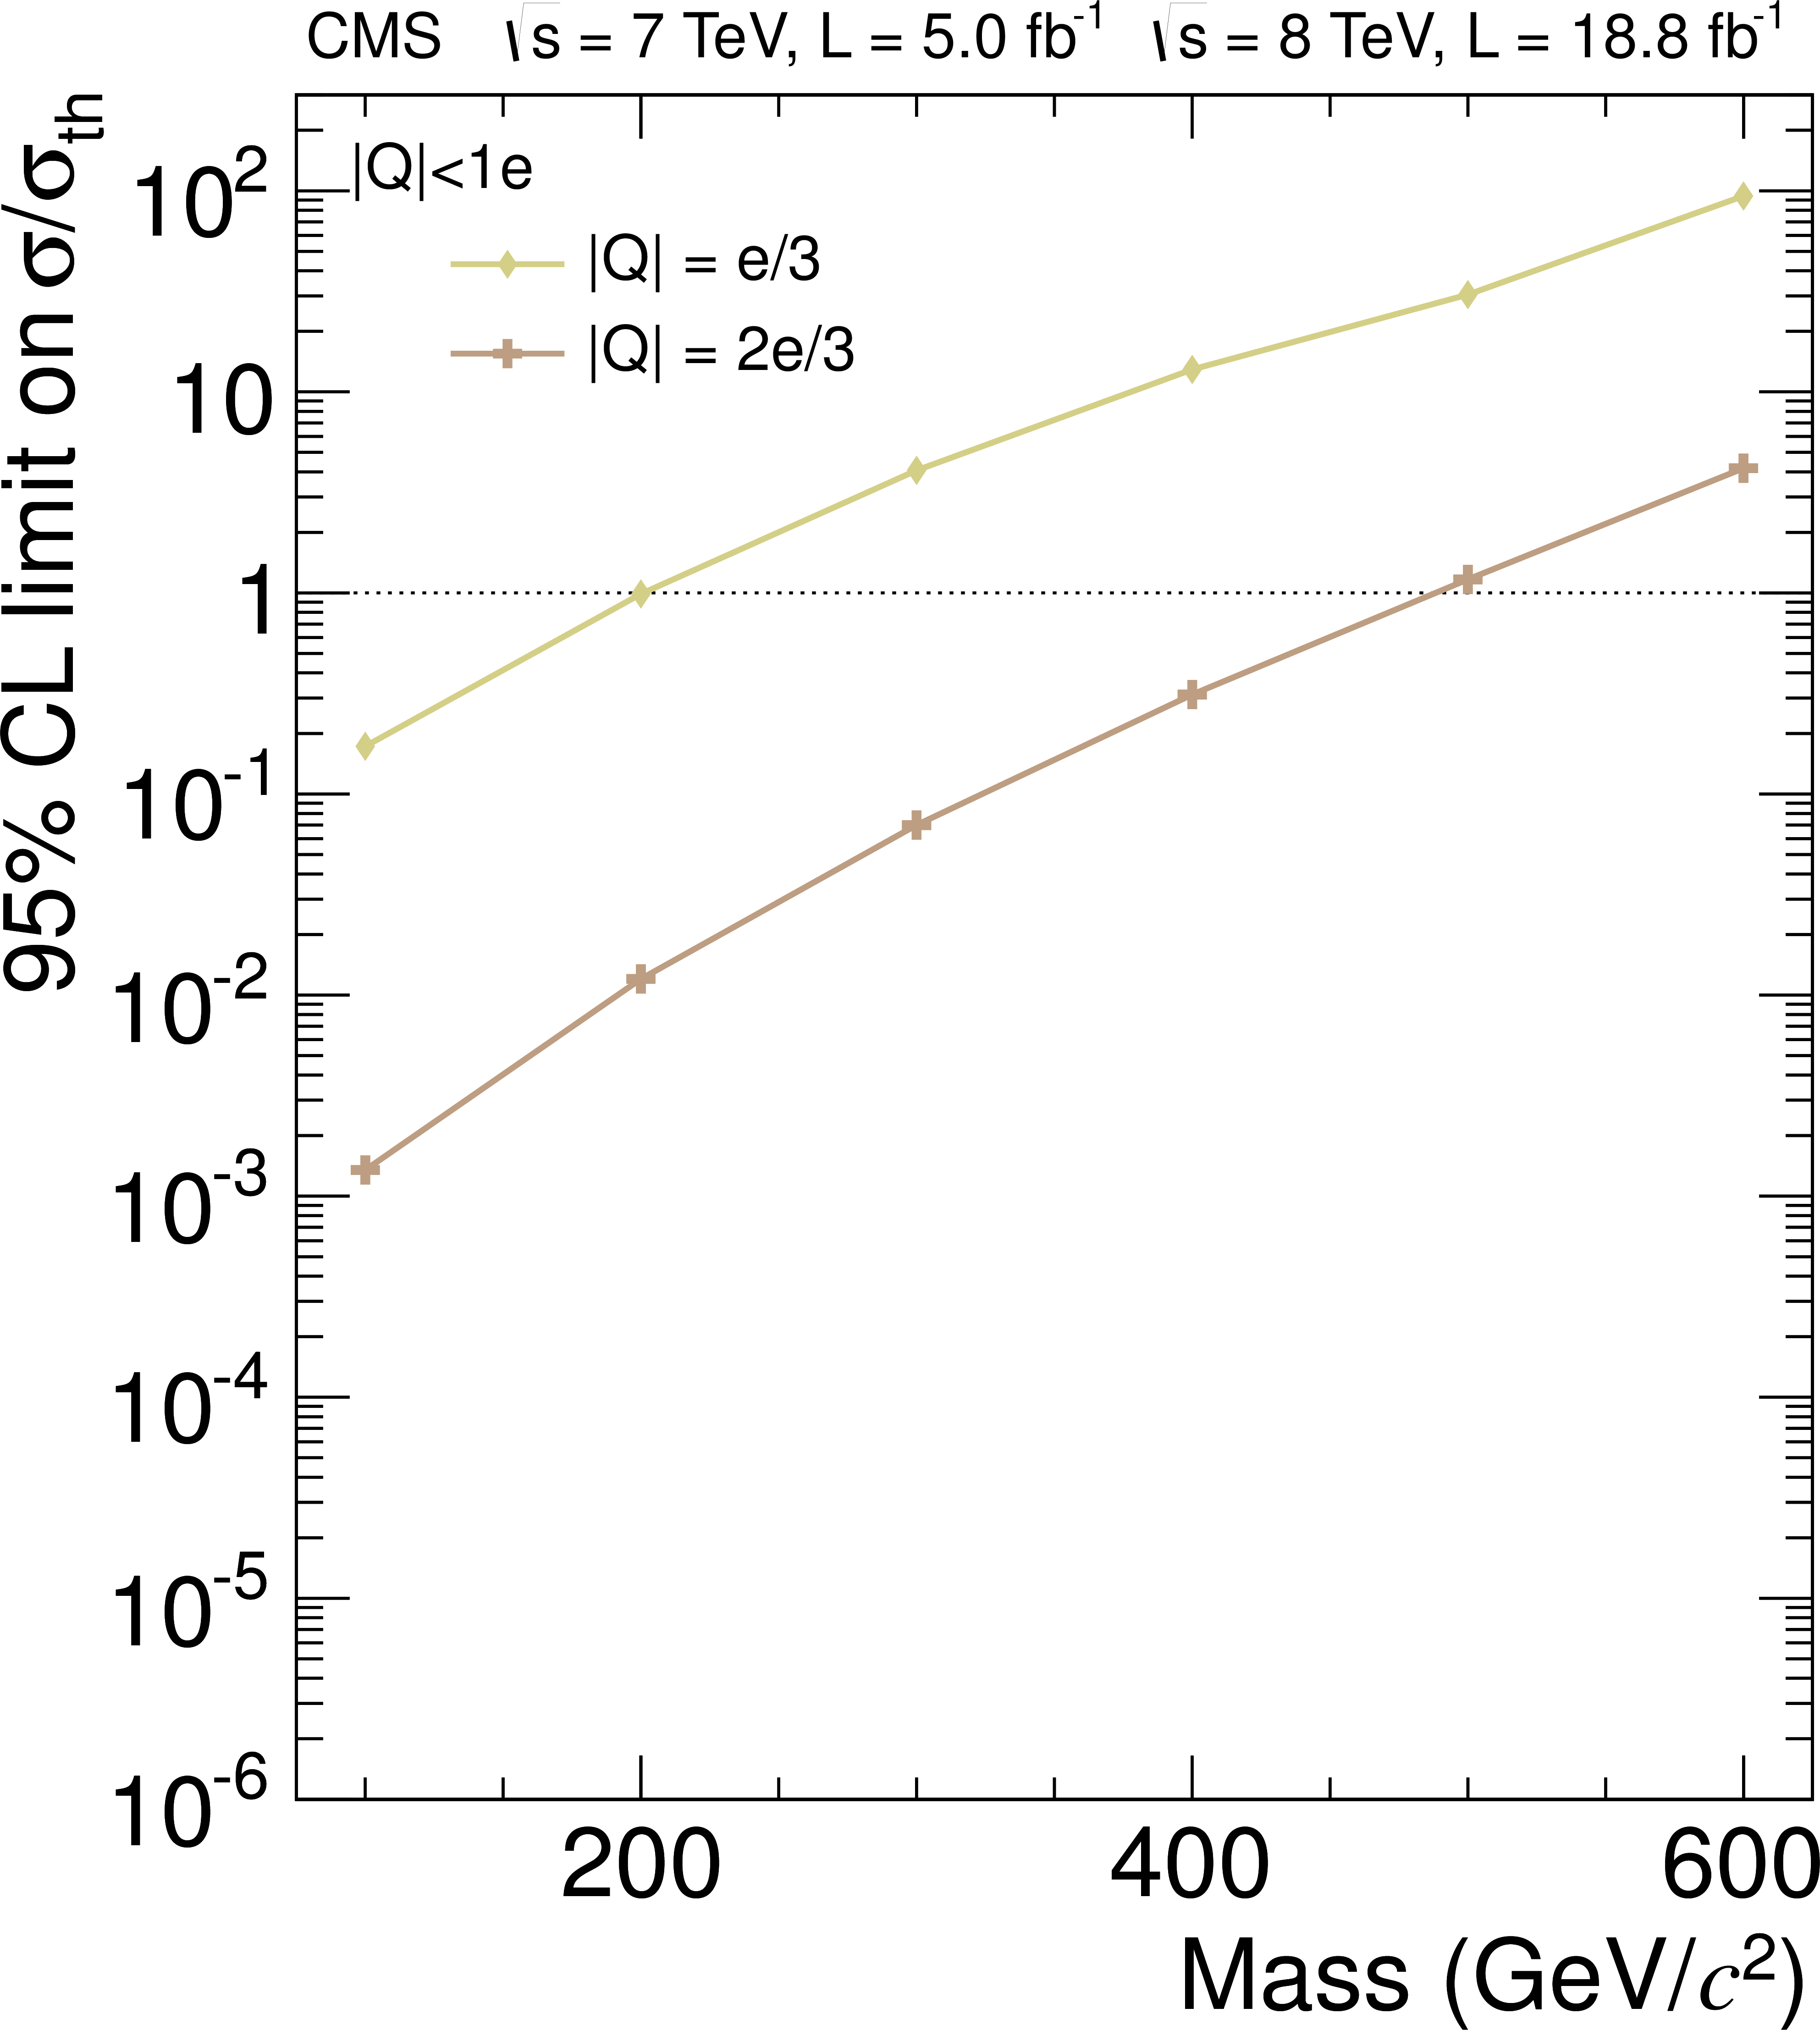
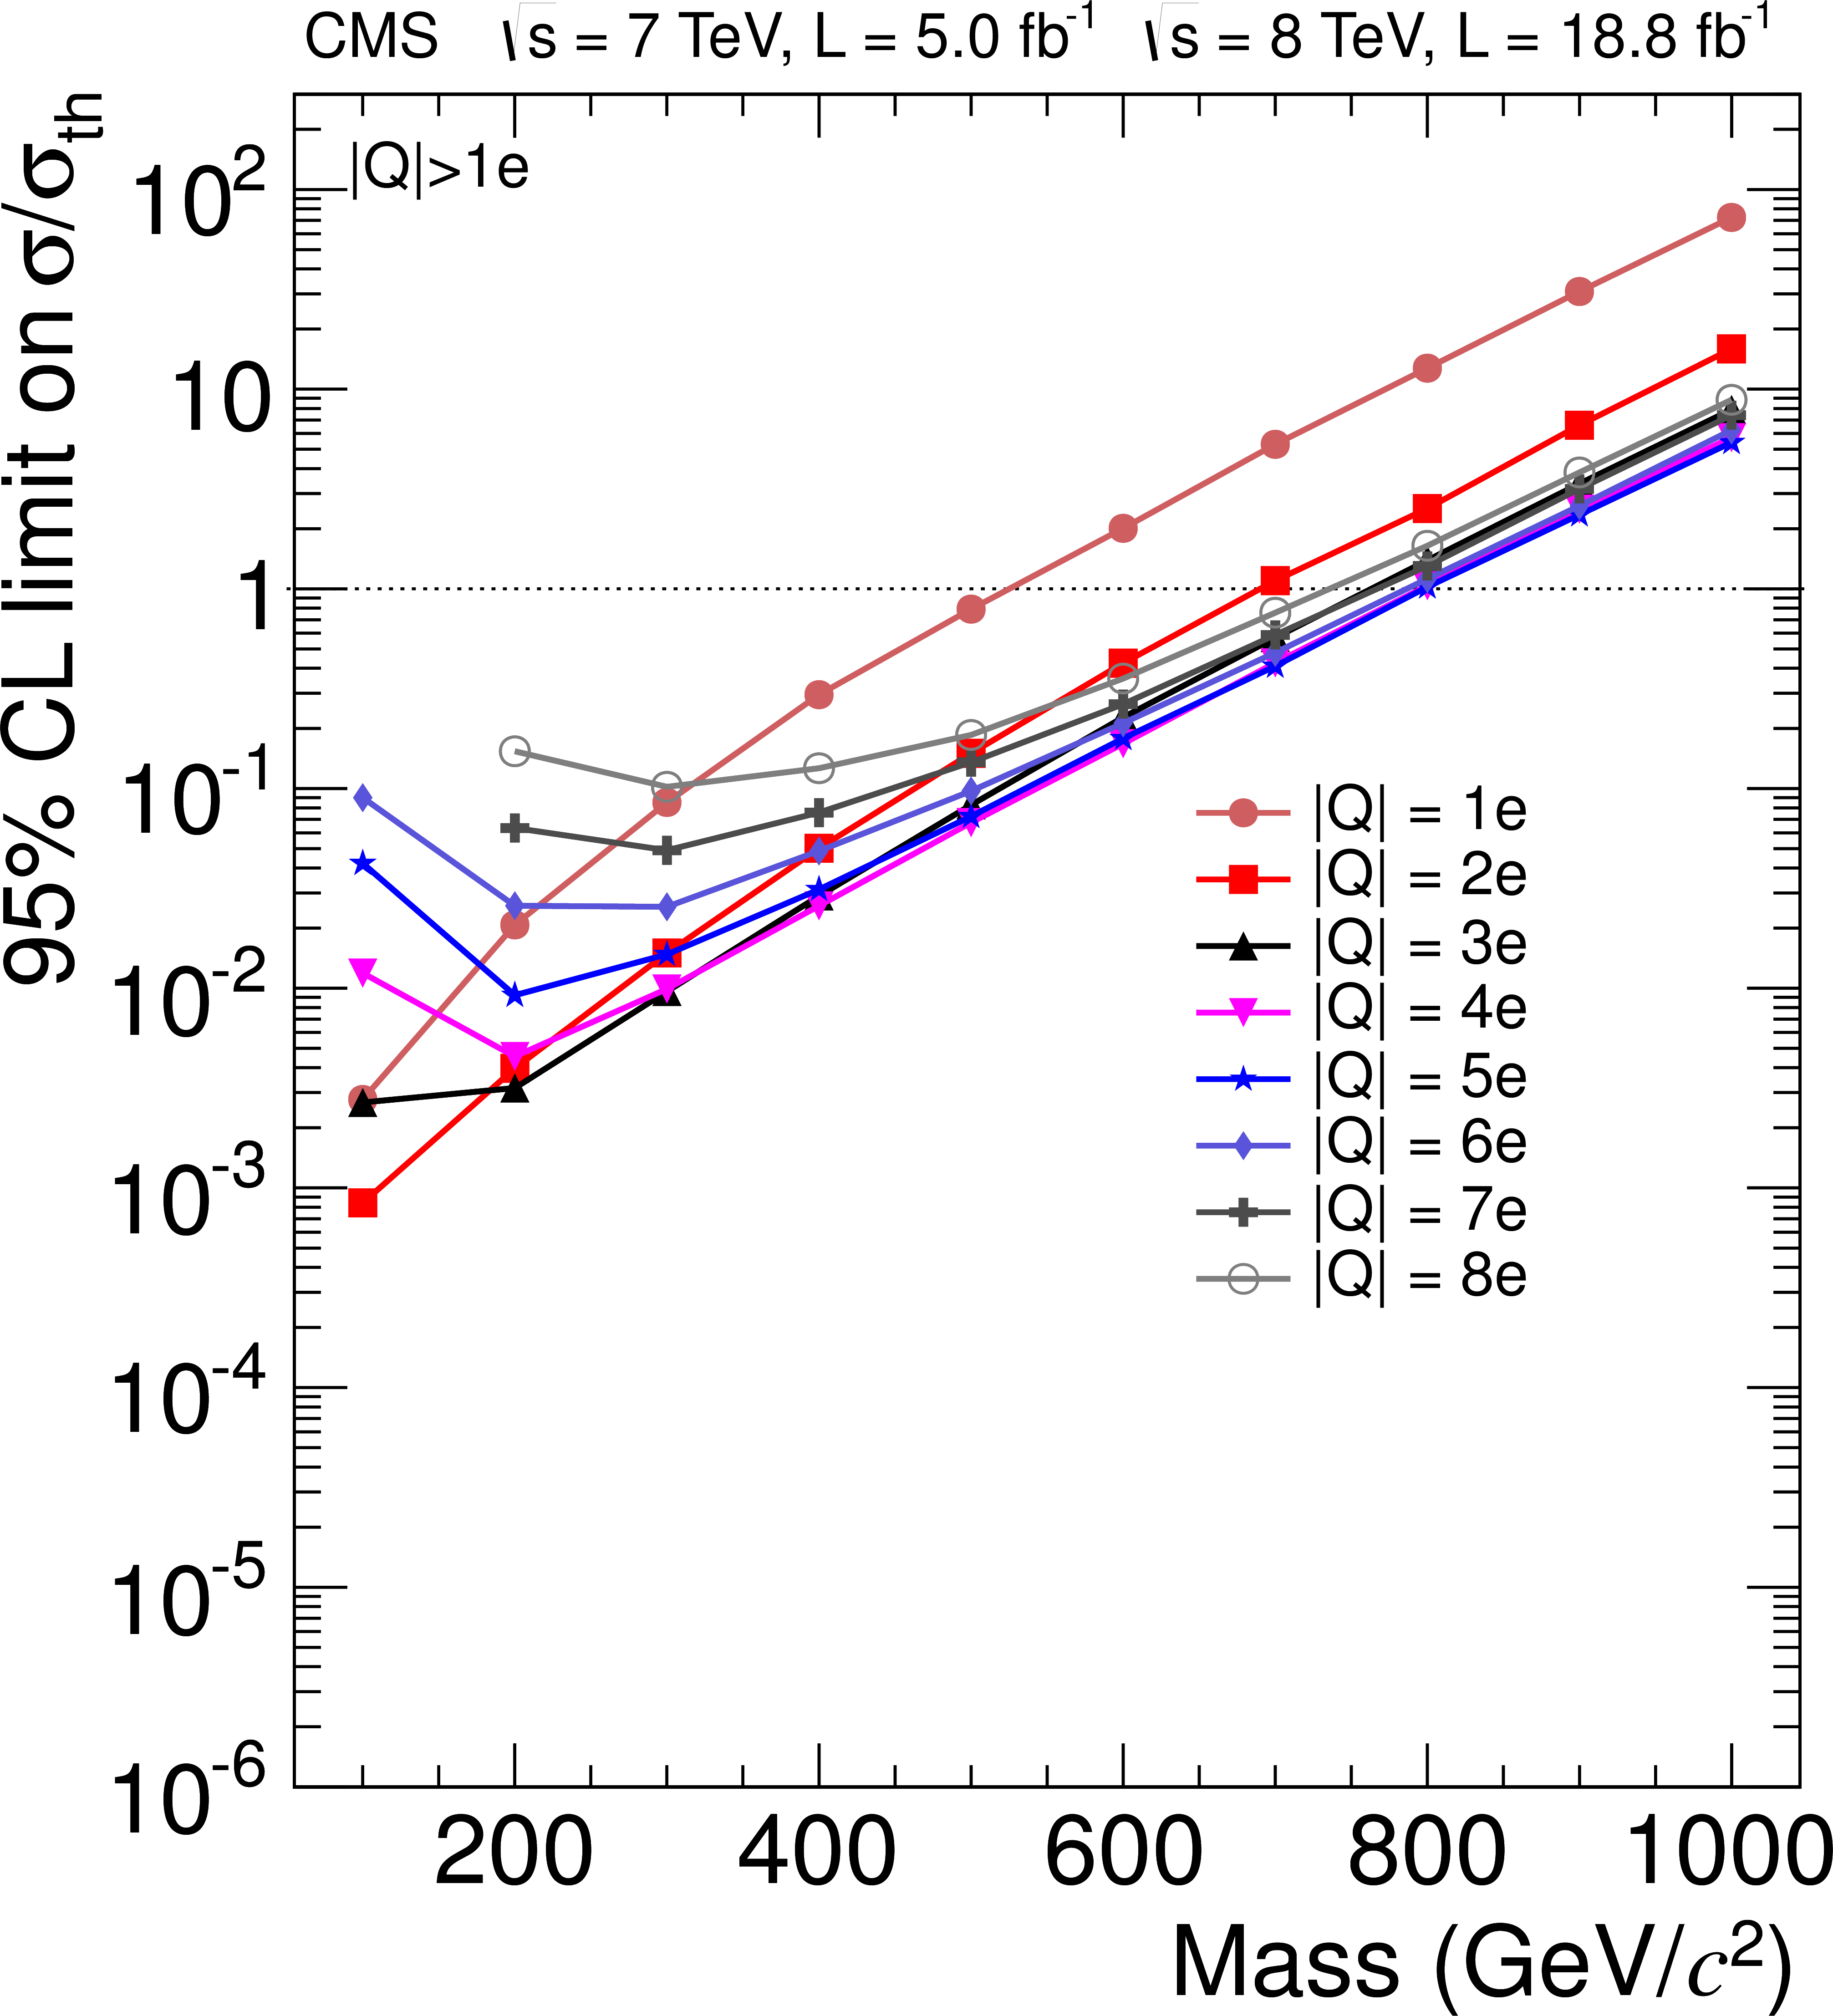
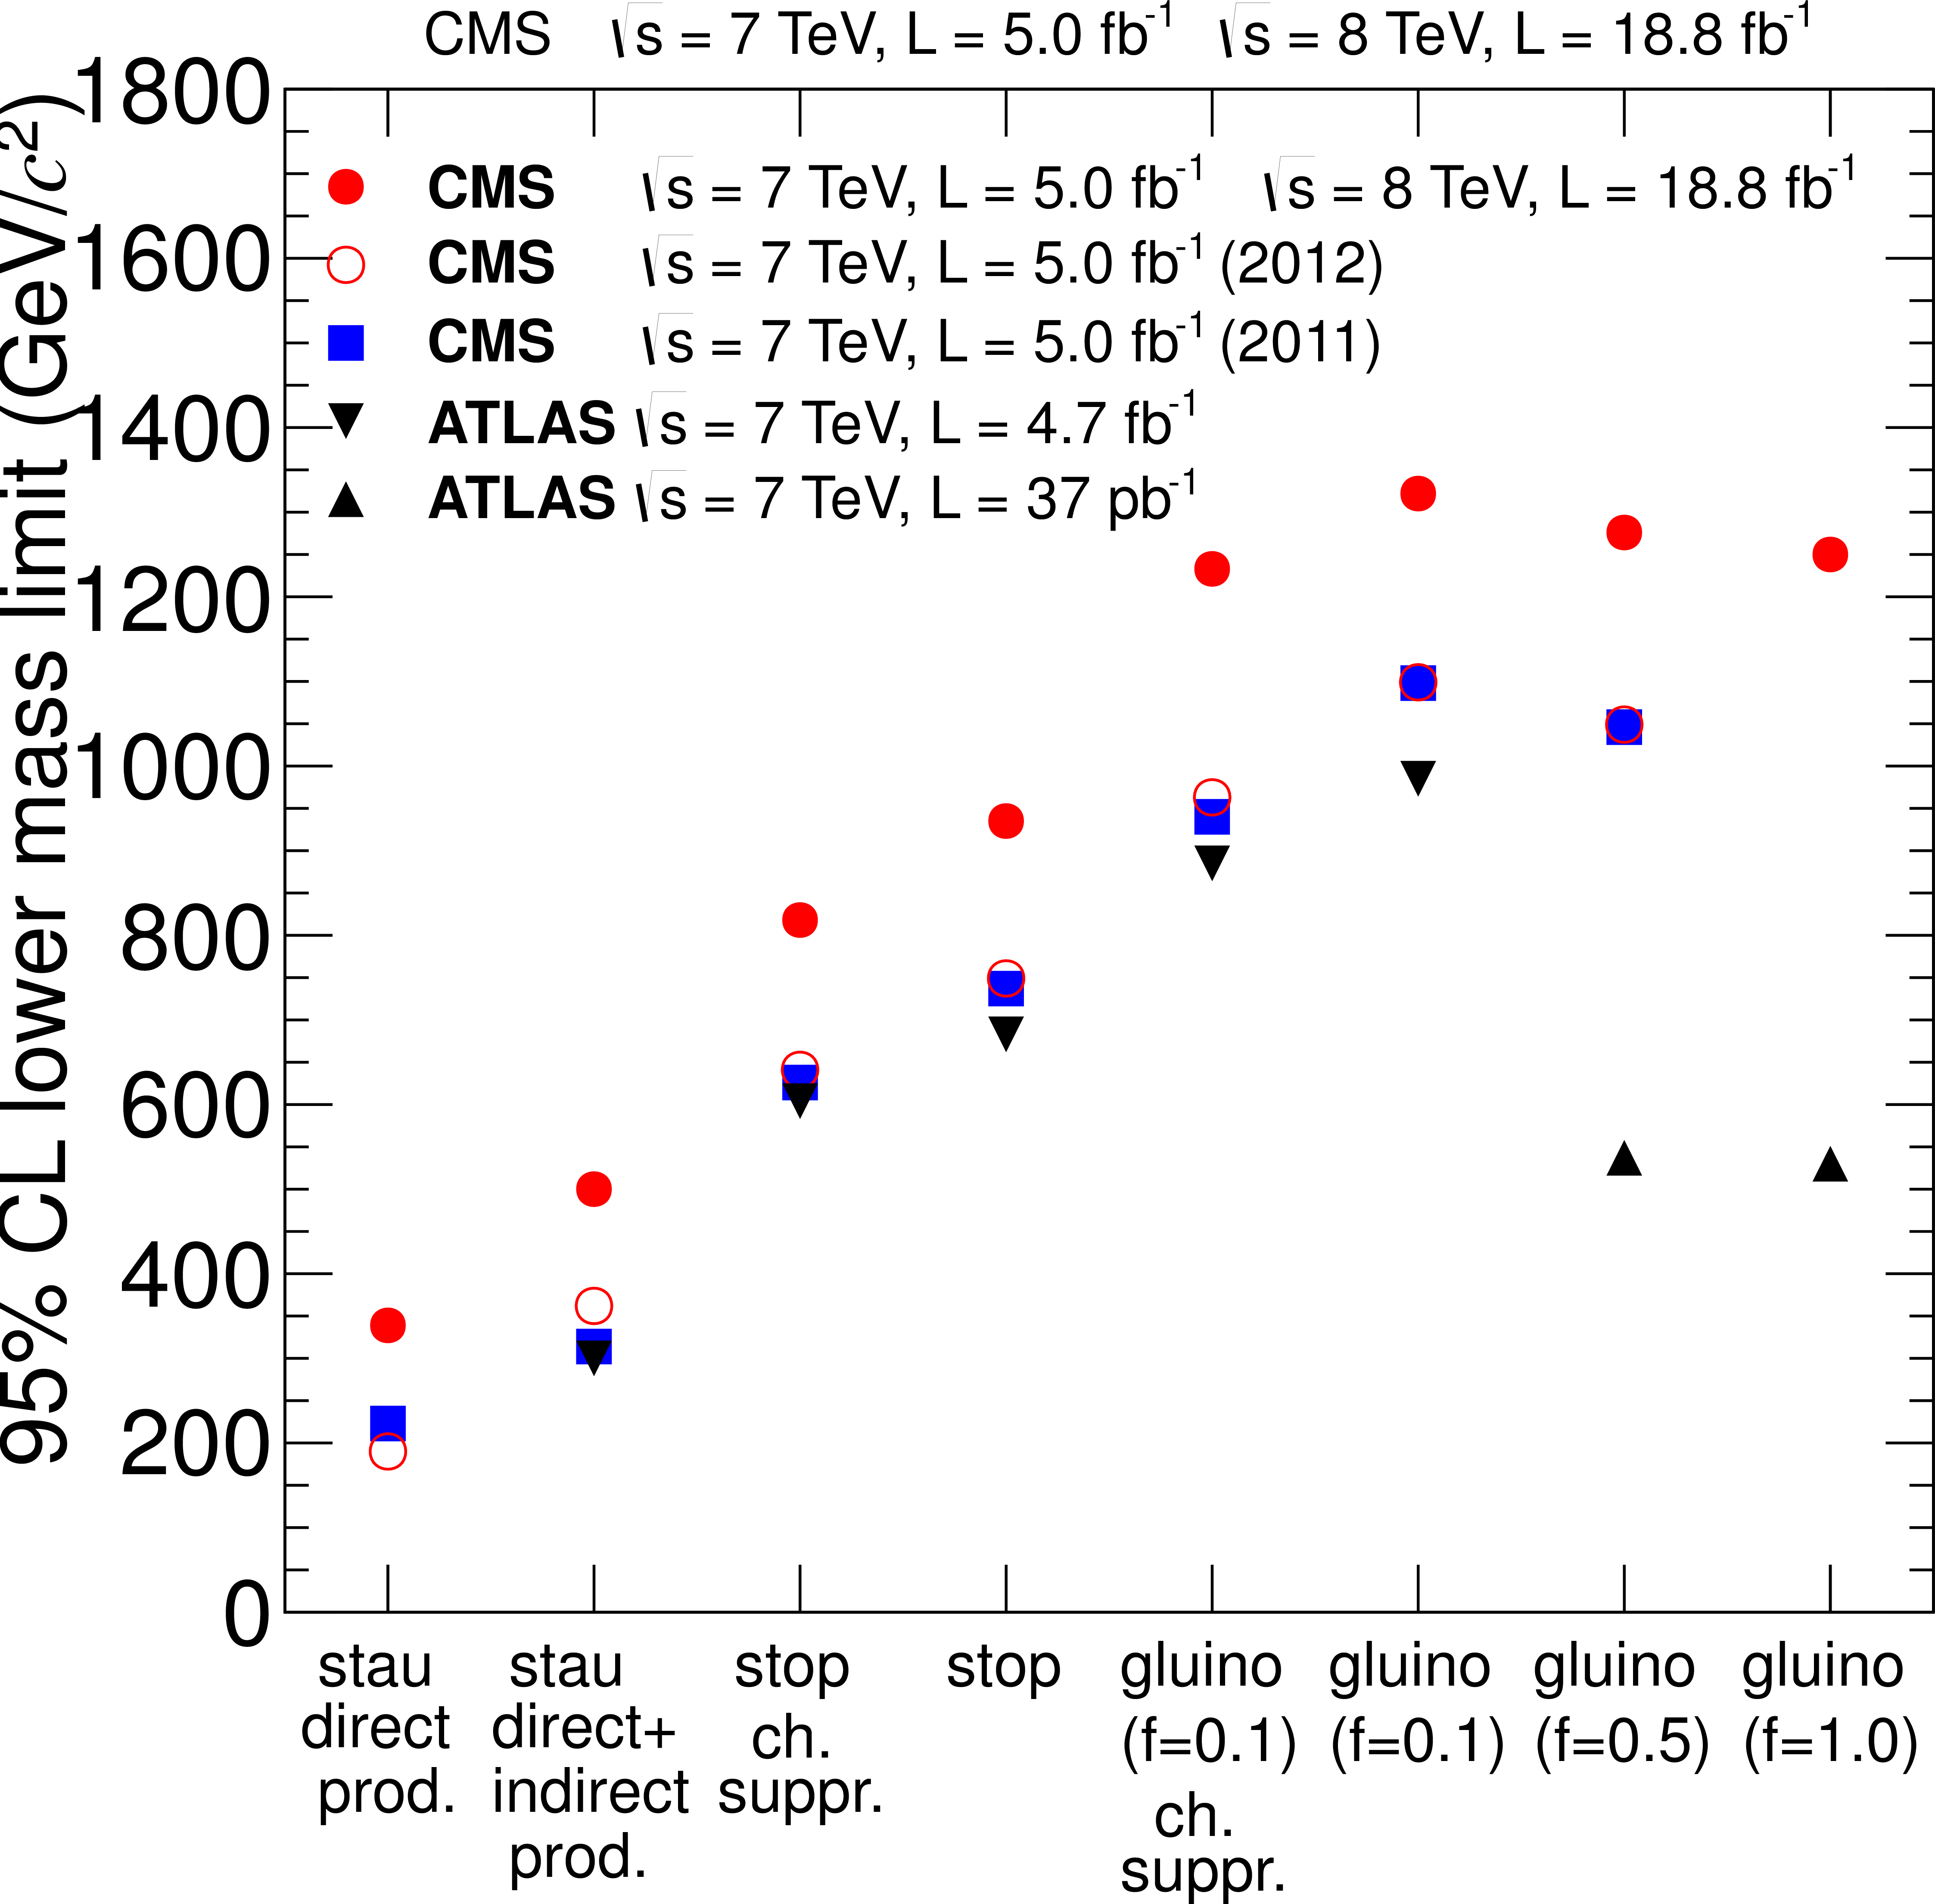
Figure 11-a:
Lower mass limits at 95% CL for various models compared with previously published results. The model type is given on the x-axis (a). Mass limits are shown for Drell--Yan like production of fractionally, singly, and multiply charged particles (b). These particles were assumed to be neutral under $SU(3)_C$ and $SU(2)_L$. |

png pdf |
Figure 11-b:
Lower mass limits at 95% CL for various models compared with previously published results. The model type is given on the x-axis (a). Mass limits are shown for Drell--Yan like production of fractionally, singly, and multiply charged particles (b). These particles were assumed to be neutral under $SU(3)_C$ and $SU(2)_L$. |
|
|
Compact Muon Solenoid LHC, CERN |
|

|

|

|

|

|