

Compact Muon Solenoid
LHC, CERN
| CMS-EXO-12-052 ; CERN-PH-EP-2014-293 | ||
| Search for pair-produced resonances decaying to jet pairs in proton-proton collisions at $\sqrt{s}$ = 8 TeV | ||
| CMS Collaboration | ||
| 24 December 2014 | ||
| Phys. Lett. B 747 (2015) 98 | ||
| Abstract: Results are reported of a general search for pair production of heavy resonances decaying to pairs of jets in events with at least four jets. The study is based on up to 19.4 fb$^{-1}$ of integrated luminosity from proton-proton collisions at a center-of-mass energy of 8 TeV, recorded with the CMS detector at the LHC. Limits are determined on the production of scalar top quarks (top squarks) in the framework of R-parity violating supersymmetry and on the production of color-octet vector bosons (colorons). First limits at the LHC are placed on top squark production for two scenarios. The first assumes decay to a bottom quark and a light-flavor quark and is excluded for masses between 200 and 385 GeV, and the second assumes decay to a pair of light-flavor quarks and is excluded for masses between 200 and 350 GeV at 95% confidence level. Previous limits on colorons decaying to light-flavor quarks are extended to exclude masses from 200 to 835 GeV. | ||
| Links: e-print arXiv:1412.7706 [hep-ex] (PDF) ; CDS record ; inSPIRE record ; Public twiki page ; CADI line (restricted) ; | ||
| Figures | |
png pdf |
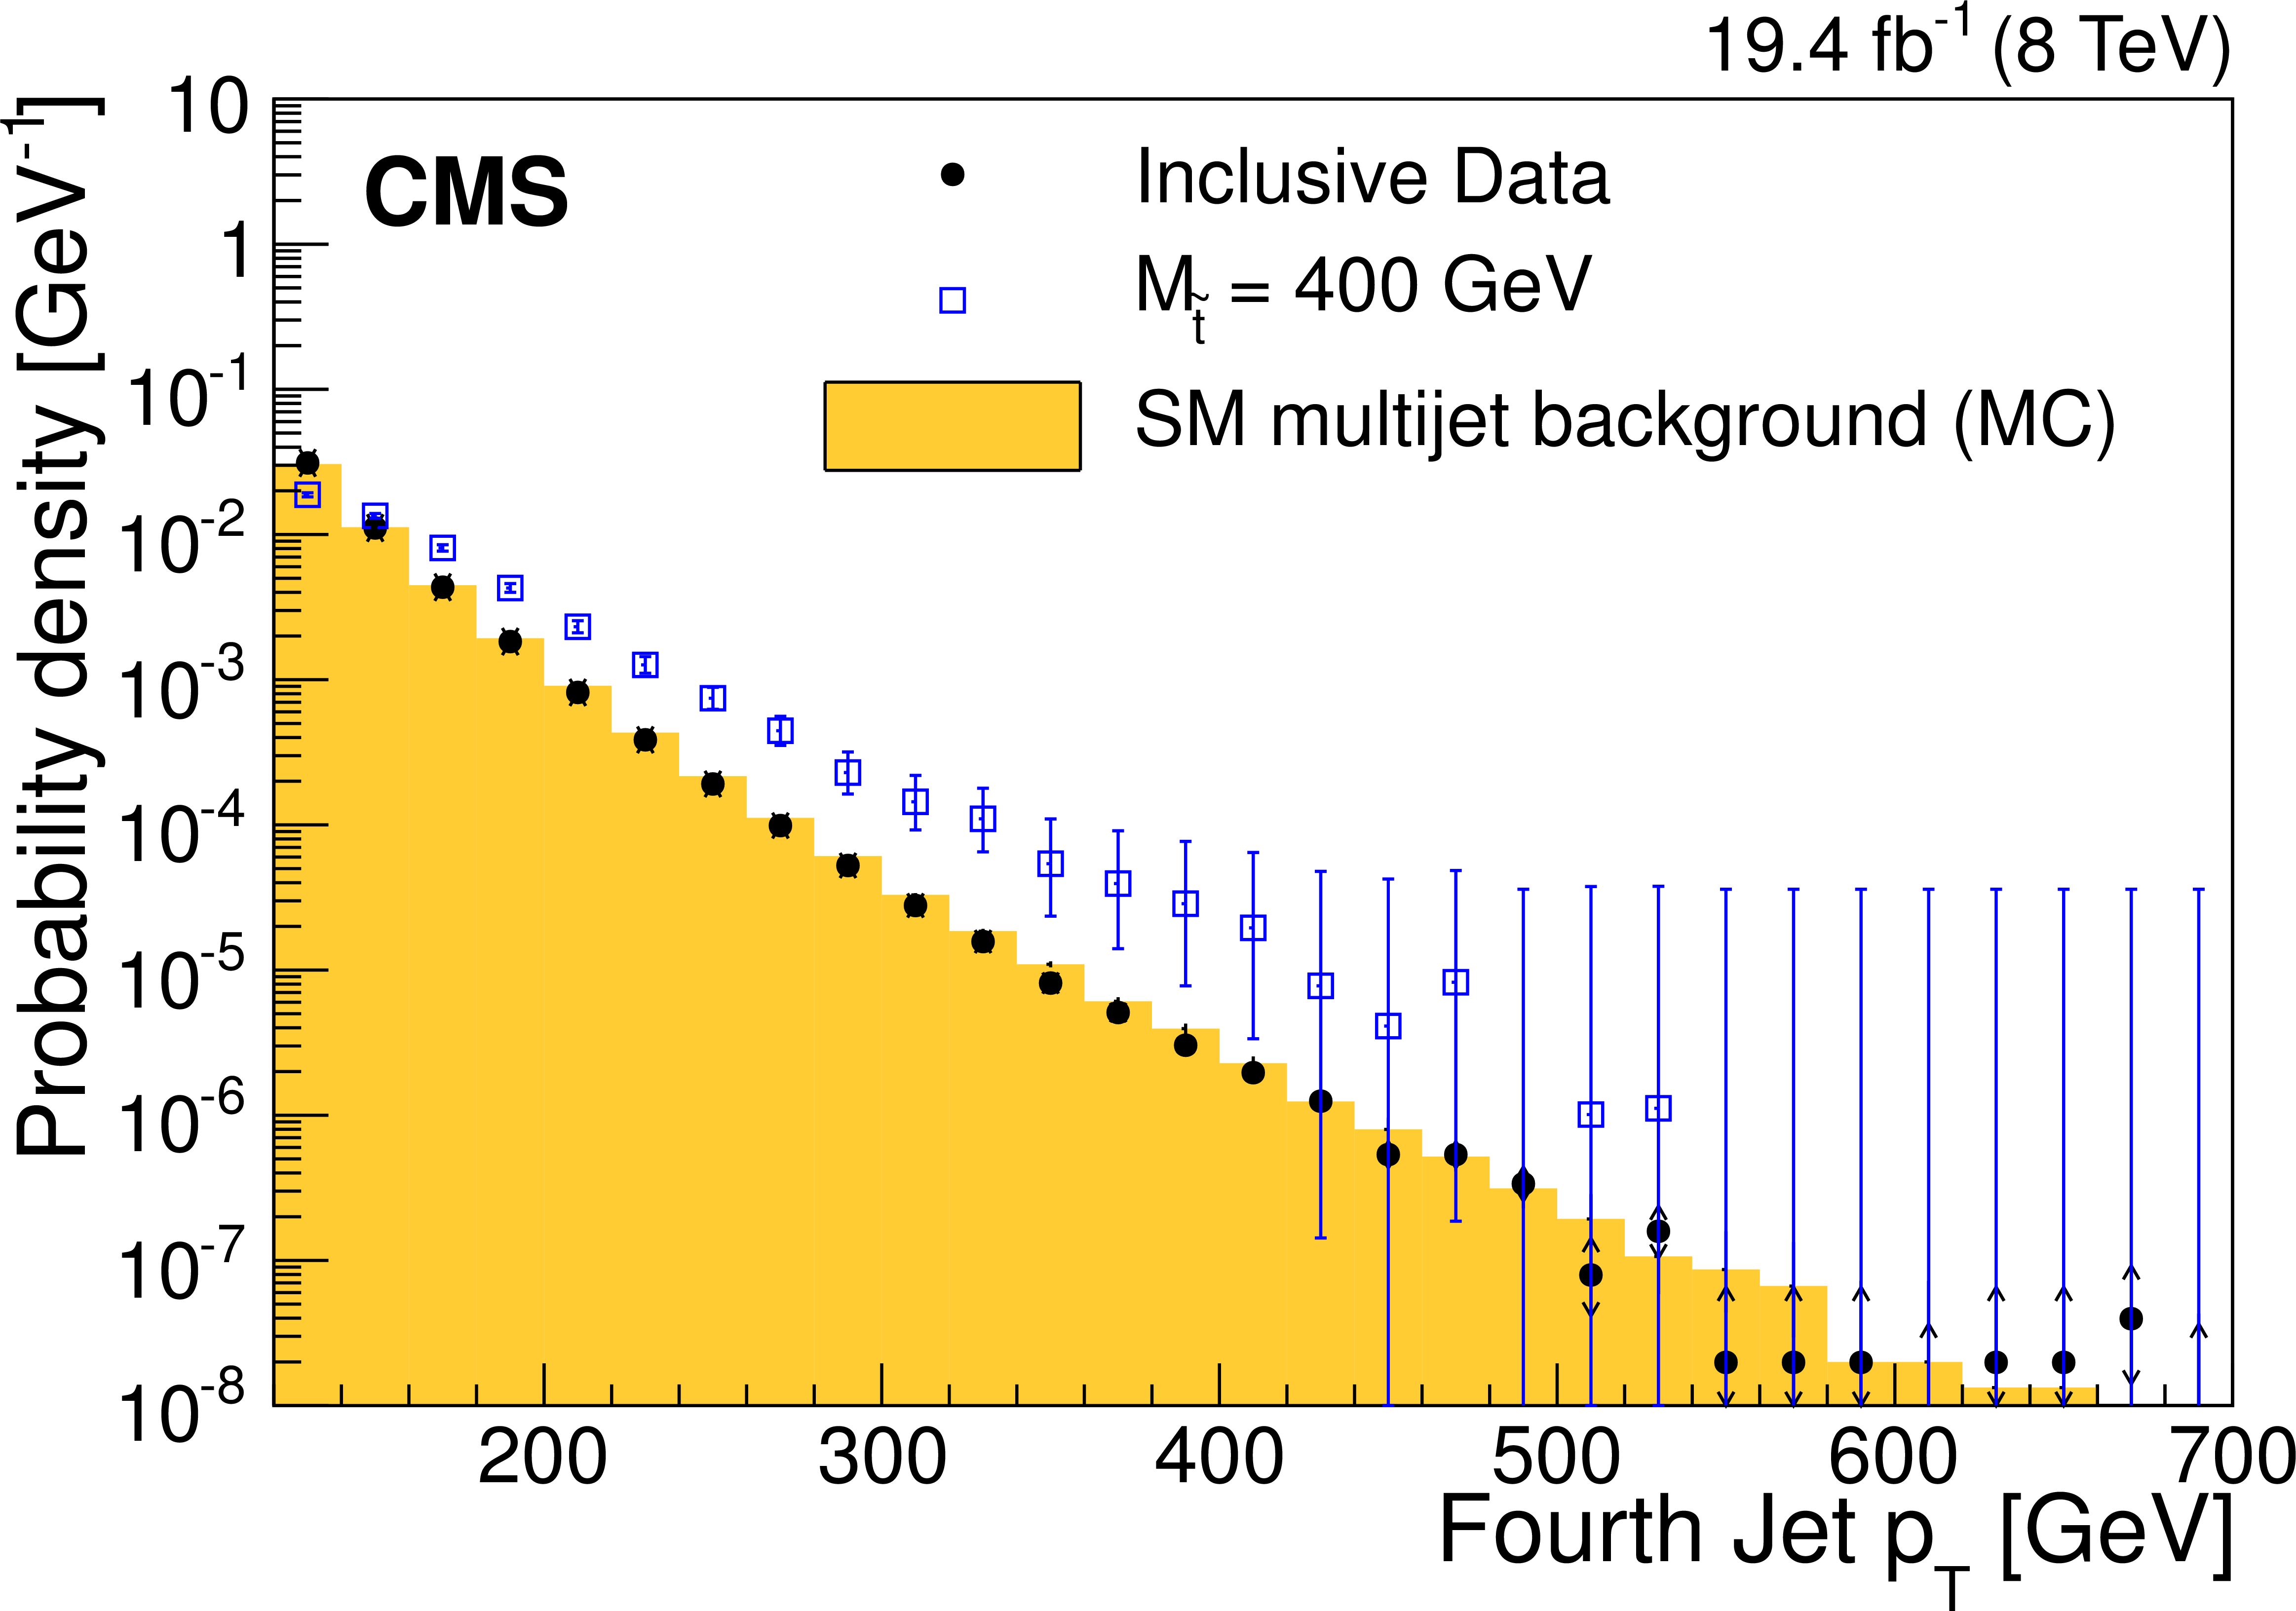
Figure 1-a:
Probability density distributions of the fourth highest jet $ {p_{\mathrm {T}}} $ (a) and $\Delta R_{\text {min}}$ (b) for events from data, the simulated SM multijet sample, and a 400 GeV top squark signal. Statistical uncertainties are shown for the top squark signal as vertical bars and for data as arrows. Events contain at least four jets, each with $ {p_{\mathrm {T}}} >$ 120 GeV and $ {| \eta | } < 2.5$, and all distributions have an area normalized to unity. |
png pdf |
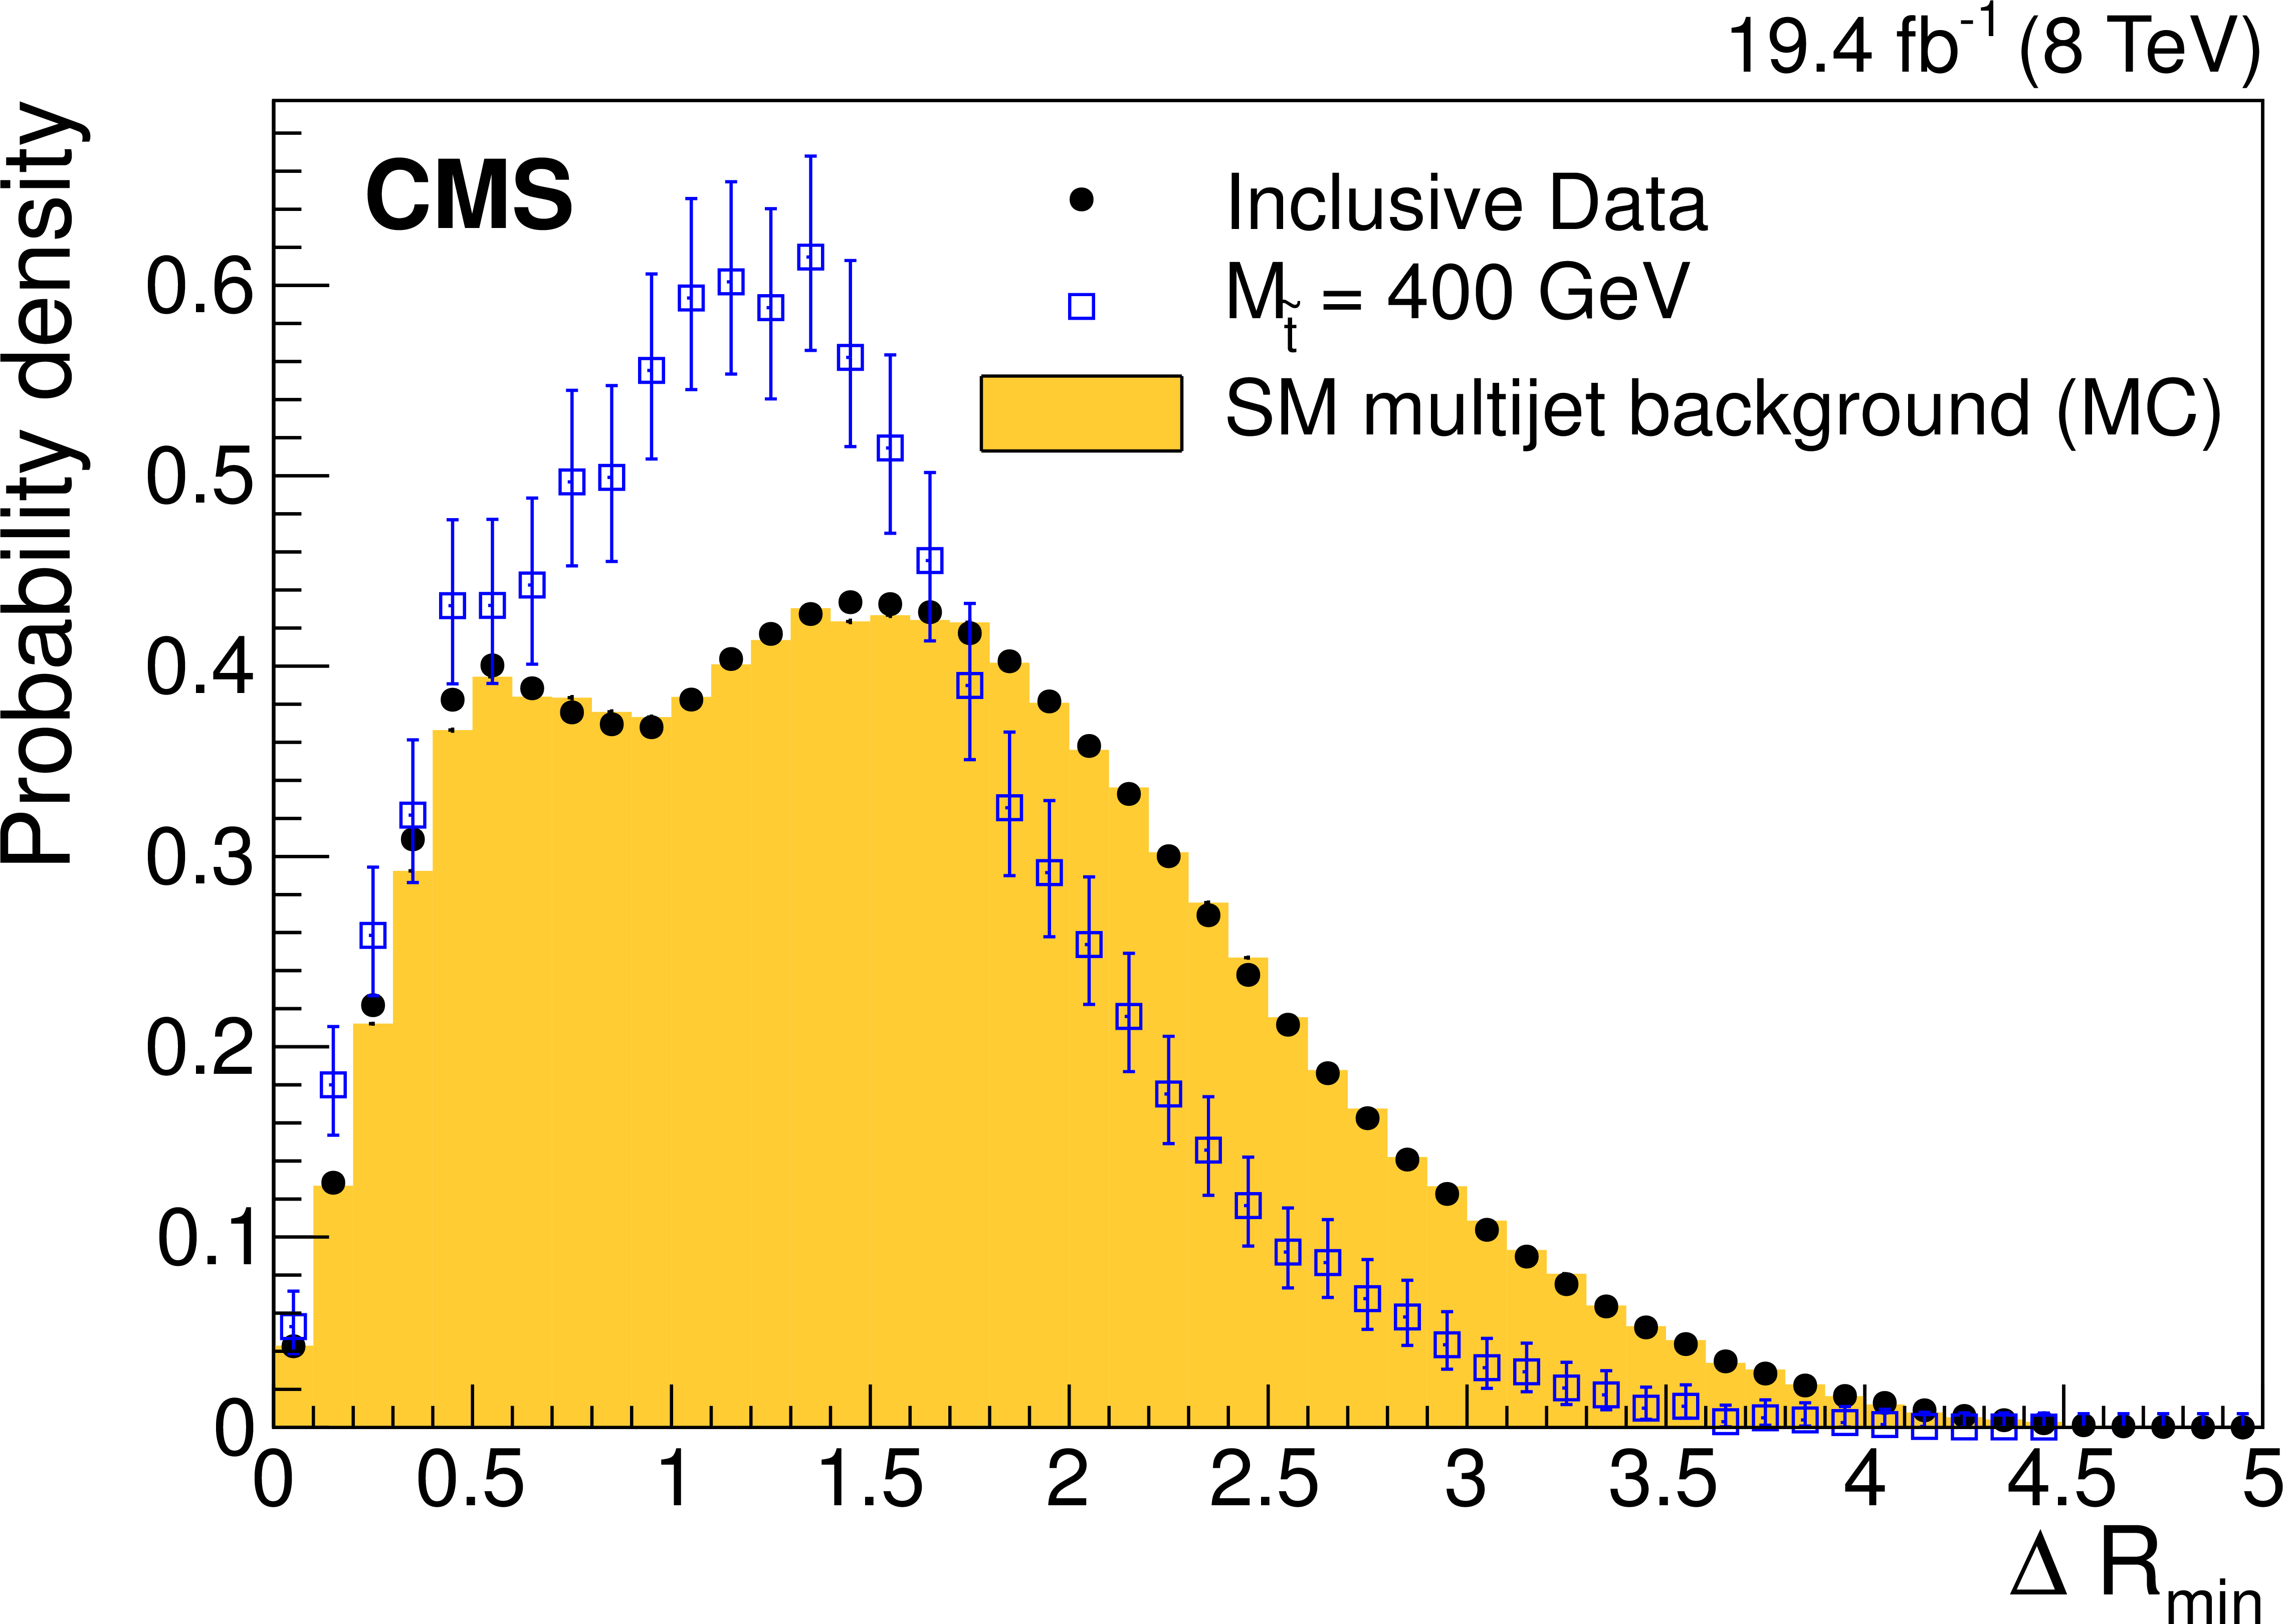
Figure 1-b:
Probability density distributions of the fourth highest jet $ {p_{\mathrm {T}}} $ (a) and $\Delta R_{\text {min}}$ (b) for events from data, the simulated SM multijet sample, and a 400 GeV top squark signal. Statistical uncertainties are shown for the top squark signal as vertical bars and for data as arrows. Events contain at least four jets, each with $ {p_{\mathrm {T}}} >$ 120 GeV and $ {| \eta | } < 2.5$, and all distributions have an area normalized to unity. |
png pdf |
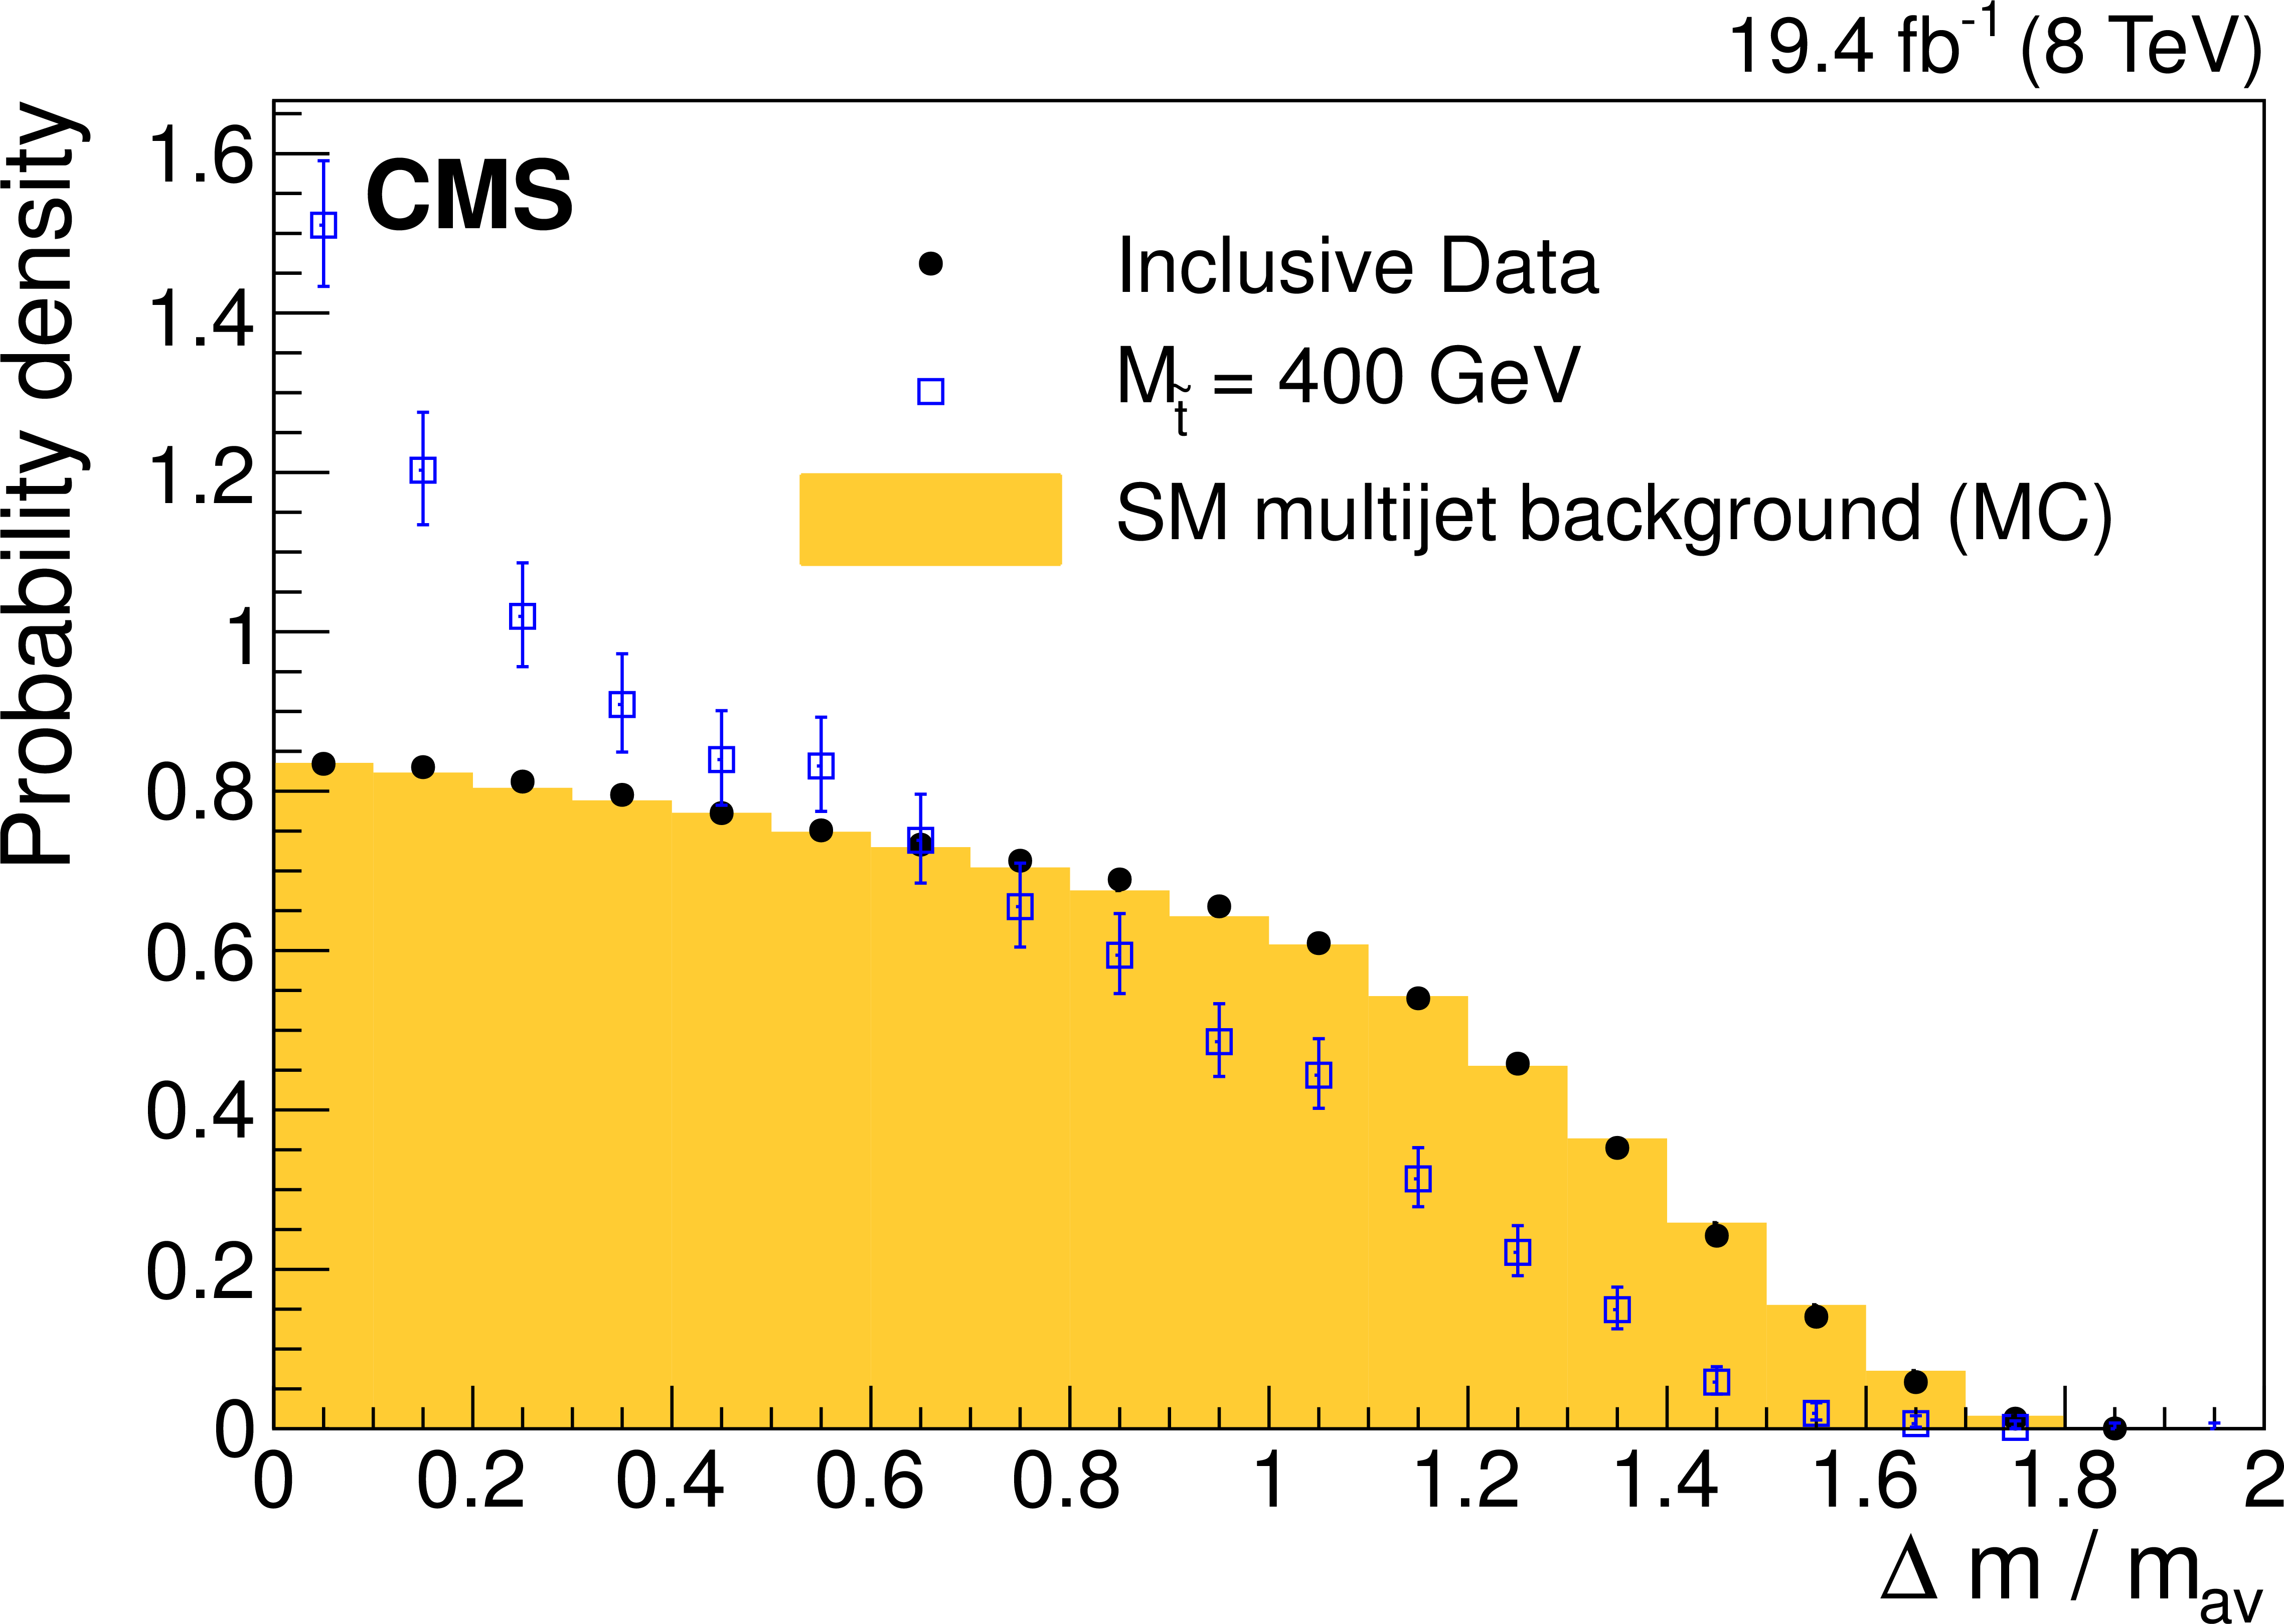
Figure 2-a:
Probability density distributions of $\Delta m/m_{\text {av}}$ (a) and $\Delta \eta _{\text {dijet}}$ (b) for events from data, the simulated SM multijet sample, and a 400 GeV top squark signal. Statistical uncertainties are shown for the top squark signal as vertical bars and for data as arrows. Events contain at least four jets, each with $ {p_{\mathrm {T}}} > $ 120 GeV and $ {| \eta | } < 2.5$, and all distributions have an area normalized to unity. |
png pdf |
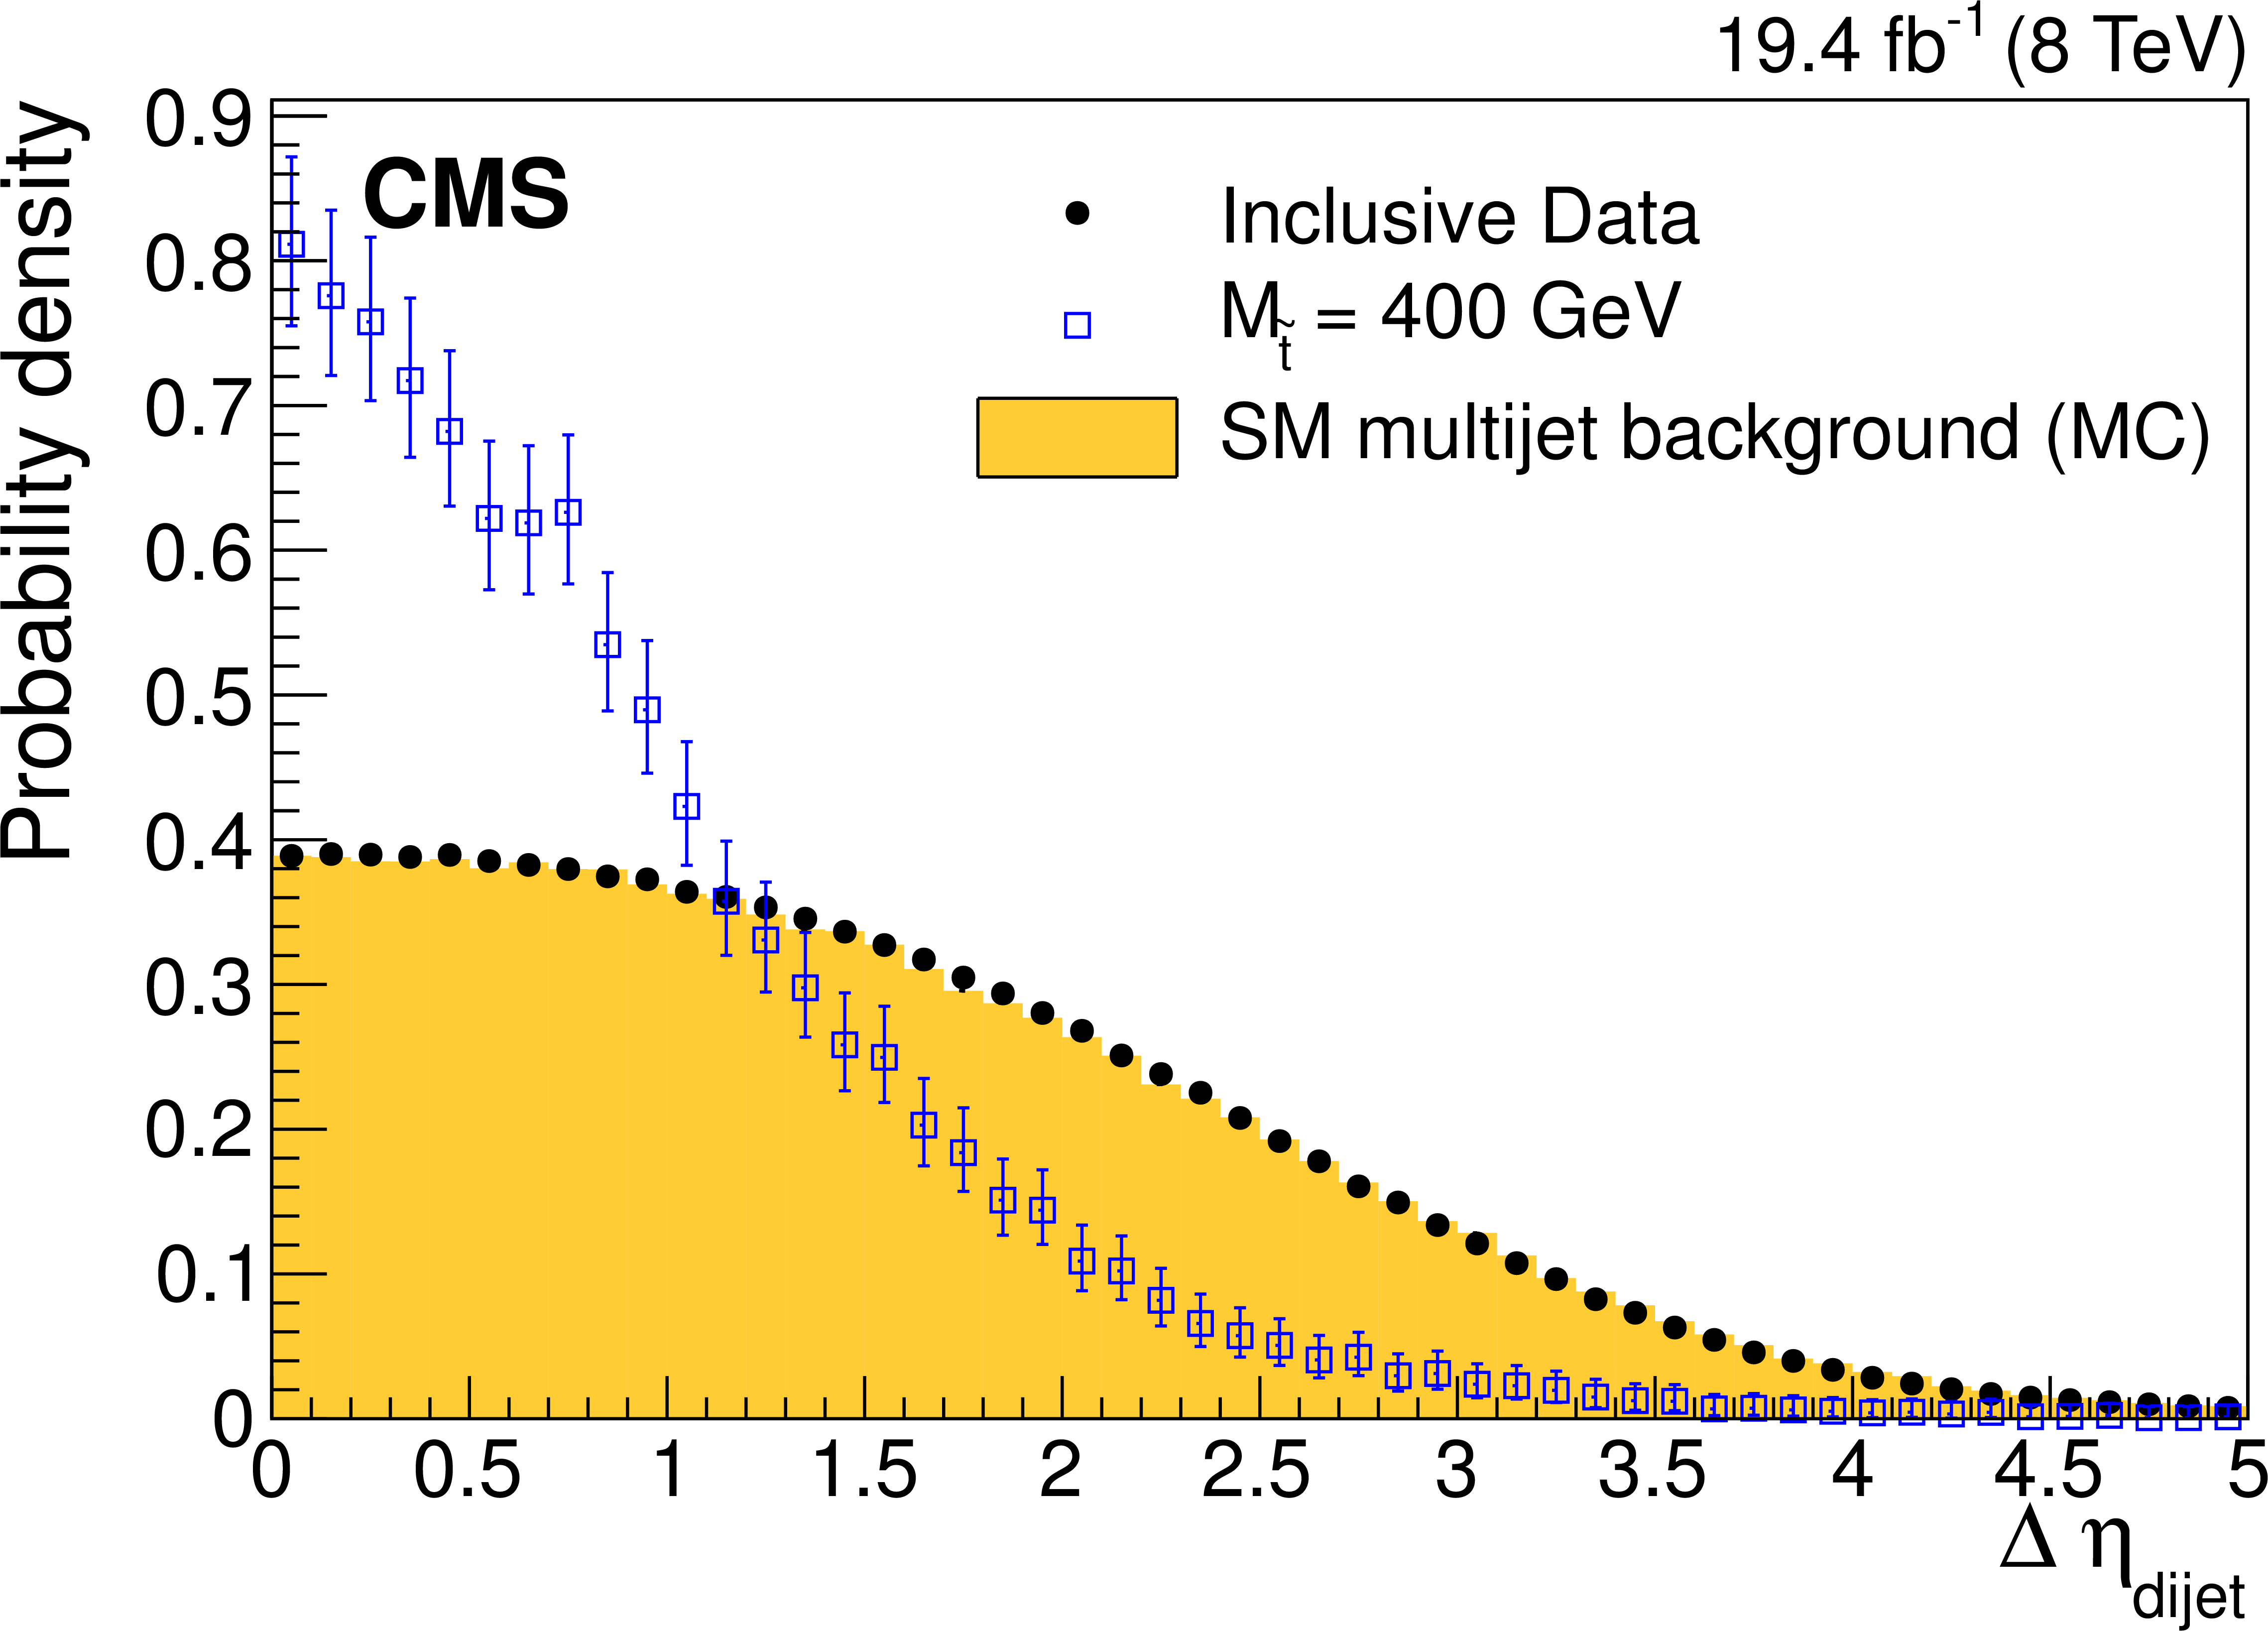
Figure 2-b:
Probability density distributions of $\Delta m/m_{\text {av}}$ (a) and $\Delta \eta _{\text {dijet}}$ (b) for events from data, the simulated SM multijet sample, and a 400 GeV top squark signal. Statistical uncertainties are shown for the top squark signal as vertical bars and for data as arrows. Events contain at least four jets, each with $ {p_{\mathrm {T}}} > $ 120 GeV and $ {| \eta | } < 2.5$, and all distributions have an area normalized to unity. |
png pdf |
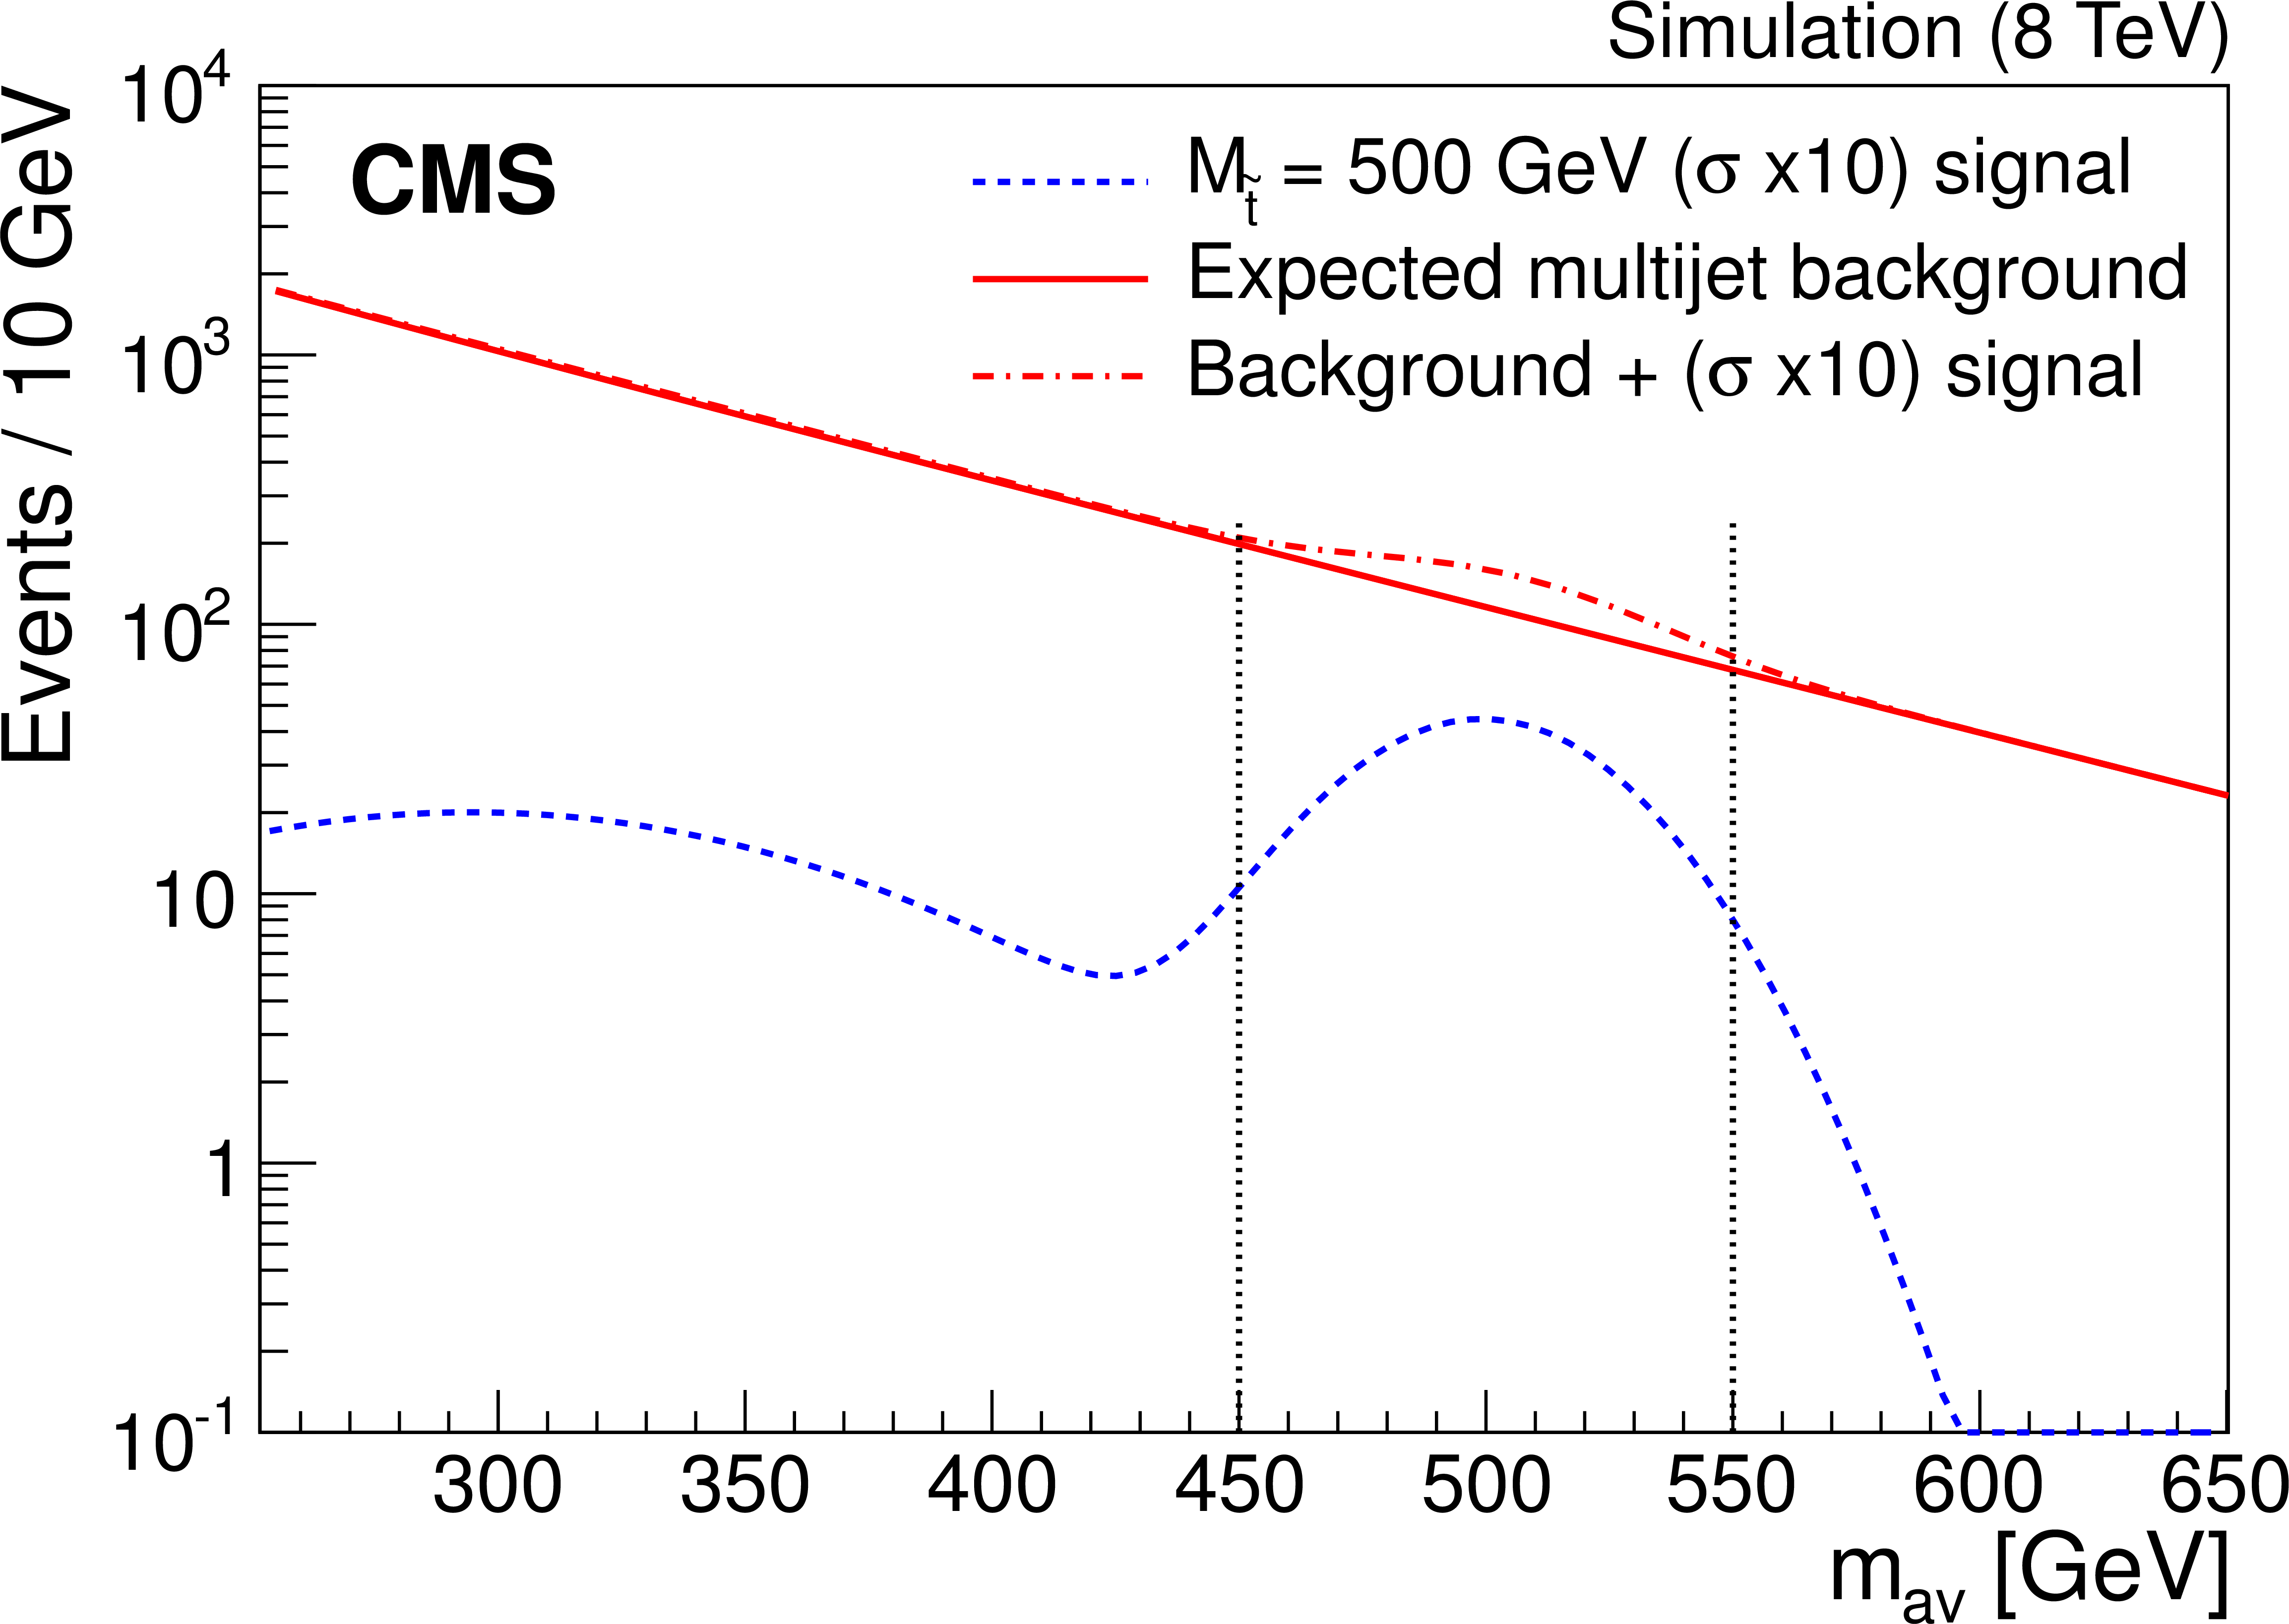
Figure 3:
Distributions of the fit to simulated background SM multijet events (solid red line) and a 500 GeV top squark (dashed blue line), normalized to a factor of ten times its cross section, are shown for the high-mass optimization scenario. The dotted vertical lines represent the integration window used by the optimization procedure. |

png pdf |
Figure 4-a:
The $\eta $ value for the higher-$ {p_{\mathrm {T}}} $ reconstructed dijet system versus that of the lower-$ {p_{\mathrm {T}}} $ dijet system in the selected pair. This distribution is shown for 400 GeV top squark (a) and simulated SM multijet samples (b), with the right hand scale indicating the expected number of events per bin. The diagonal lines indicate the optimized region of allowed $\Delta \eta _{\text {dijet}}$ values, and events with values falling between the two lines pass this requirement. |
png pdf |
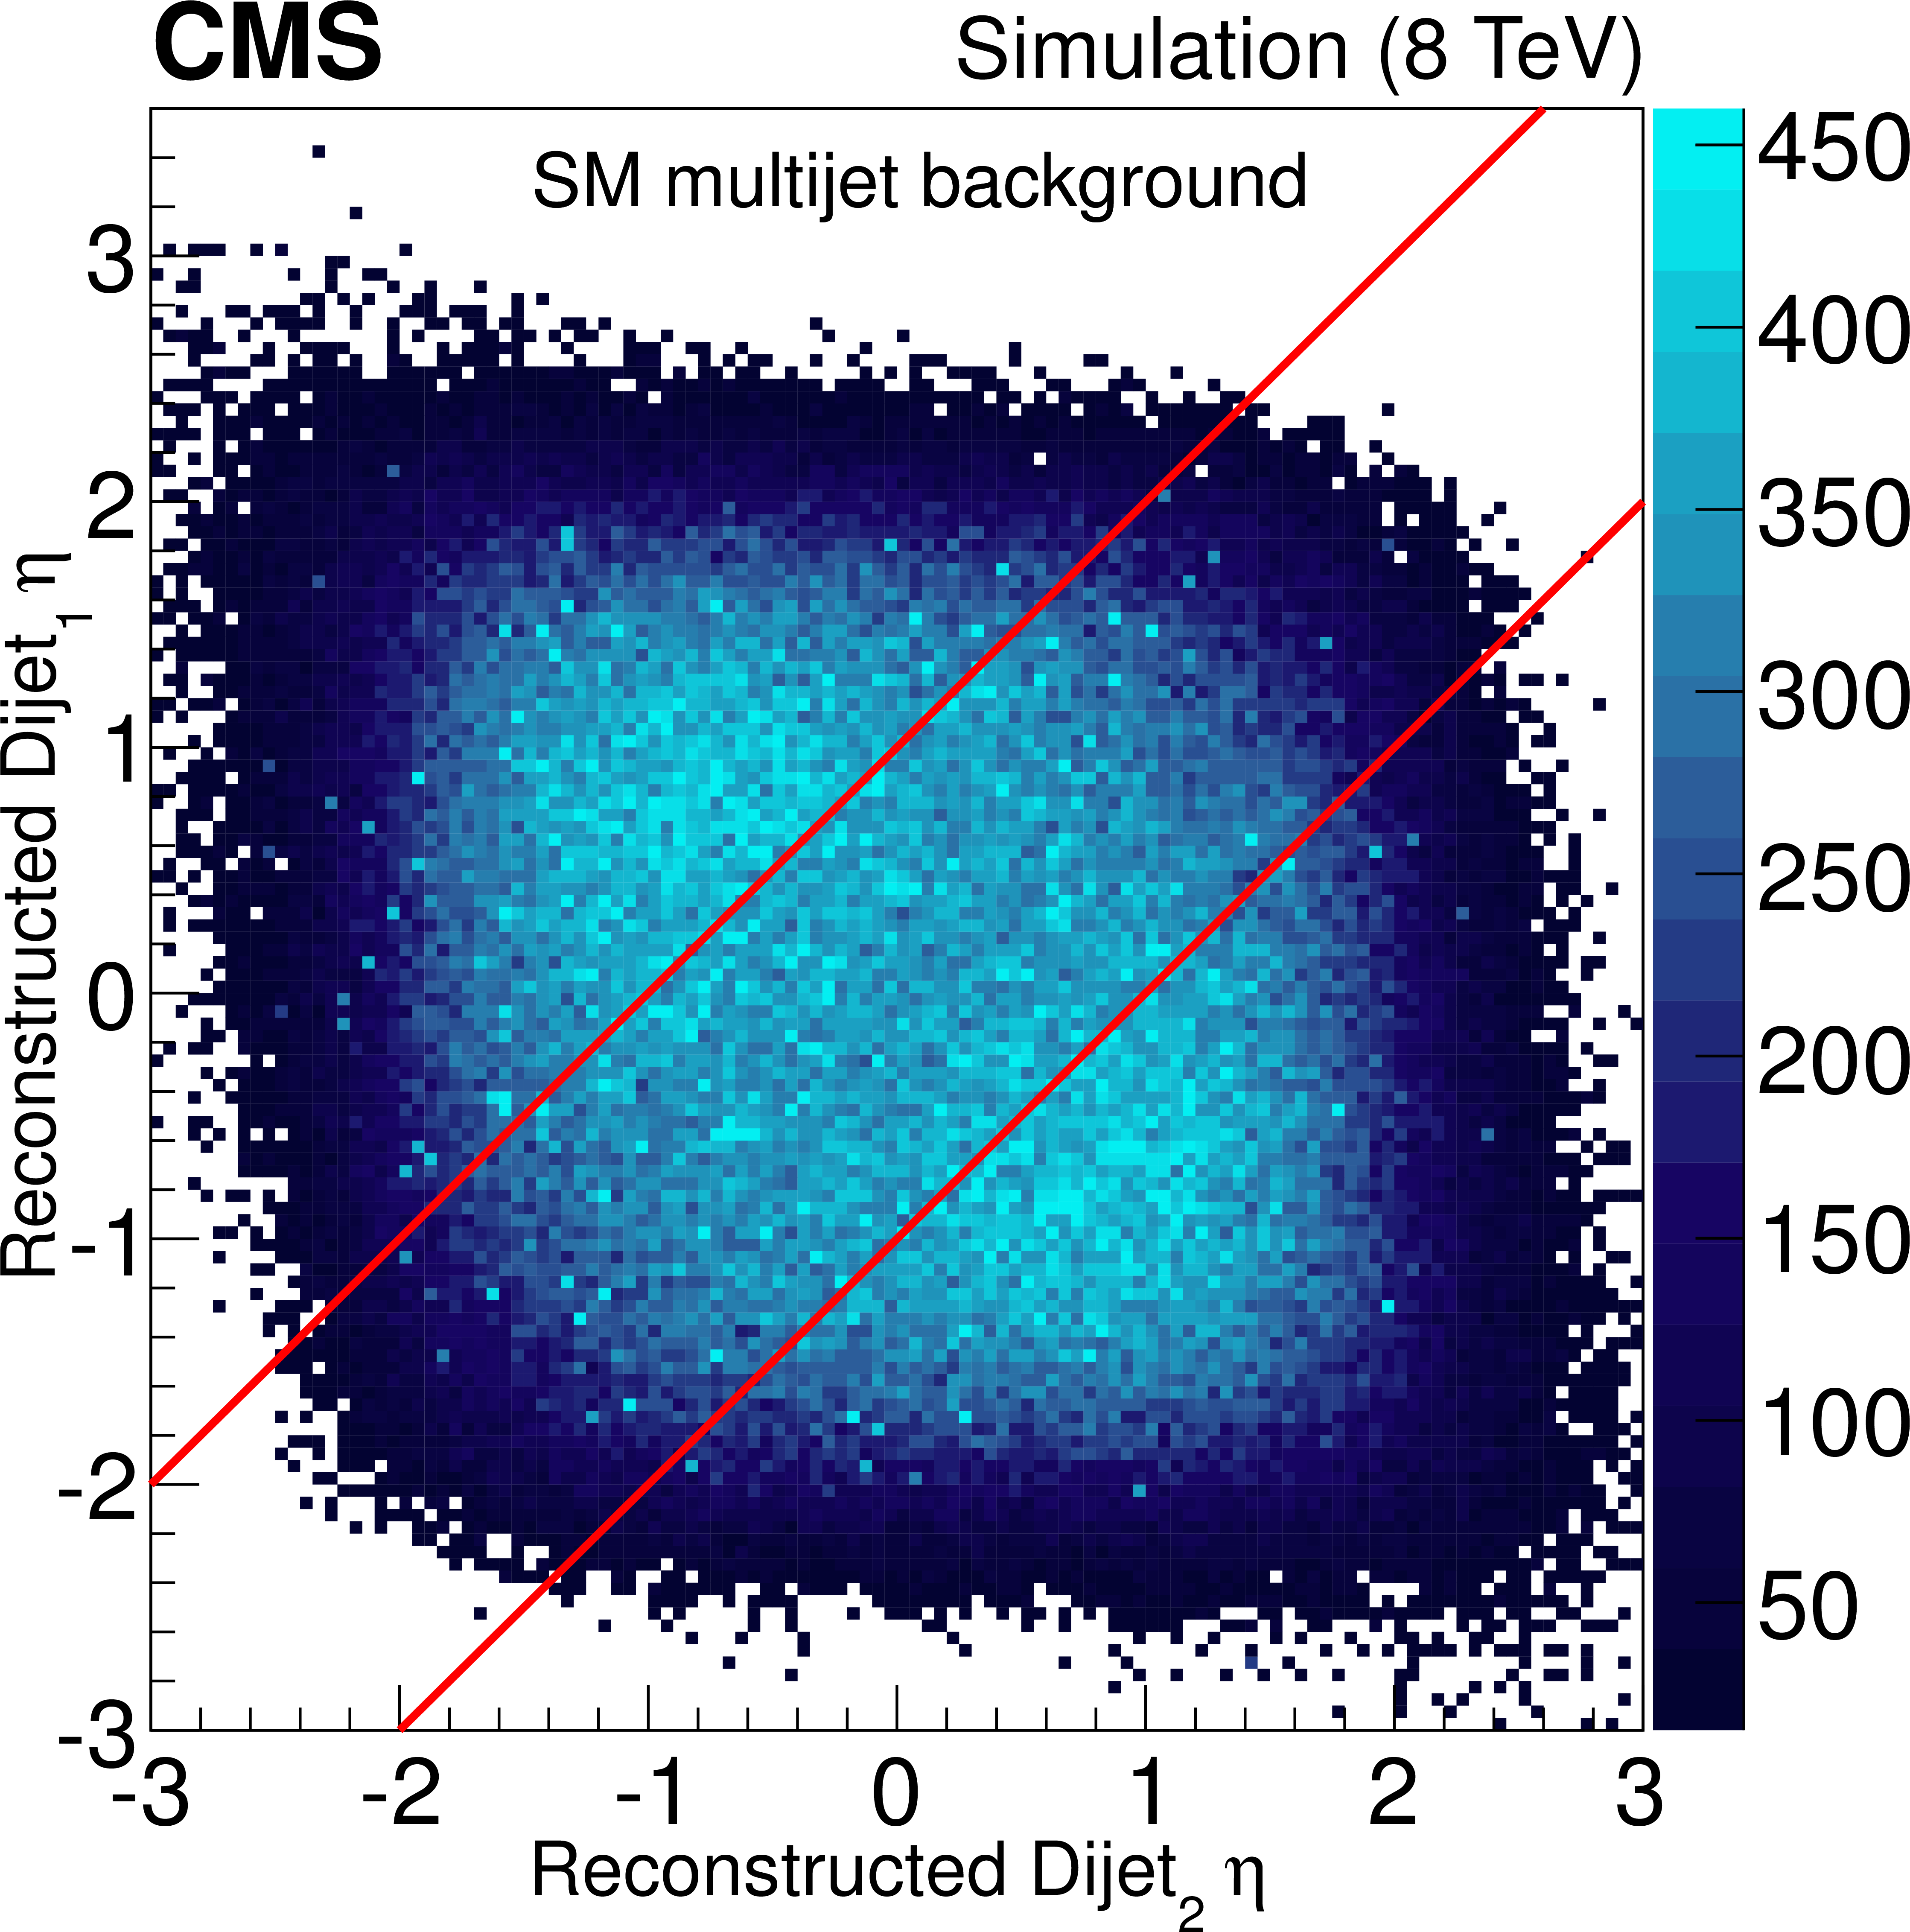
Figure 4-b:
The $\eta $ value for the higher-$ {p_{\mathrm {T}}} $ reconstructed dijet system versus that of the lower-$ {p_{\mathrm {T}}} $ dijet system in the selected pair. This distribution is shown for 400 GeV top squark (a) and simulated SM multijet samples (b), with the right hand scale indicating the expected number of events per bin. The diagonal lines indicate the optimized region of allowed $\Delta \eta _{\text {dijet}}$ values, and events with values falling between the two lines pass this requirement. |
png pdf |
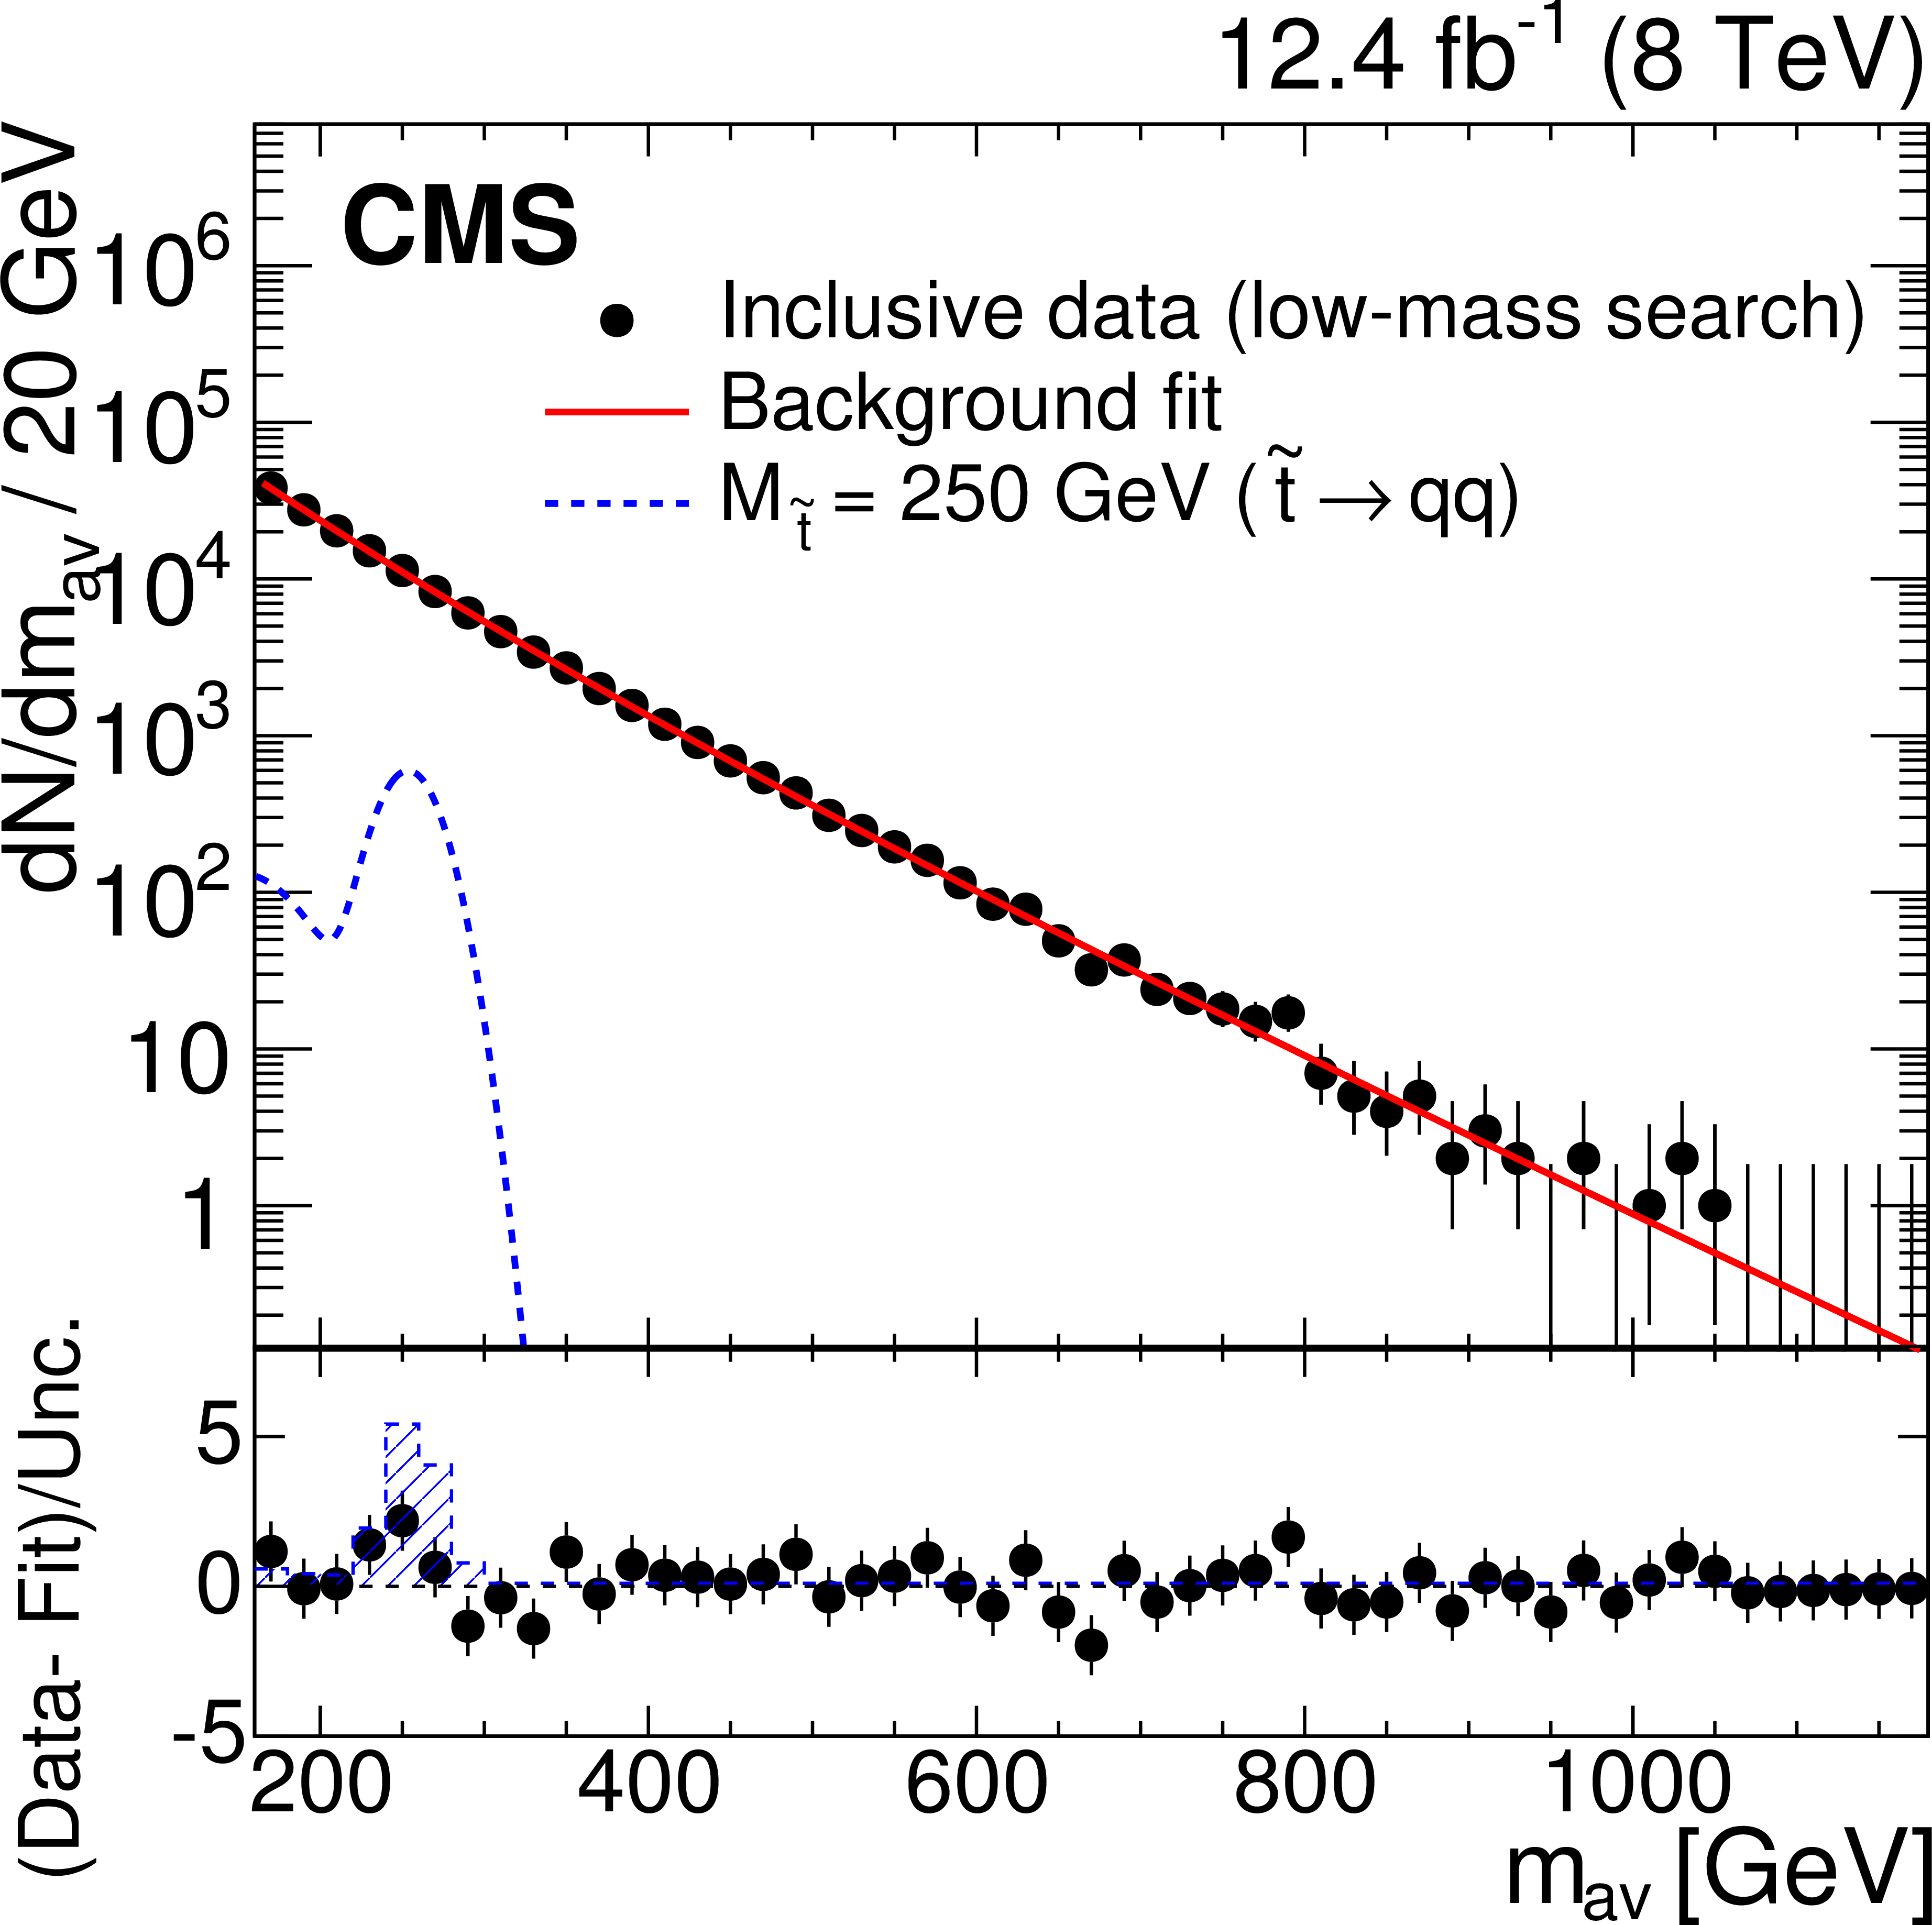
Figure 5-a:
The $m_{\text {av}}$ distributions with the superimposed fit from Eq.4. The events shown satisfy requirements for the inclusive searches (a,c) and the heavy-flavor searches (b,d) in the low-mass (a,b) and high-mass (c,d) scenarios. The expectation for the top squark signal is indicated by the blue dashed line for the low-mass search ($M_{ {\tilde{t}} }= $ 250 GeV) and for the high-mass search ($M_{ {\tilde{t}} }= $ 400 GeV). The bottom part of each figure shows the difference in each bin between the data and the background estimate divided by the statistical uncertainty associated with the data, with the shaded region indicating the expected distribution in the case of the top squark signal appearing in data. The last bin in each $m_{\text {av}}$ distribution also includes all overflow $m_{\text {av}}$ events. |

png pdf |
Figure 5-b:
The $m_{\text {av}}$ distributions with the superimposed fit from Eq.4. The events shown satisfy requirements for the inclusive searches (a,c) and the heavy-flavor searches (b,d) in the low-mass (a,b) and high-mass (c,d) scenarios. The expectation for the top squark signal is indicated by the blue dashed line for the low-mass search ($M_{ {\tilde{t}} }= $ 250 GeV) and for the high-mass search ($M_{ {\tilde{t}} }= $ 400 GeV). The bottom part of each figure shows the difference in each bin between the data and the background estimate divided by the statistical uncertainty associated with the data, with the shaded region indicating the expected distribution in the case of the top squark signal appearing in data. The last bin in each $m_{\text {av}}$ distribution also includes all overflow $m_{\text {av}}$ events. |

png pdf |
Figure 5-c:
The $m_{\text {av}}$ distributions with the superimposed fit from Eq.4. The events shown satisfy requirements for the inclusive searches (a,c) and the heavy-flavor searches (b,d) in the low-mass (a,b) and high-mass (c,d) scenarios. The expectation for the top squark signal is indicated by the blue dashed line for the low-mass search ($M_{ {\tilde{t}} }= $ 250 GeV) and for the high-mass search ($M_{ {\tilde{t}} }= $ 400 GeV). The bottom part of each figure shows the difference in each bin between the data and the background estimate divided by the statistical uncertainty associated with the data, with the shaded region indicating the expected distribution in the case of the top squark signal appearing in data. The last bin in each $m_{\text {av}}$ distribution also includes all overflow $m_{\text {av}}$ events. |
png pdf |
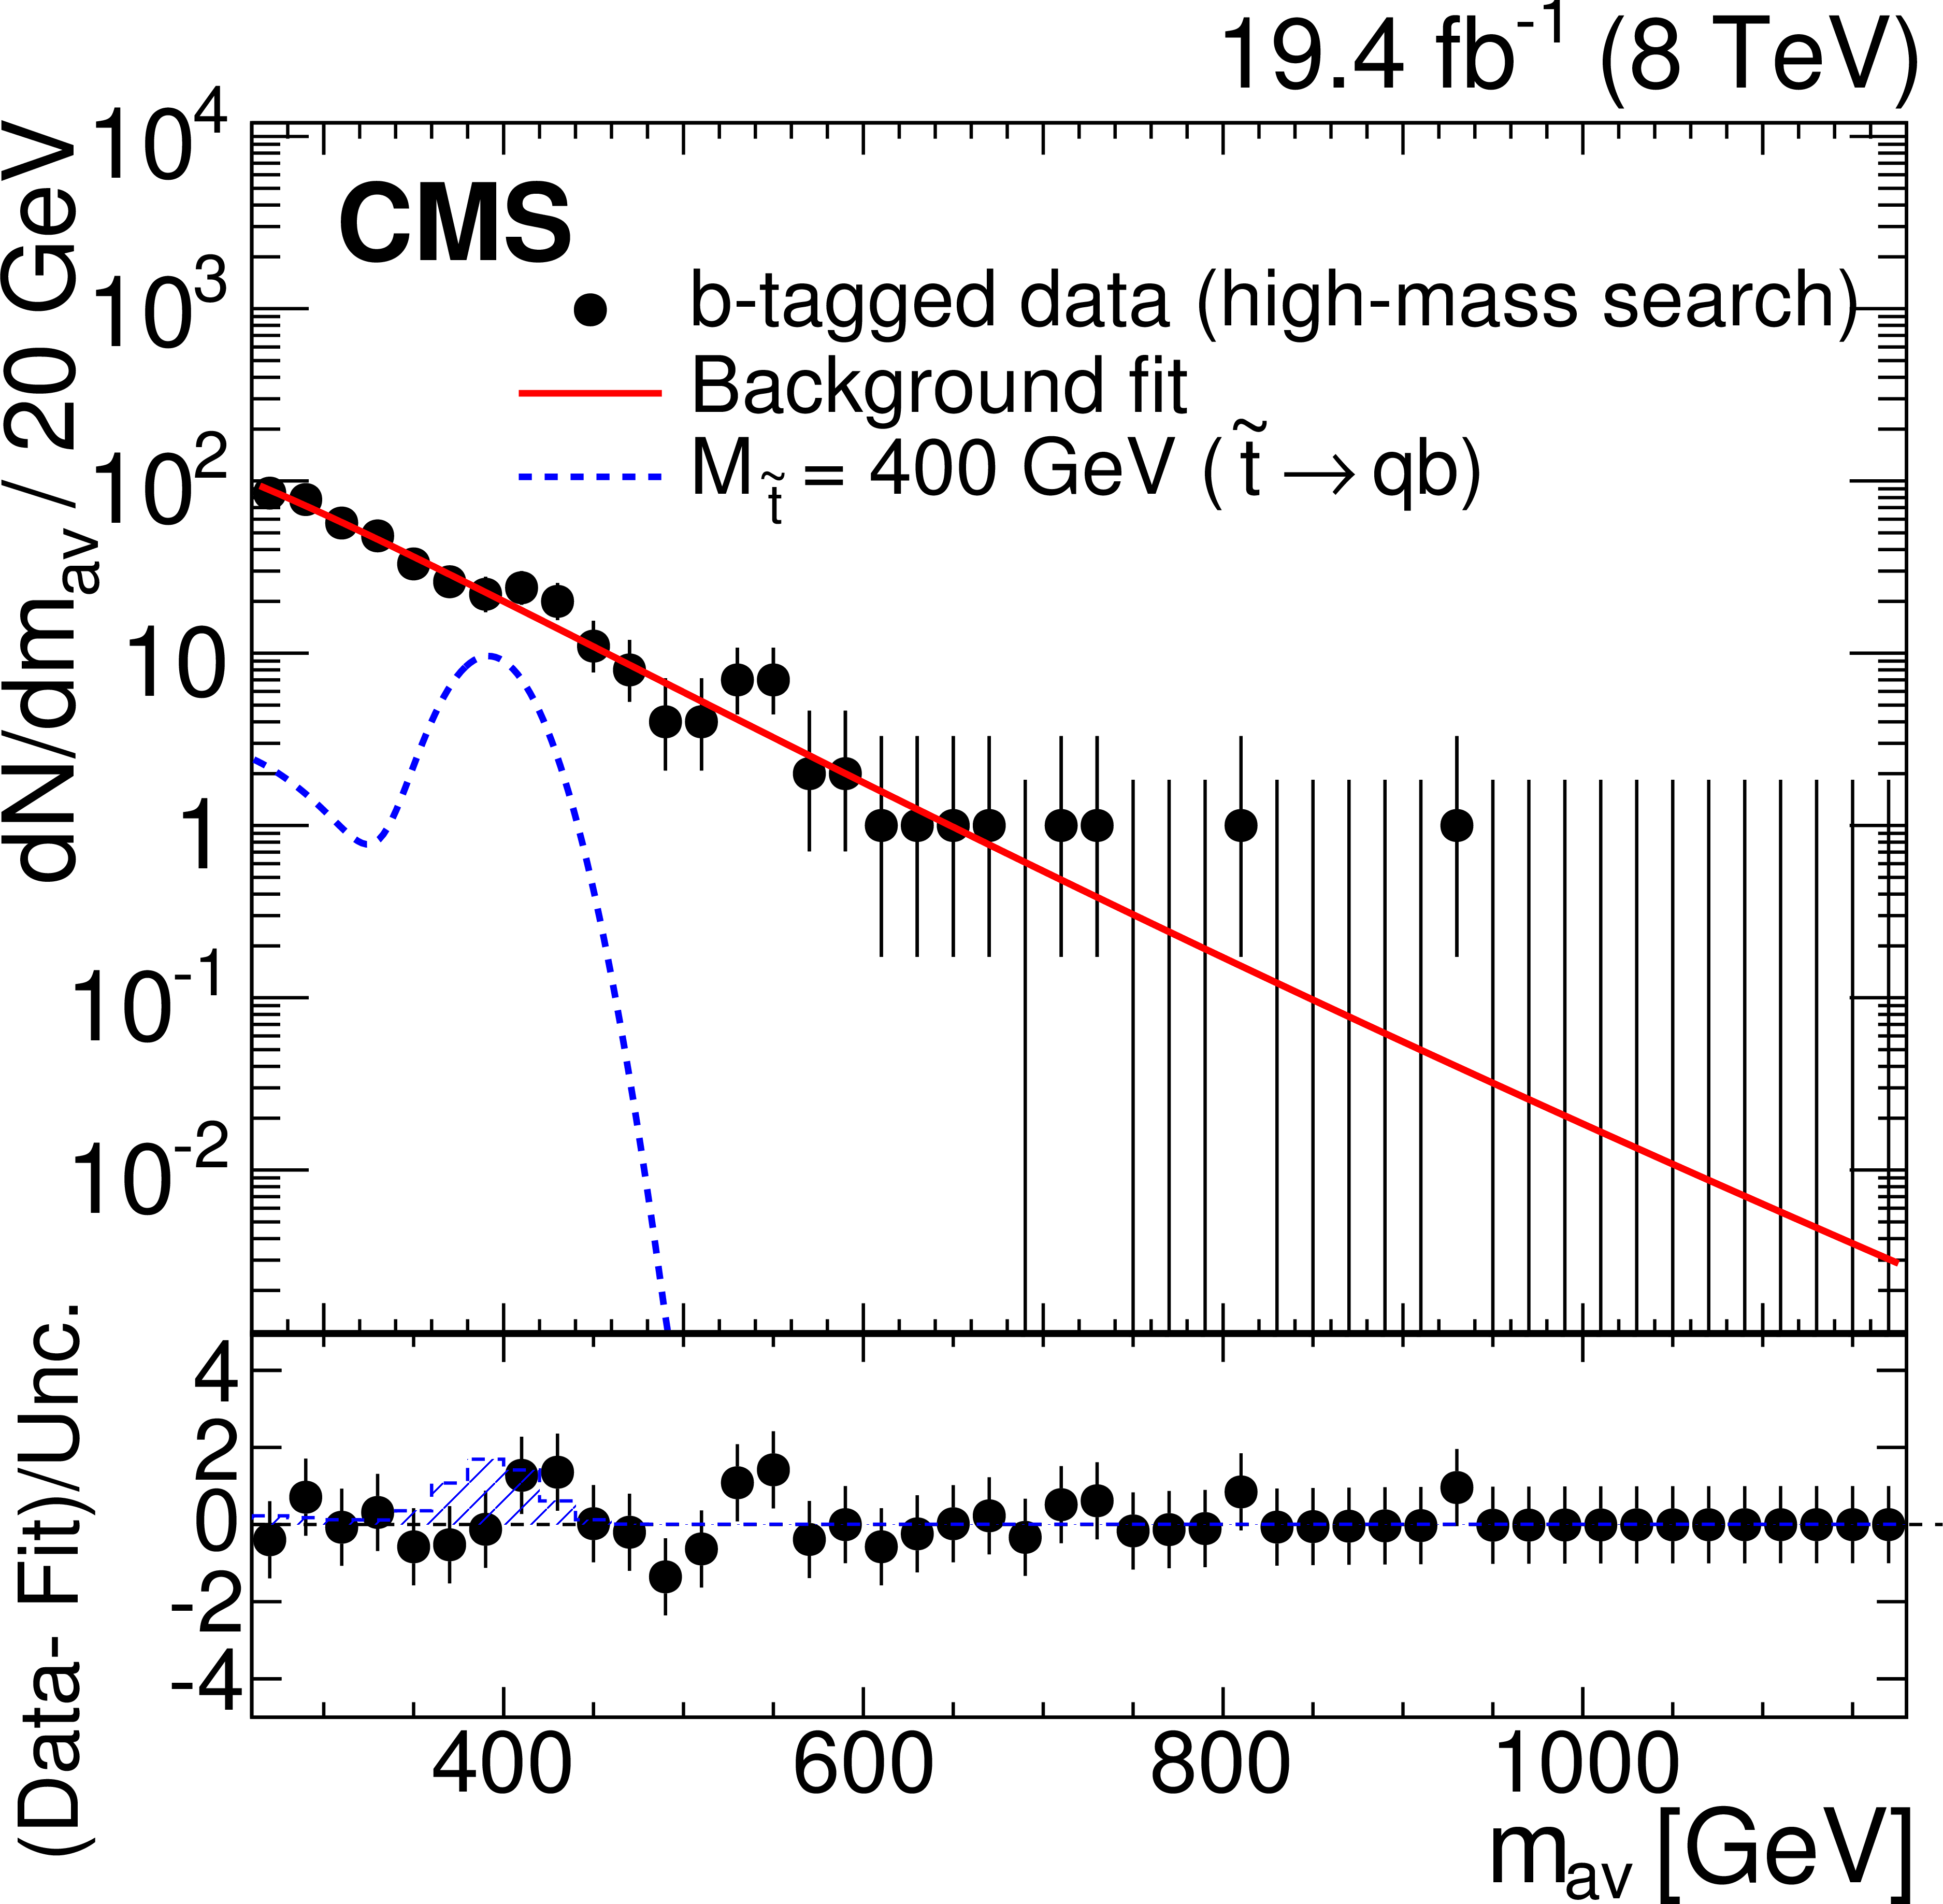
Figure 5-d:
The $m_{\text {av}}$ distributions with the superimposed fit from Eq.4. The events shown satisfy requirements for the inclusive searches (a,c) and the heavy-flavor searches (b,d) in the low-mass (a,b) and high-mass (c,d) scenarios. The expectation for the top squark signal is indicated by the blue dashed line for the low-mass search ($M_{ {\tilde{t}} }= $ 250 GeV) and for the high-mass search ($M_{ {\tilde{t}} }= $ 400 GeV). The bottom part of each figure shows the difference in each bin between the data and the background estimate divided by the statistical uncertainty associated with the data, with the shaded region indicating the expected distribution in the case of the top squark signal appearing in data. The last bin in each $m_{\text {av}}$ distribution also includes all overflow $m_{\text {av}}$ events. |
png pdf |
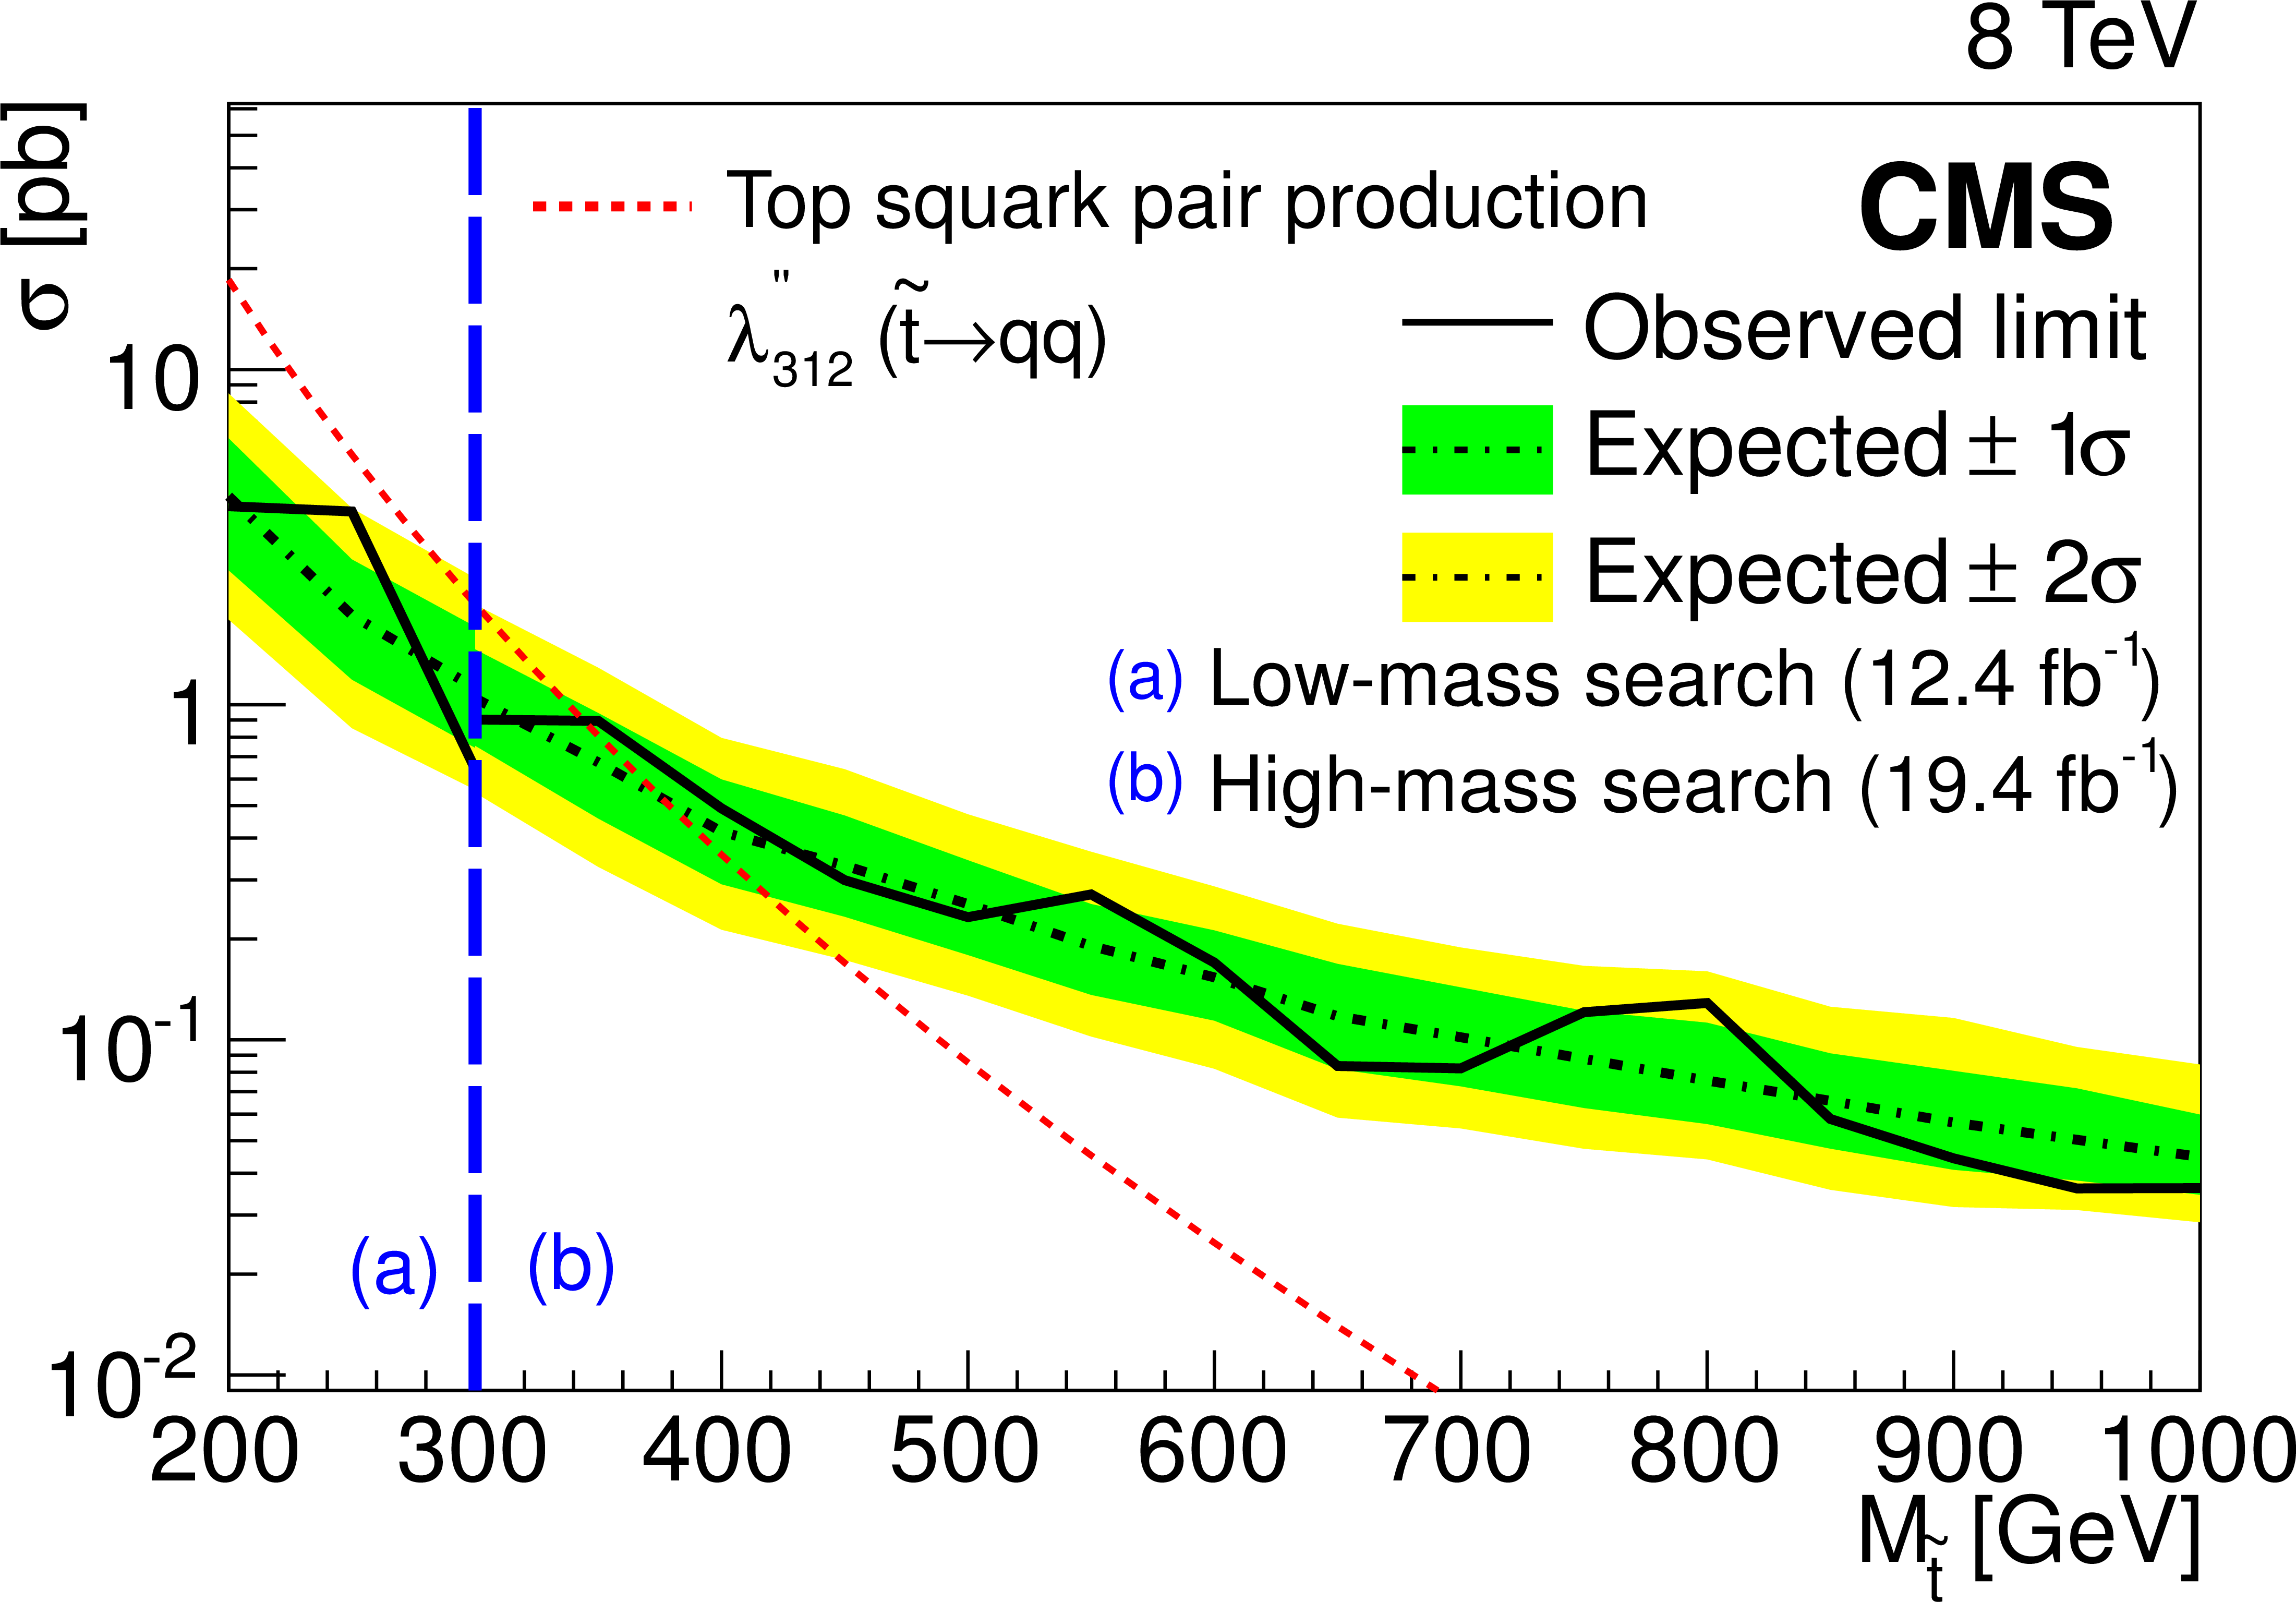
Figure 6-a:
Observed and expected 95% CL cross section limits as a function of top squark mass for the inclusive (a) and heavy-flavor (b) RPV top squark searches based on results from the low-mass [a] and high-mass [b] scenarios. The dotted red line shows the NLO+NLL predictions for top squark production, and the vertical dashed blue line indicates the boundary of the limits between the low- and high-mass scenarios. |
png pdf |
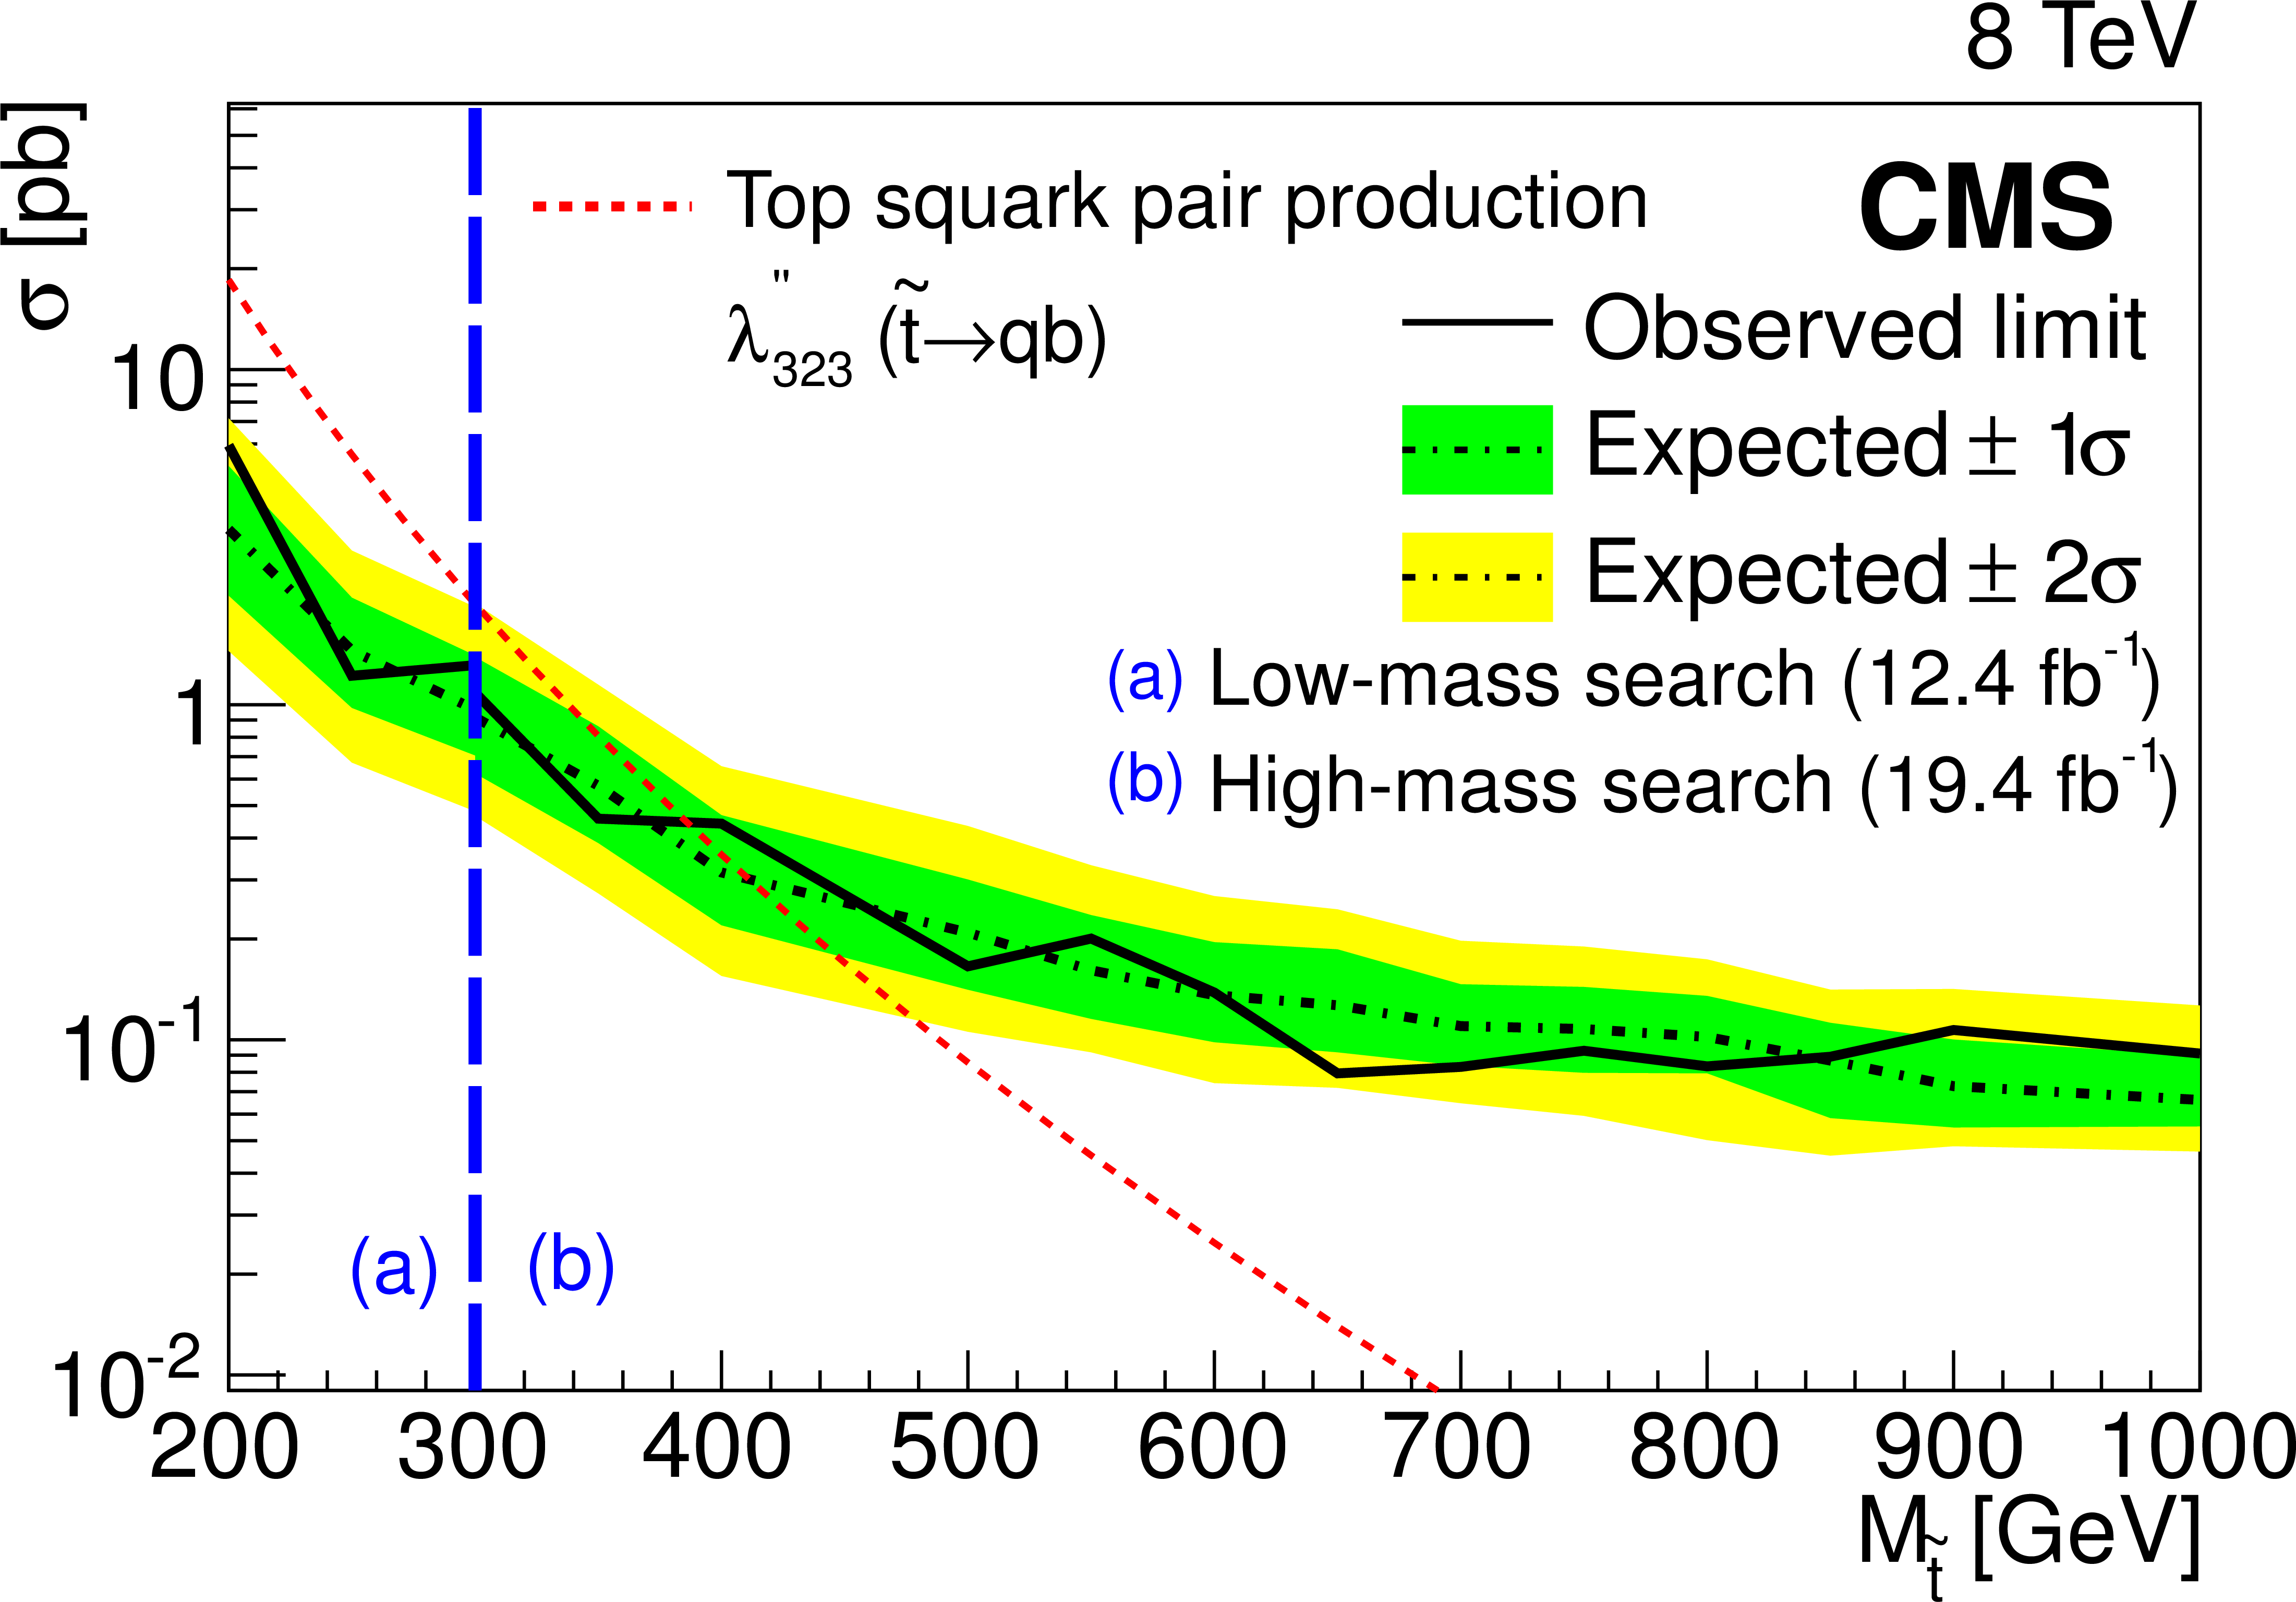
Figure 6-b:
Observed and expected 95% CL cross section limits as a function of top squark mass for the inclusive (a) and heavy-flavor (b) RPV top squark searches based on results from the low-mass [a] and high-mass [b] scenarios. The dotted red line shows the NLO+NLL predictions for top squark production, and the vertical dashed blue line indicates the boundary of the limits between the low- and high-mass scenarios. |
png pdf |
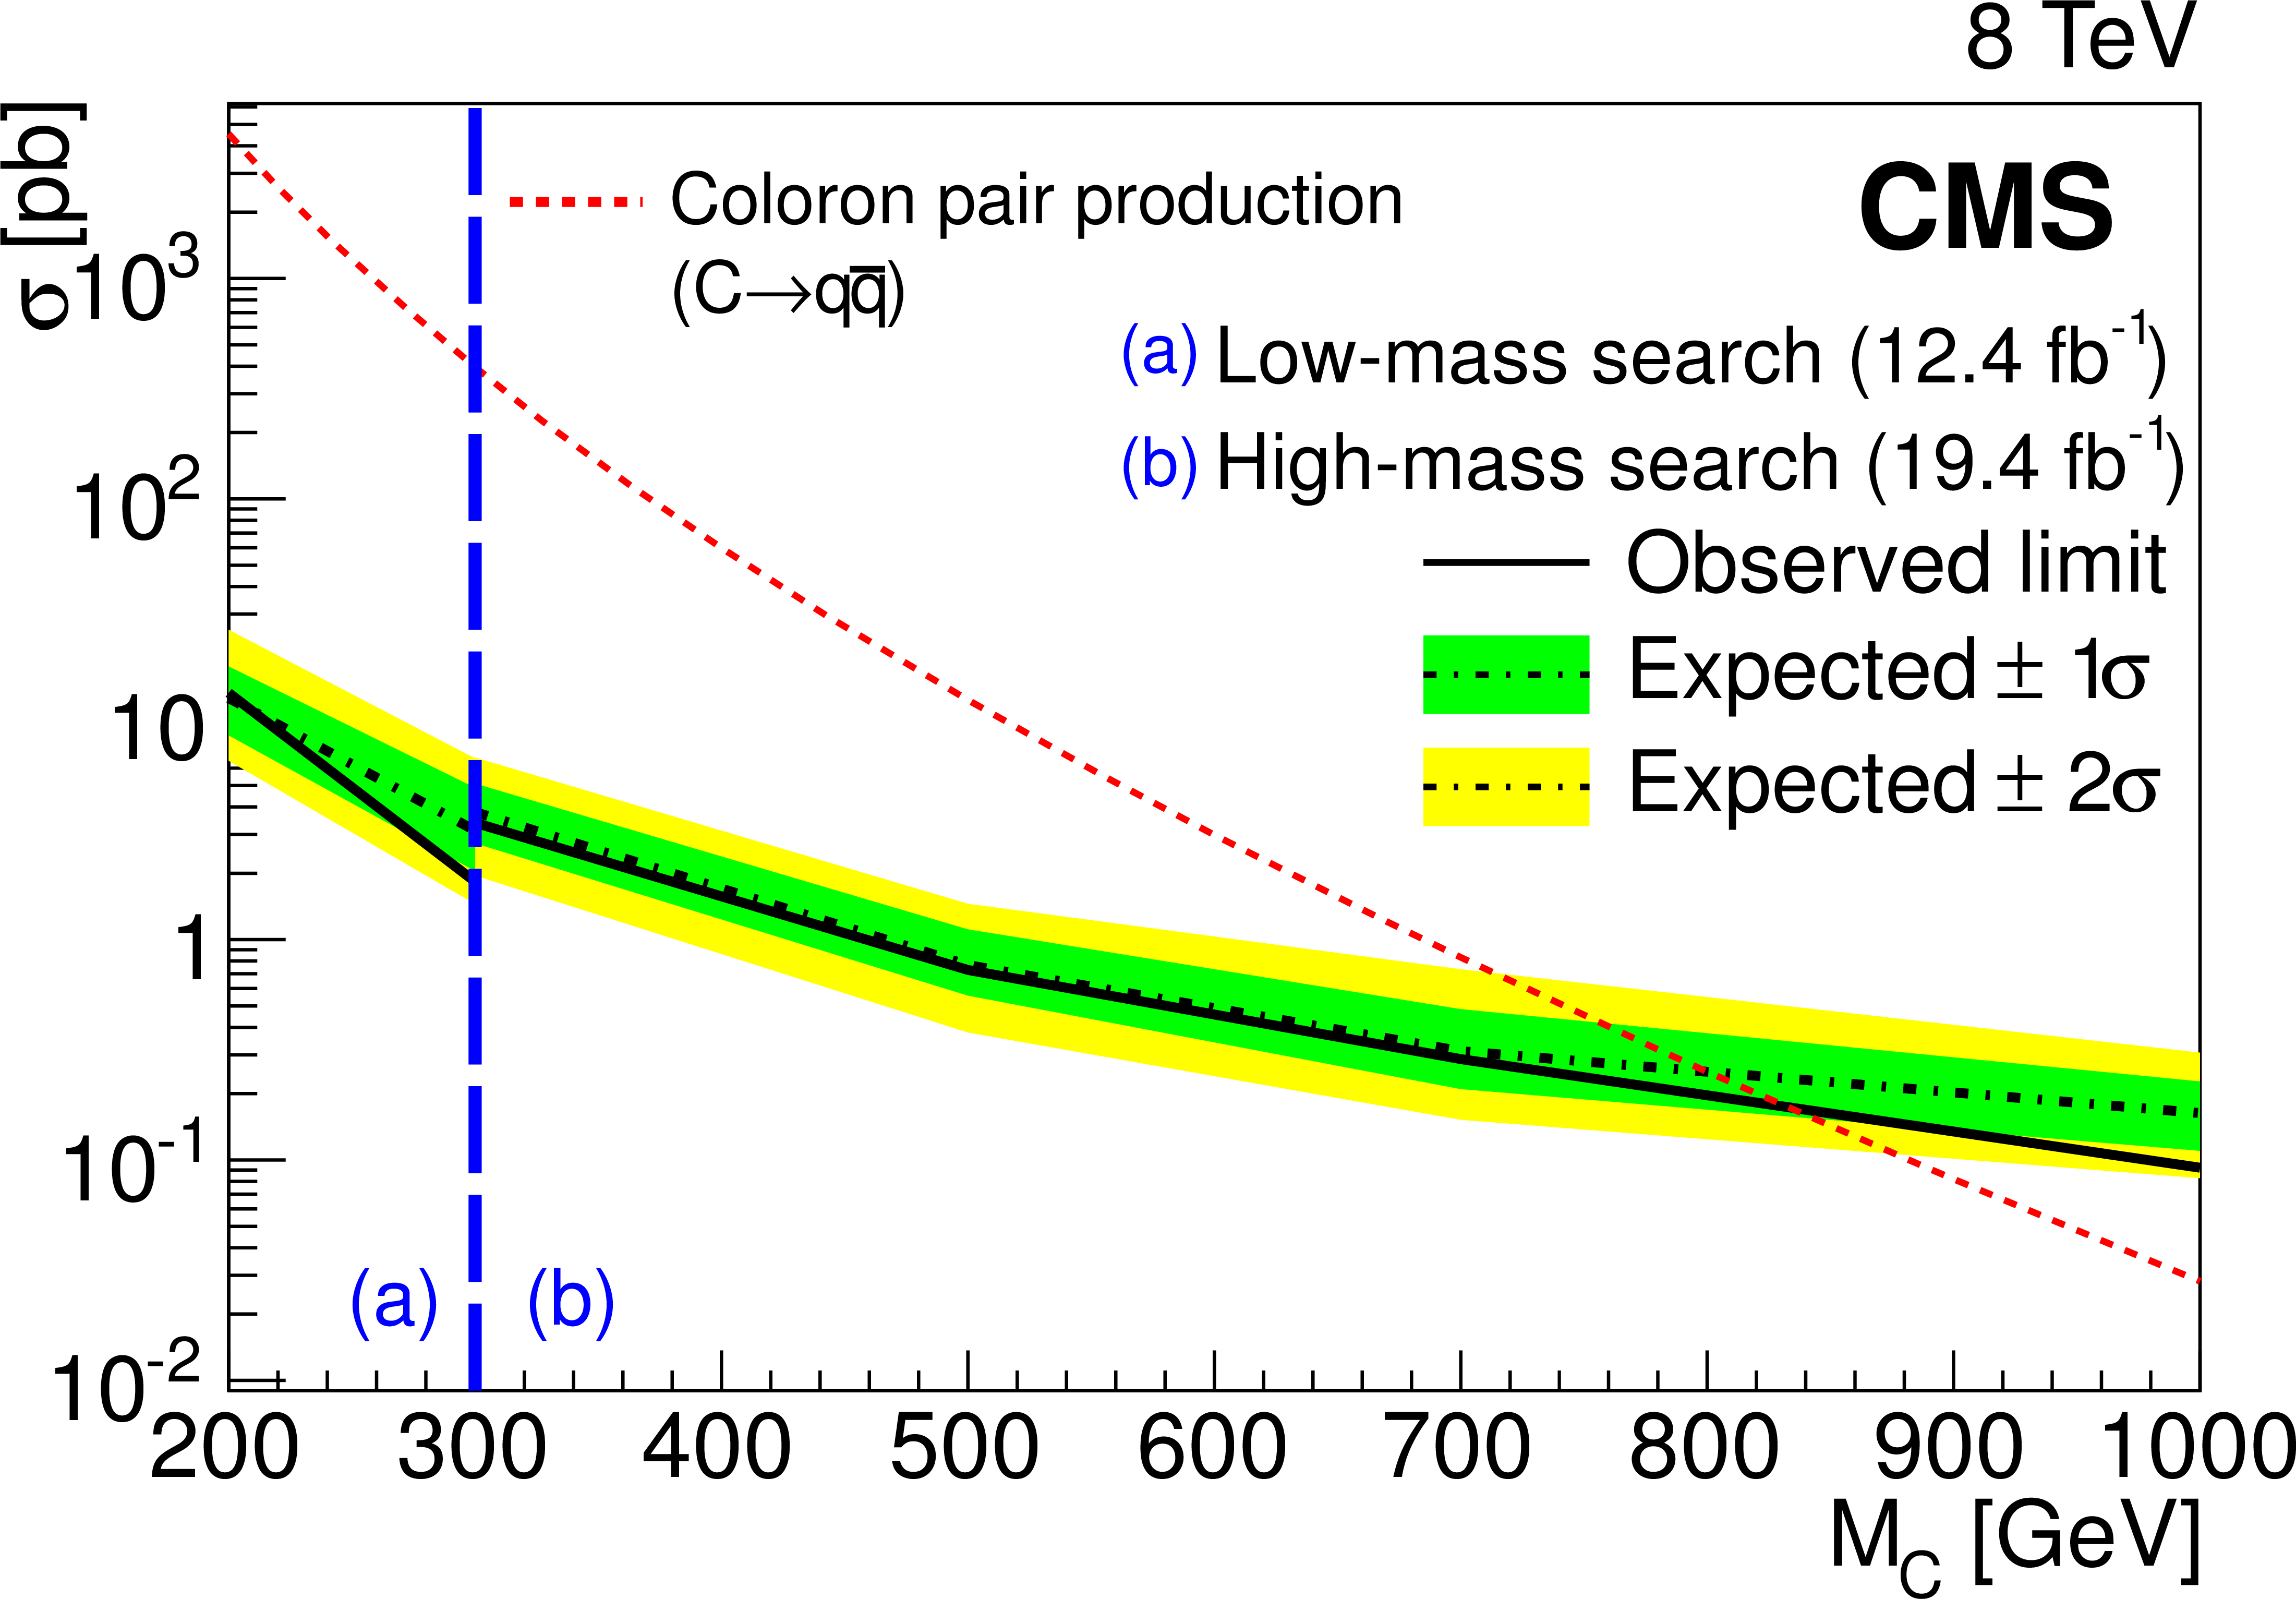
Figure 7:
Observed and expected 95% CL cross section limits as a function of coloron mass for the pair-produced coloron search based on results from the low-mass [a] and high-mass [b] scenarios. The dotted red line shows the NLO+NLL predictions for coloron pair production, and the vertical dashed blue line indicates the boundary of the limits between the low- and high-mass scenarios. |
| Tables | |
png pdf |
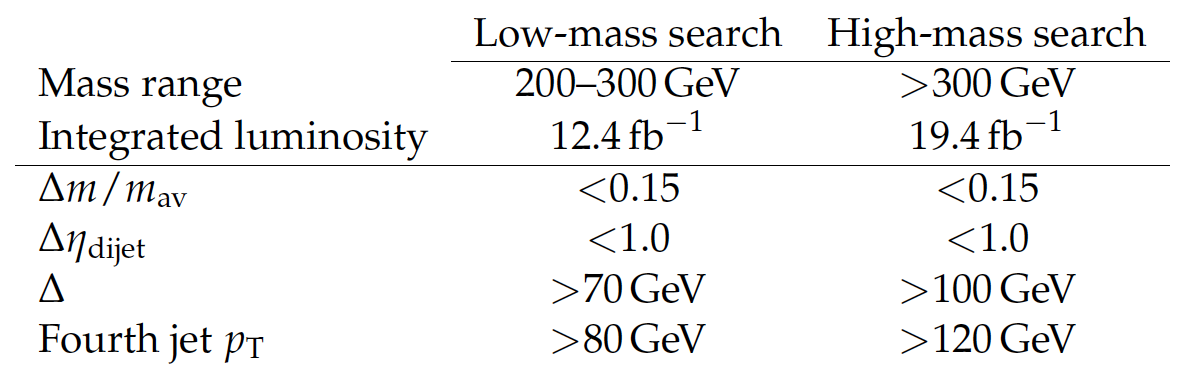
Table 1:
Summary of the low- and high-mass selection criteria for both the inclusive and heavy-flavor analyses. For the heavy-flavor analysis, in addition to the requirements below, at least two of the four highest-$p_{\mathrm{T}}$ jets must be b-tagged. |
| Summary |
| A search has been performed for pair production of heavy resonances decaying to pairs of jets in four-jet events from proton-proton collisions at $\sqrt{s} =$ 8 TeV with the CMS detector. The distribution in the average mass of selected dijet pairs has been investigated for localized disagreements between the data and the background estimate. This method takes advantage of a number of additional optimized kinematic requirements imposed on the dijet pair. No significant deviation is found between the selected events and the expected standard model multijet background. Limits are placed on the production of colorons decaying into four jets with a 100% branching fraction, excluding at 95% confidence level, masses between 200 and 835 GeV. For this model, these results include first limits in the mass ranges of 200-250 GeV and 740-835 GeV, extending previous limits [15] to lower masses by 50 GeV, and to higher masses by 95 GeV. Limits are set on top squark pair production through the $\lambda^{\prime\prime}$ coupling to final states UDD with either only light-flavor jets or both light- and heavy-flavor jets with a 100% branching fraction. We exclude at a 95% confidence level top squark production followed by R-parity violating decays to light-flavor jets for top squark masses from 200 to 350 GeV and decays to heavy-flavor jets for masses between 200 and 385 GeV. Both sets of limits are the most stringent such limits to date, and the first from the LHC for this model of R-parity violating top squark decay. |
|
|
Compact Muon Solenoid LHC, CERN |
|

|

|

|

|

|