

Compact Muon Solenoid
LHC, CERN
| CMS-EXO-12-057 ; CERN-PH-EP-2015-001 | ||
| Search for heavy Majorana neutrinos in $\mu^\pm \mu^\pm$+jets events in proton-proton collisions at $\sqrt{s}$ = 8 TeV | ||
| CMS Collaboration | ||
| 22 January 2015 | ||
| Phys. Lett. B 748 (2015) 144 | ||
| Abstract: A search is performed for heavy Majorana neutrinos (N) using an event signature defined by two muons of the same charge and two jets ($\mu^\pm \mu^\pm \mathrm{j j}$). The data correspond to an integrated luminosity of 19.7 fb$^{-1}$ of proton-proton collisions at a center-of-mass energy of 8 TeV, collected with the CMS detector at the CERN LHC. No excess of events is observed beyond the expected standard model background and upper limits are set on $|V_{\mu\mathrm{N}}|^2$ as a function of Majorana neutrino mass $\mathrm{m}_{\mathrm{N}}$ for masses in the range of 40-500 GeV, where $|V_{\mu\mathrm{N}}|$ is the mixing element of the heavy neutrino with the standard model muon neutrino. The limits obtained are $|V_{\mu\mathrm{N}}|^2 \le 0.00470$ for $\mathrm{m}_{\mathrm{N}} = 90$ GeV, $|V_{\mu\mathrm{N}}|^2 \le 0.0123$ for $\mathrm{m}_{\mathrm{N}} = 200$ GeV, and $|V_{\mu\mathrm{N}}|^2 \le 0.583$ for $\mathrm{m}_{\mathrm{N}} = 500$ GeV. These results extend considerably the regions excluded by previous direct searches. | ||
| Links: e-print arXiv:1501.05566 [hep-ex] (PDF) ; CDS record ; inSPIRE record ; Public twiki page ; CADI line (restricted) ; | ||
| Figures | |

png pdf |
Figure 1:
The lowest order Feynman diagram for production of a heavy Majorana neutrino N. The charge-conjugate diagram also contributes and results in a $\ell ^- \ell ^- {\mathrm {q}} {\overline {\mathrm {q}}} '$ final state. |
png pdf |
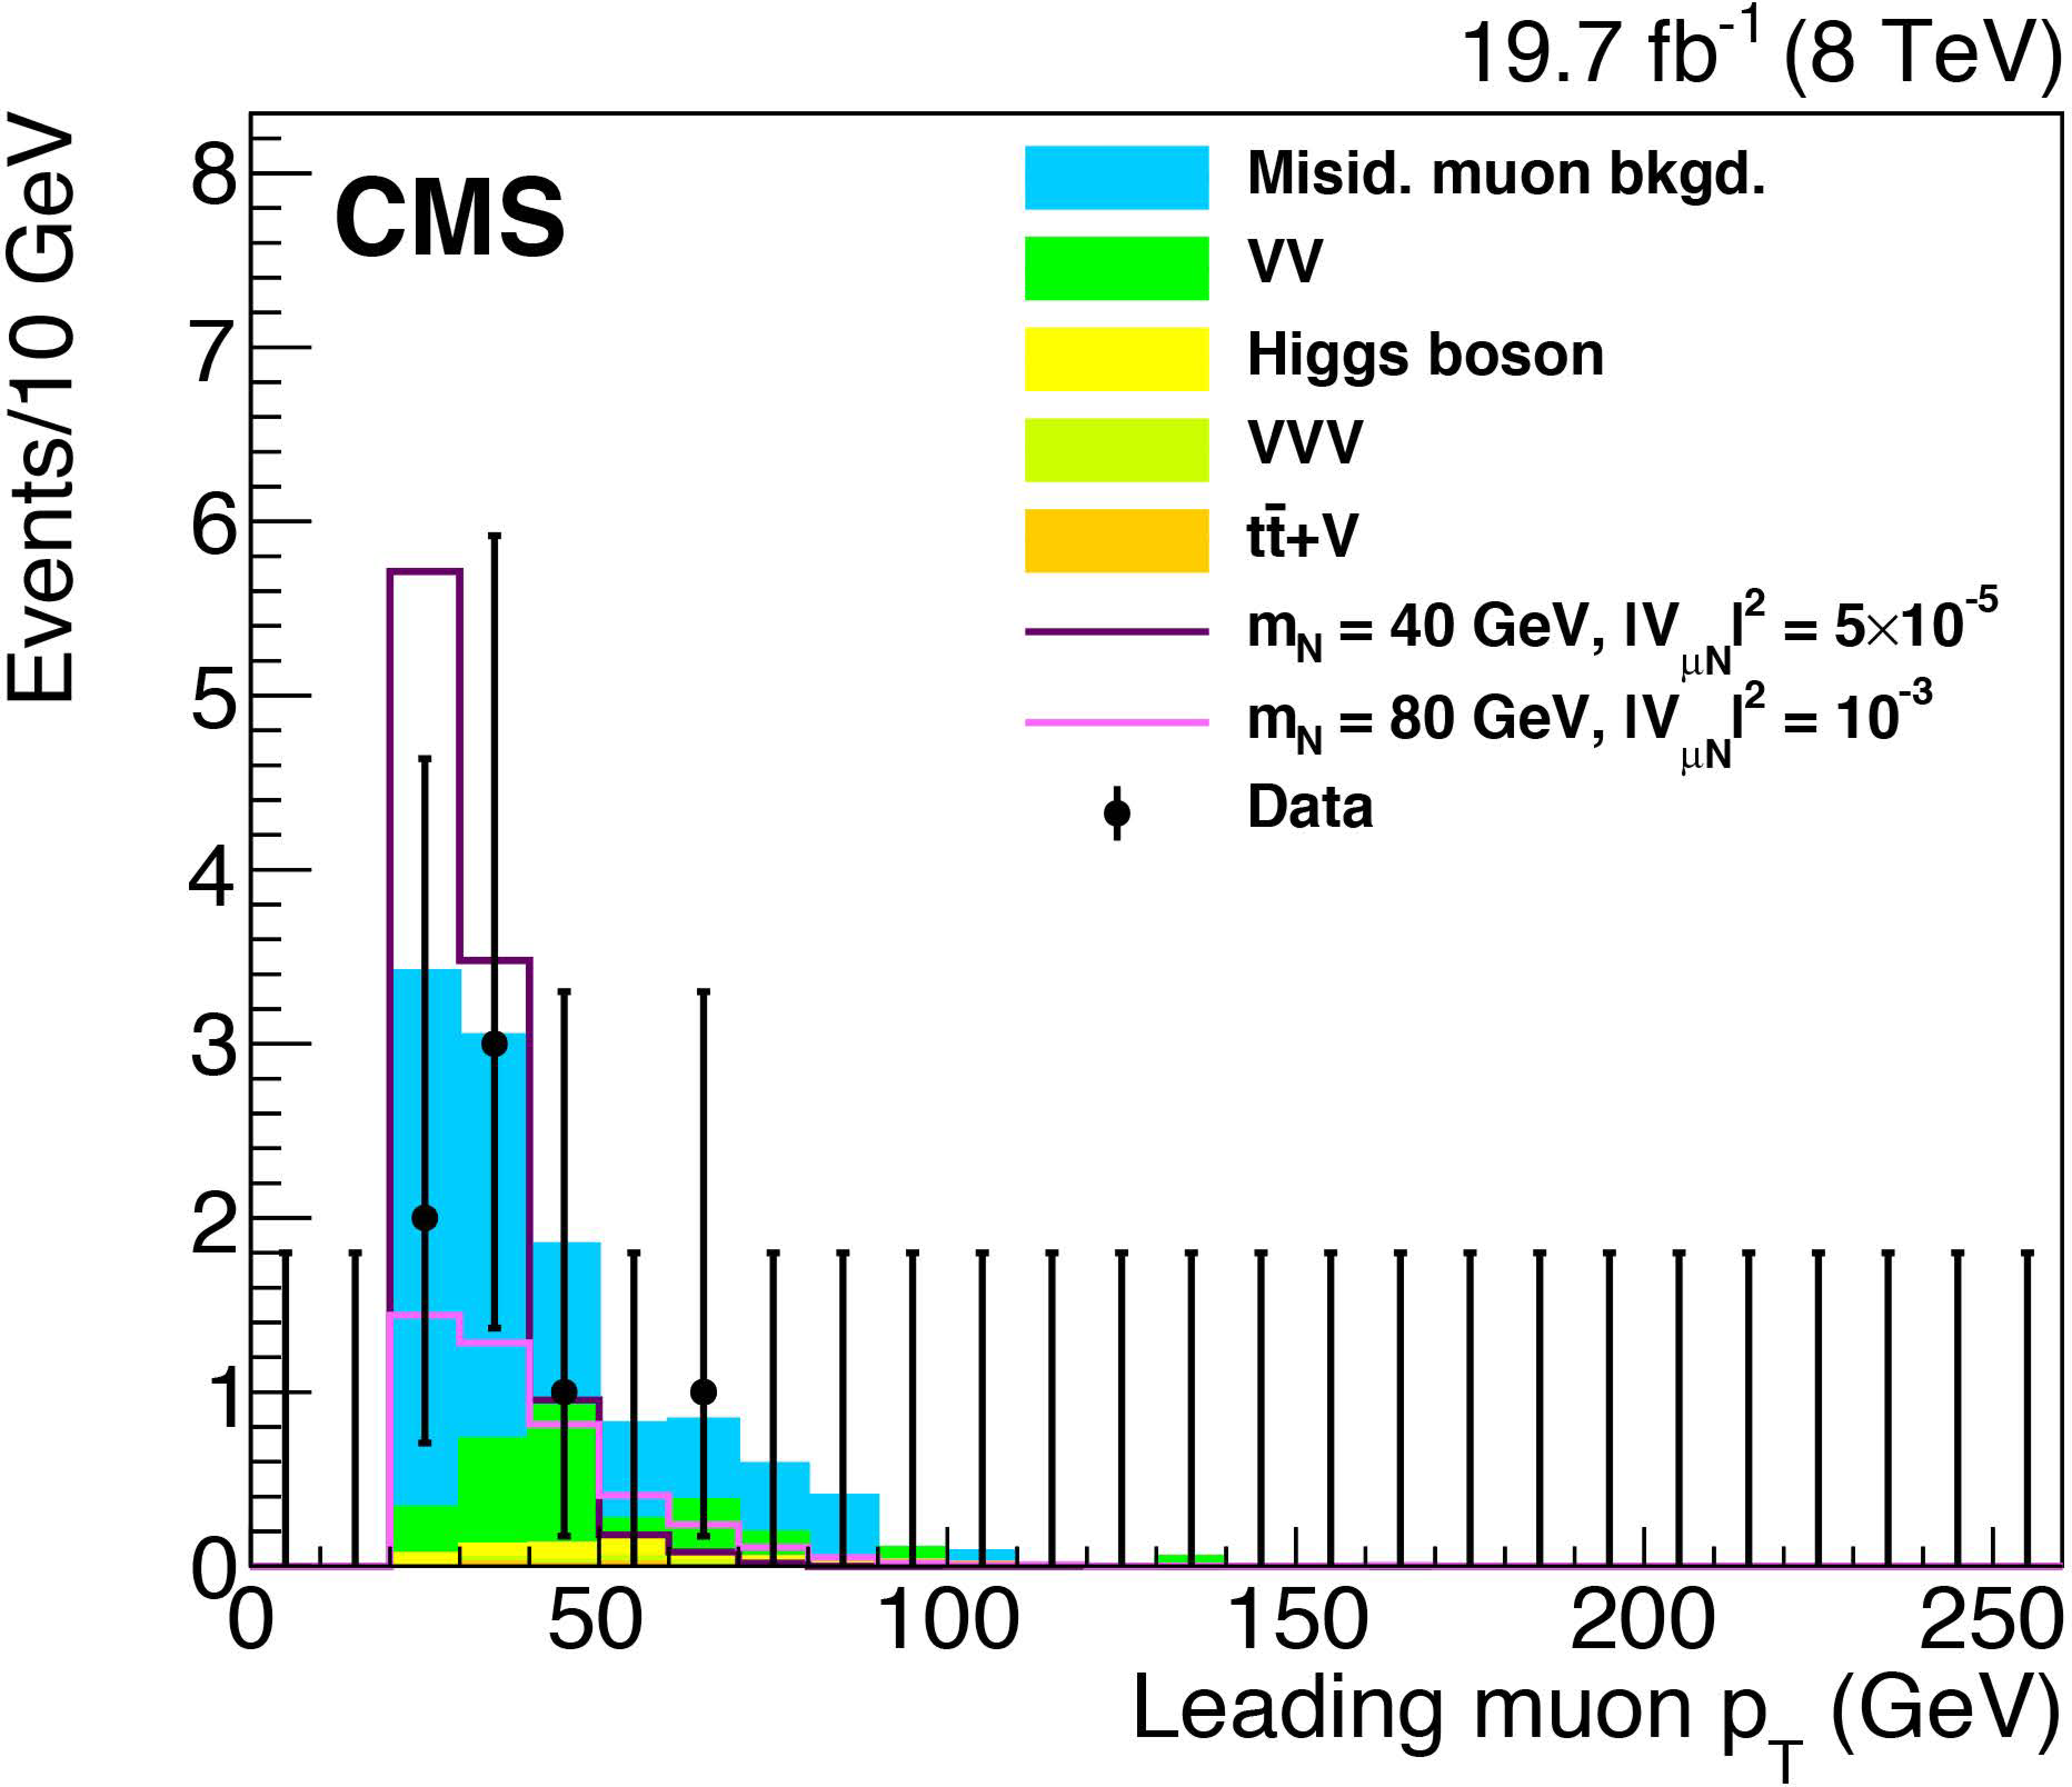
Figure 2-a:
Kinematic distributions for the low-mass region after all selections are applied except for the final optimization requirements: leading muon $ {p_{\mathrm {T}}} $ (top), trailing muon $ {p_{\mathrm {T}}} $ (middle), and $\mu ^\pm \mu ^\pm \mathrm {j j}$ invariant mass (bottom). The plots show the data, backgrounds, and two choices for the heavy Majorana neutrino signal: $ {m_\mathrm {N}} =$ 40 GeV, $ {| {V_{\mu \mathrm {N}}} | }^2 = 5\times 10^{-5}$ and $ {m_\mathrm {N}} =$ 80 GeV, $ {| {V_{\mu \mathrm {N}}} | }^2 = 1 \times 10^{-3}$. The backgrounds shown are from misidentified muons and from diboson (VV), Higgs boson, triboson (VVV), and $ {\mathrm {t}\overline {\mathrm {t}}} {\mathrm {W}}$ production. |

png pdf |
Figure 2-b:
Kinematic distributions for the low-mass region after all selections are applied except for the final optimization requirements: leading muon $ {p_{\mathrm {T}}} $ (top), trailing muon $ {p_{\mathrm {T}}} $ (middle), and $\mu ^\pm \mu ^\pm \mathrm {j j}$ invariant mass (bottom). The plots show the data, backgrounds, and two choices for the heavy Majorana neutrino signal: $ {m_\mathrm {N}} =$ 40 GeV, $ {| {V_{\mu \mathrm {N}}} | }^2 = 5\times 10^{-5}$ and $ {m_\mathrm {N}} =$ 80 GeV, $ {| {V_{\mu \mathrm {N}}} | }^2 = 1 \times 10^{-3}$. The backgrounds shown are from misidentified muons and from diboson (VV), Higgs boson, triboson (VVV), and $ {\mathrm {t}\overline {\mathrm {t}}} {\mathrm {W}}$ production. |
png pdf |
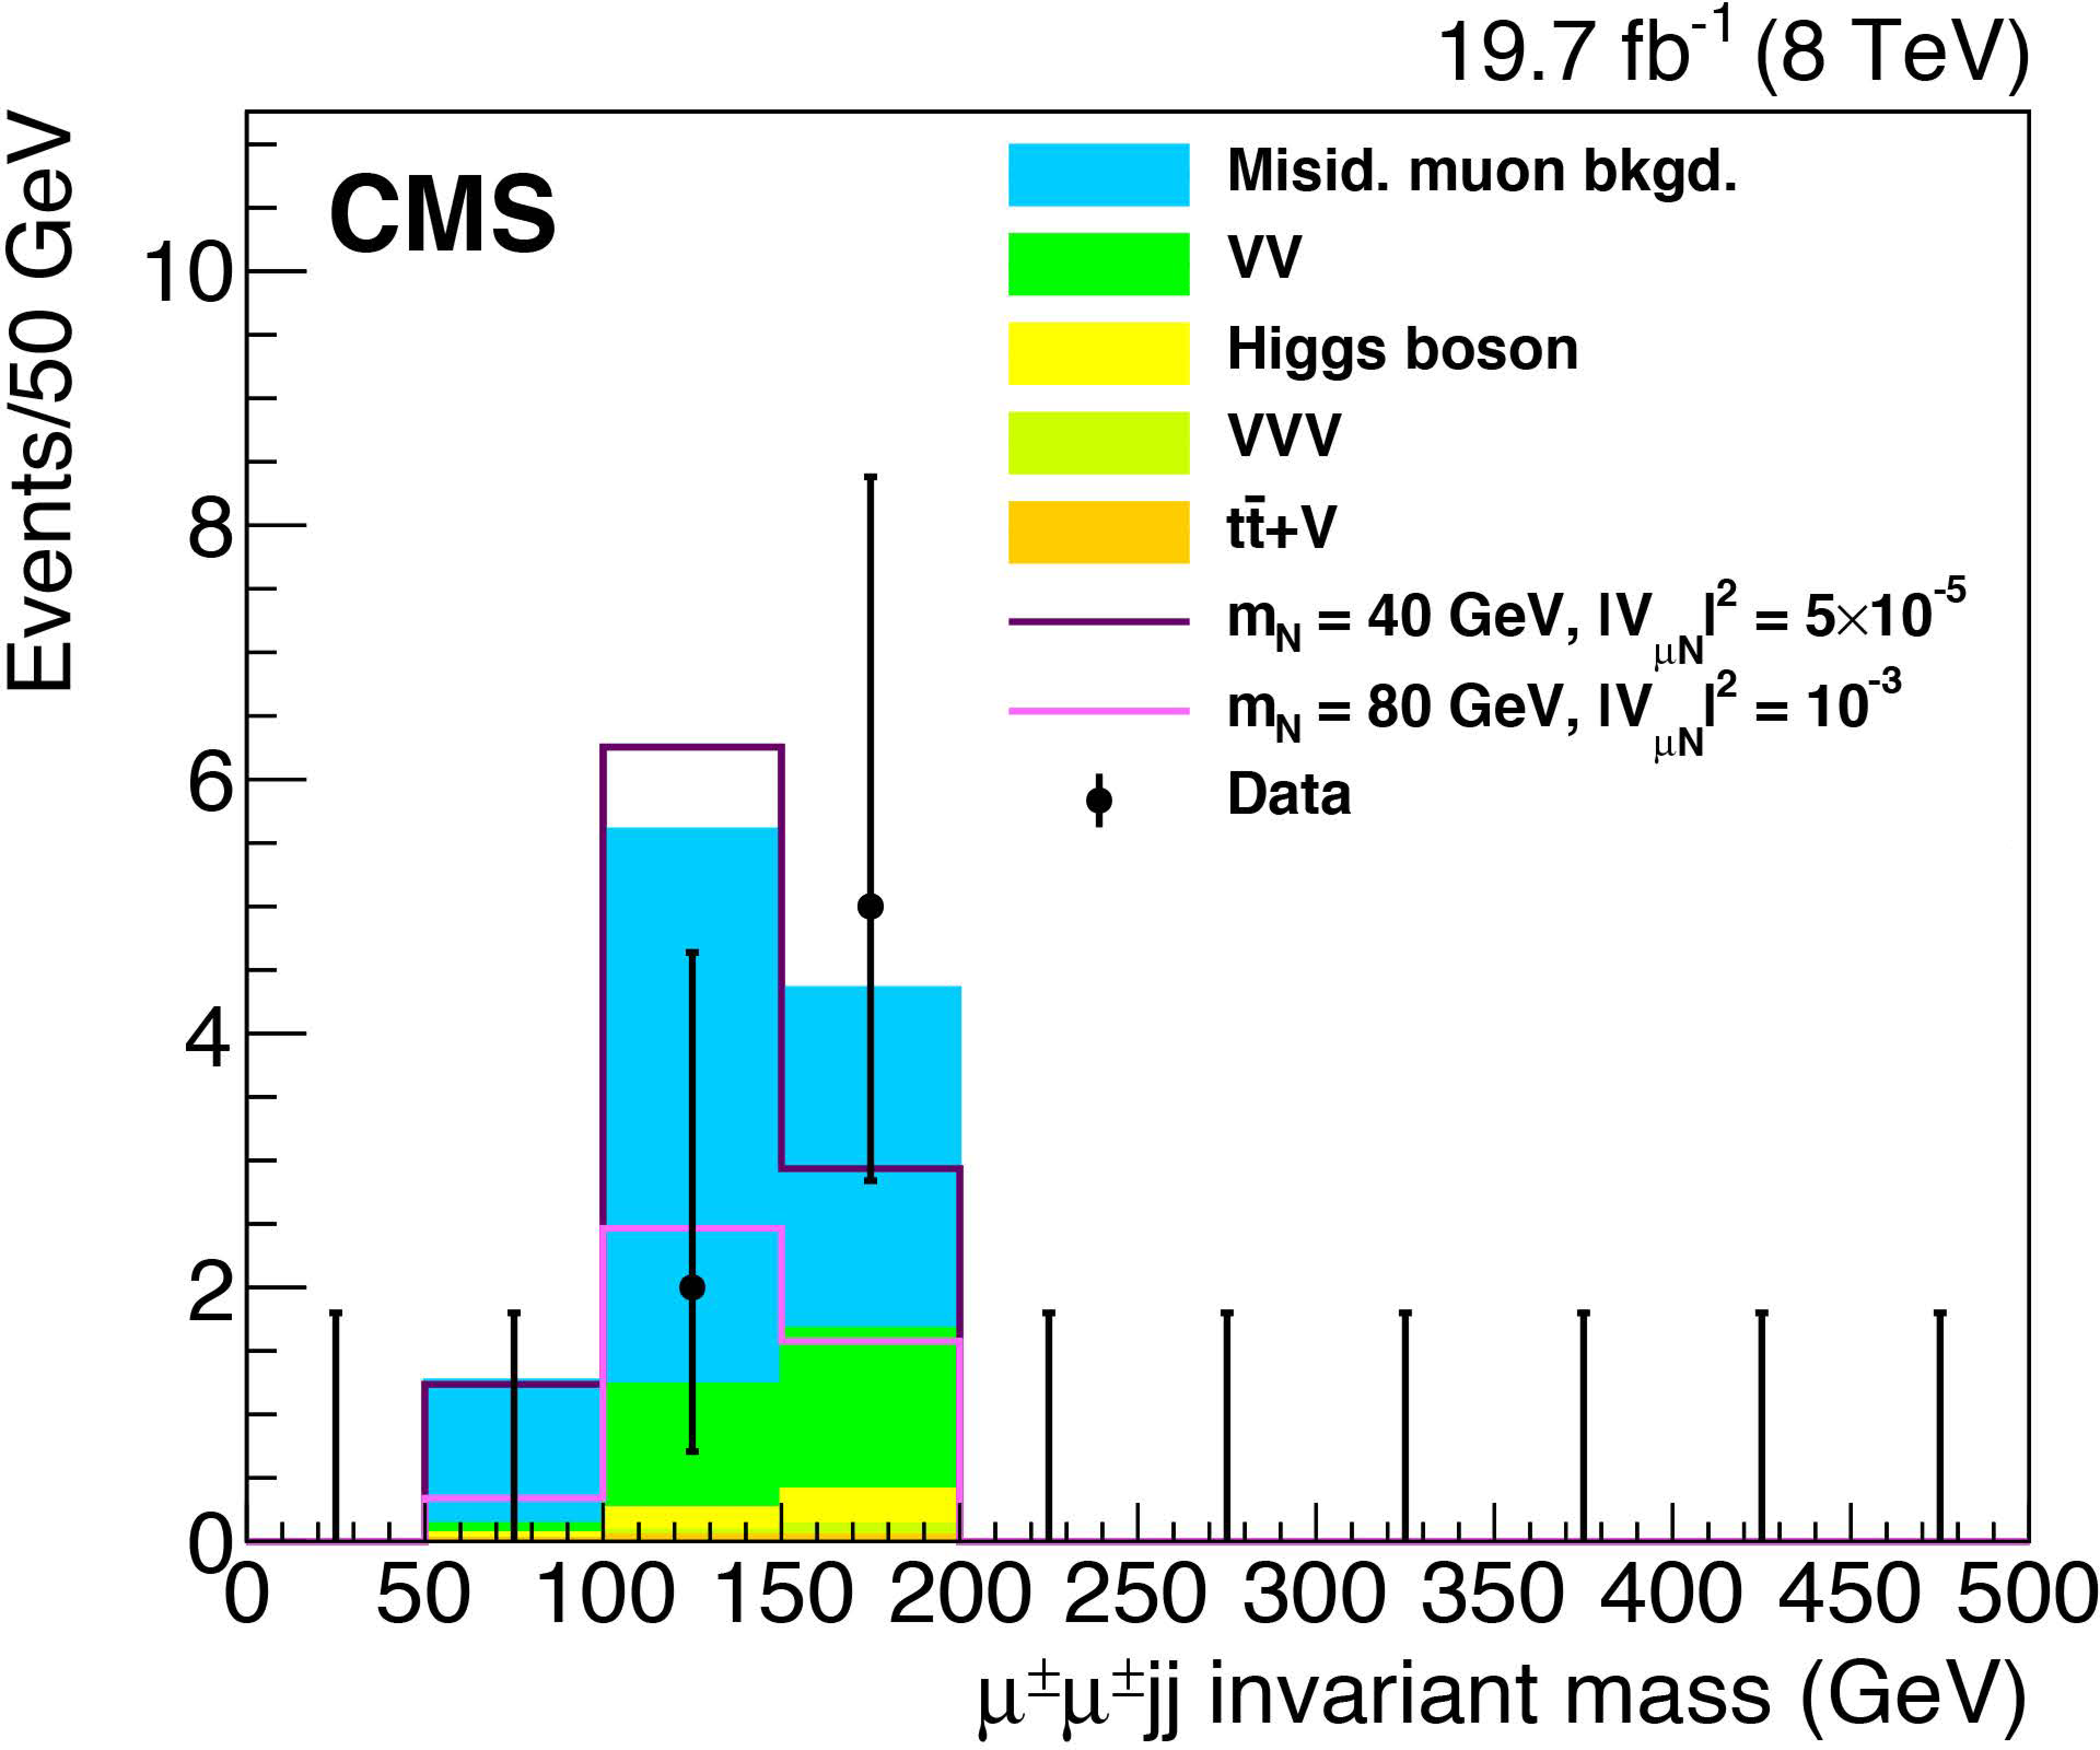
Figure 2-c:
Kinematic distributions for the low-mass region after all selections are applied except for the final optimization requirements: leading muon $ {p_{\mathrm {T}}} $ (top), trailing muon $ {p_{\mathrm {T}}} $ (middle), and $\mu ^\pm \mu ^\pm \mathrm {j j}$ invariant mass (bottom). The plots show the data, backgrounds, and two choices for the heavy Majorana neutrino signal: $ {m_\mathrm {N}} =$ 40 GeV, $ {| {V_{\mu \mathrm {N}}} | }^2 = 5\times 10^{-5}$ and $ {m_\mathrm {N}} =$ 80 GeV, $ {| {V_{\mu \mathrm {N}}} | }^2 = 1 \times 10^{-3}$. The backgrounds shown are from misidentified muons and from diboson (VV), Higgs boson, triboson (VVV), and $ {\mathrm {t}\overline {\mathrm {t}}} {\mathrm {W}}$ production. |

png pdf |
Figure 3-a:
Kinematic distributions for the high-mass region after all selections are applied except for the final optimization requirements: leading muon $ {p_{\mathrm {T}}} $ (top), trailing muon $ {p_{\mathrm {T}}} $ (middle), and $\mu ^\pm \mu ^\pm \mathrm {j j}$ invariant mass (bottom). The plots show the data, backgrounds, and two choices for the heavy Majorana neutrino signal: $ {m_\mathrm {N}} = 100$ GeV , $ {| {V_{\mu \mathrm {N}}} | }^2 = 0.001$ and $ {m_\mathrm {N}} = 300$ GeV , $ {| {V_{\mu \mathrm {N}}} | }^2 = 0.05$. The backgrounds shown are from misidentified muons and from diboson (VV), Higgs boson, triboson (VVV), and $ {\mathrm {t}\overline {\mathrm {t}}} {\mathrm {W}}$ production. |

png pdf |
Figure 3-b:
Kinematic distributions for the high-mass region after all selections are applied except for the final optimization requirements: leading muon $ {p_{\mathrm {T}}} $ (top), trailing muon $ {p_{\mathrm {T}}} $ (middle), and $\mu ^\pm \mu ^\pm \mathrm {j j}$ invariant mass (bottom). The plots show the data, backgrounds, and two choices for the heavy Majorana neutrino signal: $ {m_\mathrm {N}} = 100$ GeV , $ {| {V_{\mu \mathrm {N}}} | }^2 = 0.001$ and $ {m_\mathrm {N}} = 300$ GeV , $ {| {V_{\mu \mathrm {N}}} | }^2 = 0.05$. The backgrounds shown are from misidentified muons and from diboson (VV), Higgs boson, triboson (VVV), and $ {\mathrm {t}\overline {\mathrm {t}}} {\mathrm {W}}$ production. |
png pdf |
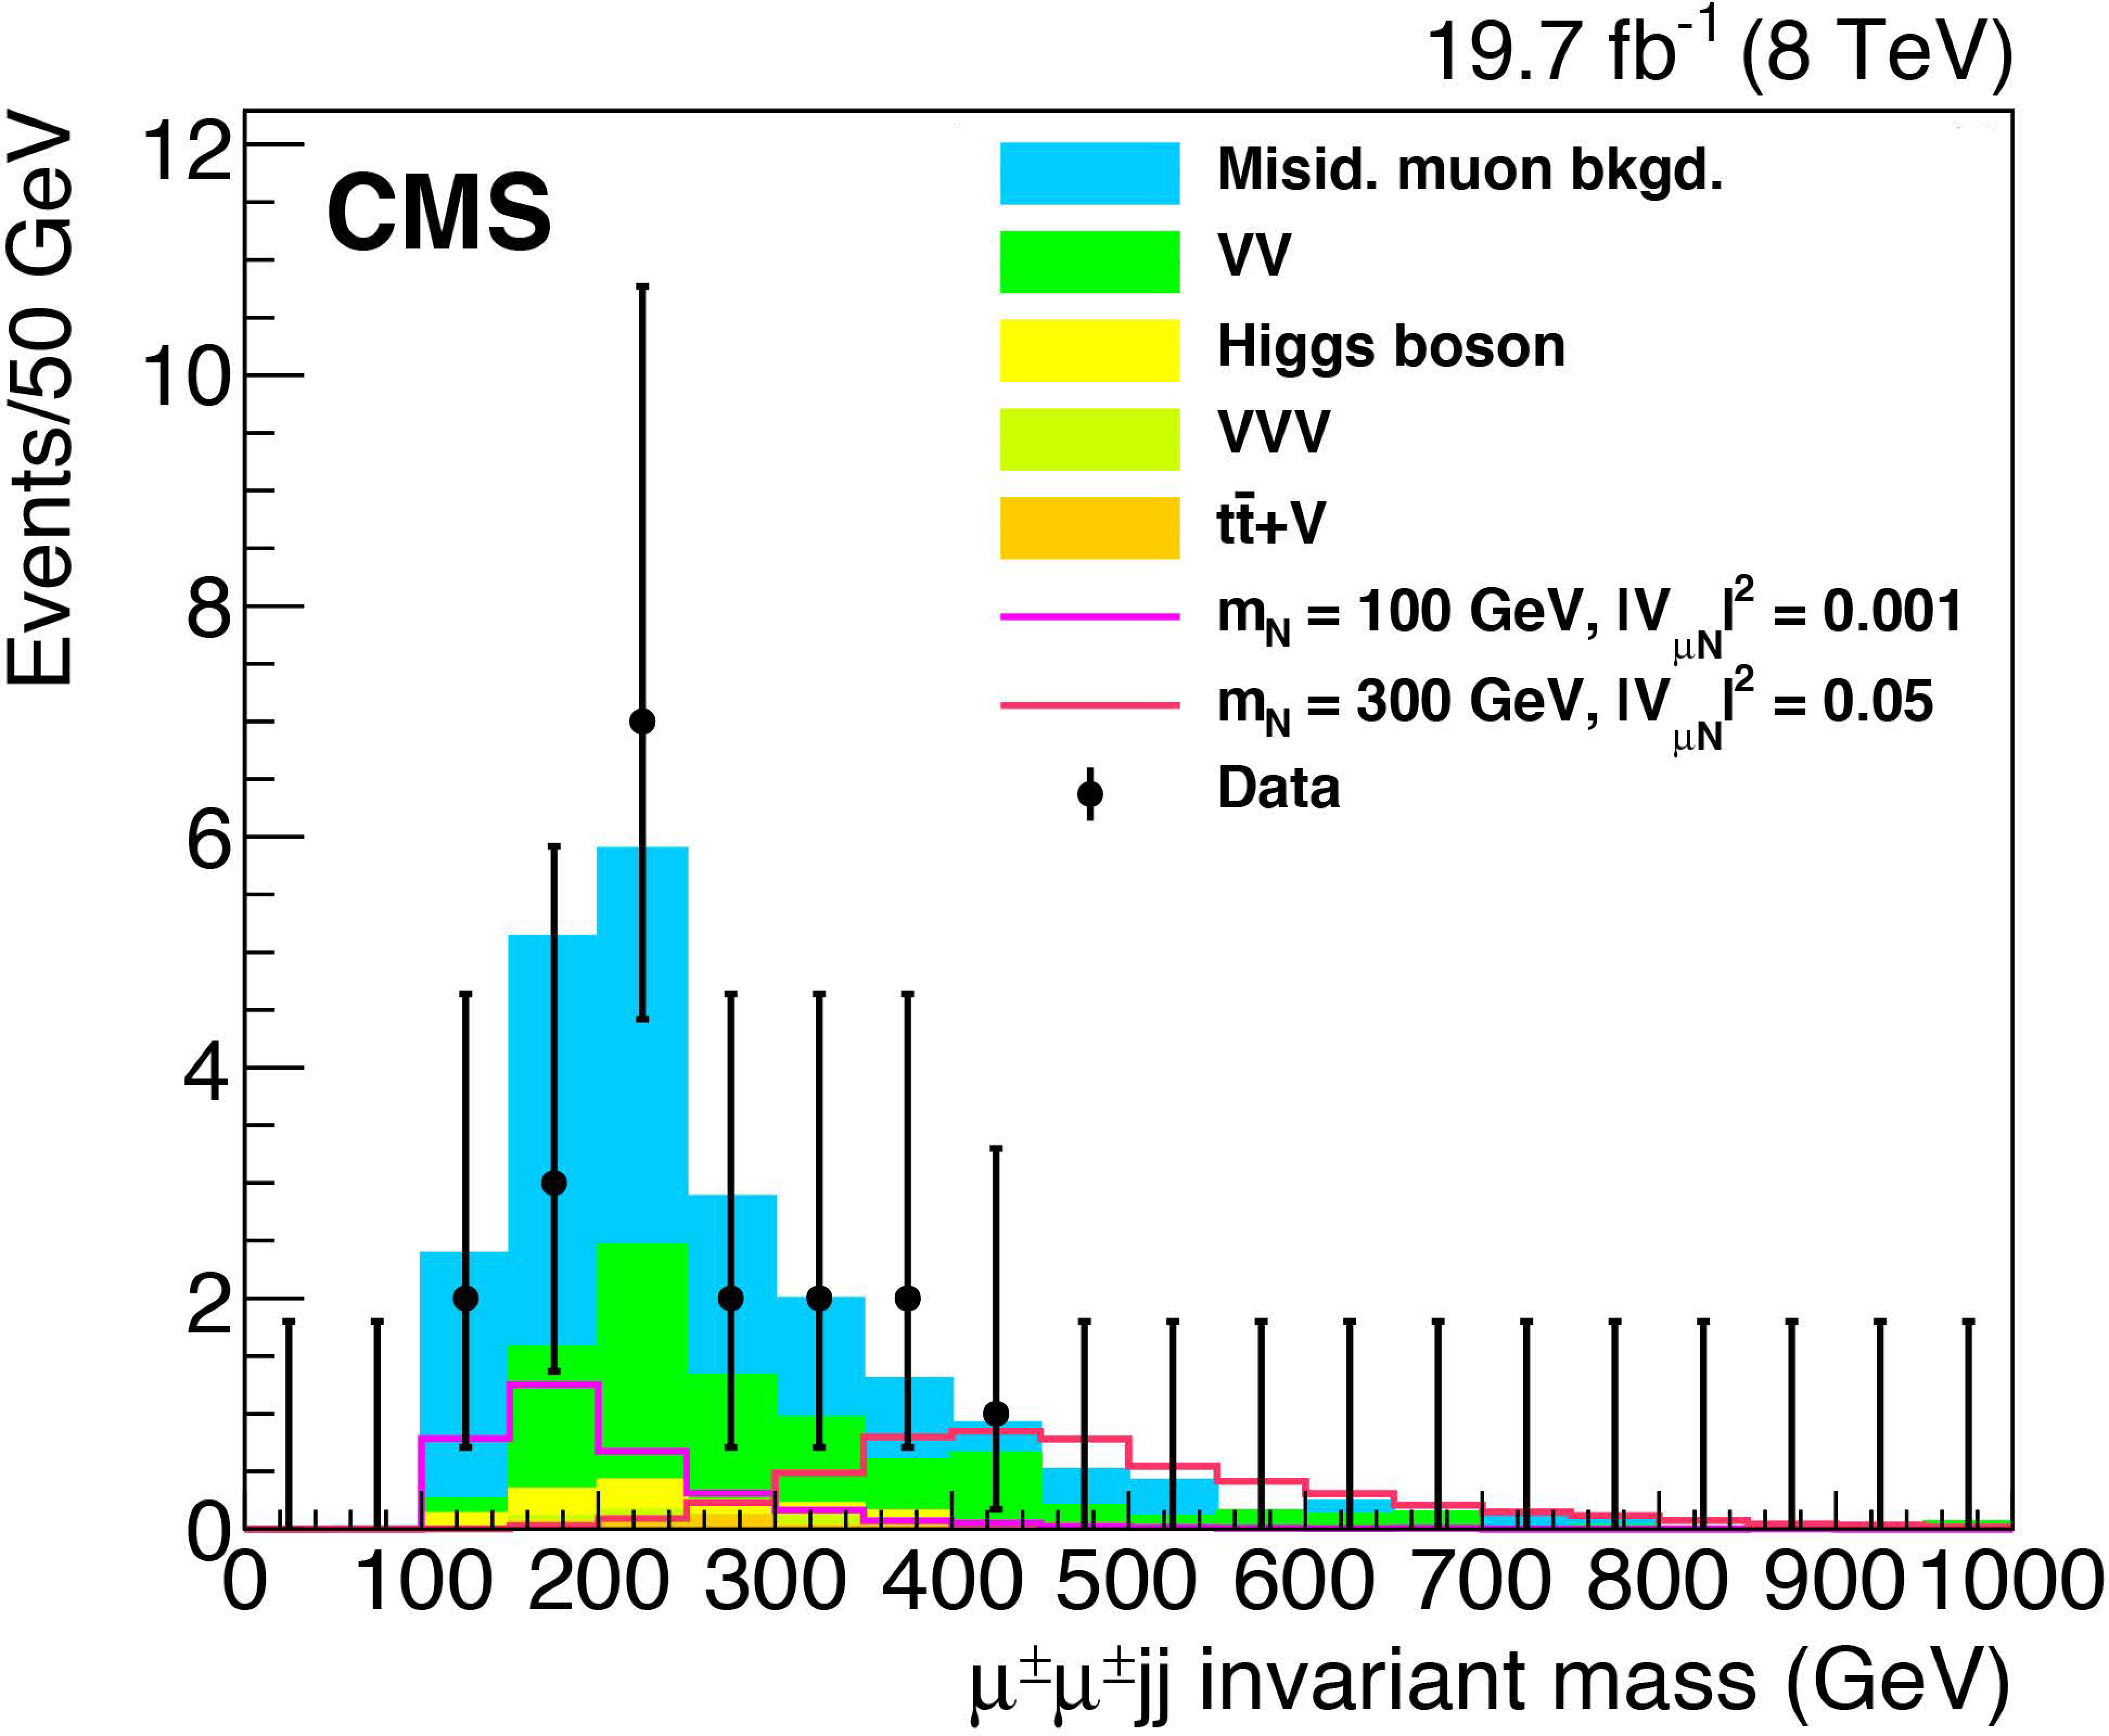
Figure 3-c:
Kinematic distributions for the high-mass region after all selections are applied except for the final optimization requirements: leading muon $ {p_{\mathrm {T}}} $ (top), trailing muon $ {p_{\mathrm {T}}} $ (middle), and $\mu ^\pm \mu ^\pm \mathrm {j j}$ invariant mass (bottom). The plots show the data, backgrounds, and two choices for the heavy Majorana neutrino signal: $ {m_\mathrm {N}} = 100$ GeV , $ {| {V_{\mu \mathrm {N}}} | }^2 = 0.001$ and $ {m_\mathrm {N}} = 300$ GeV , $ {| {V_{\mu \mathrm {N}}} | }^2 = 0.05$. The backgrounds shown are from misidentified muons and from diboson (VV), Higgs boson, triboson (VVV), and $ {\mathrm {t}\overline {\mathrm {t}}} {\mathrm {W}}$ production. |

png pdf |
Figure 4:
Exclusion region at 95% CL in the cross section times branching fraction, as a function of the heavy Majorana neutrino mass. The long-dashed black curve is the expected upper limit, with one and two standard deviation bands shown in dark green and light yellow, respectively. The solid black curve is the observed upper limit. The region above the exclusion curves is ruled out. |

png pdf |
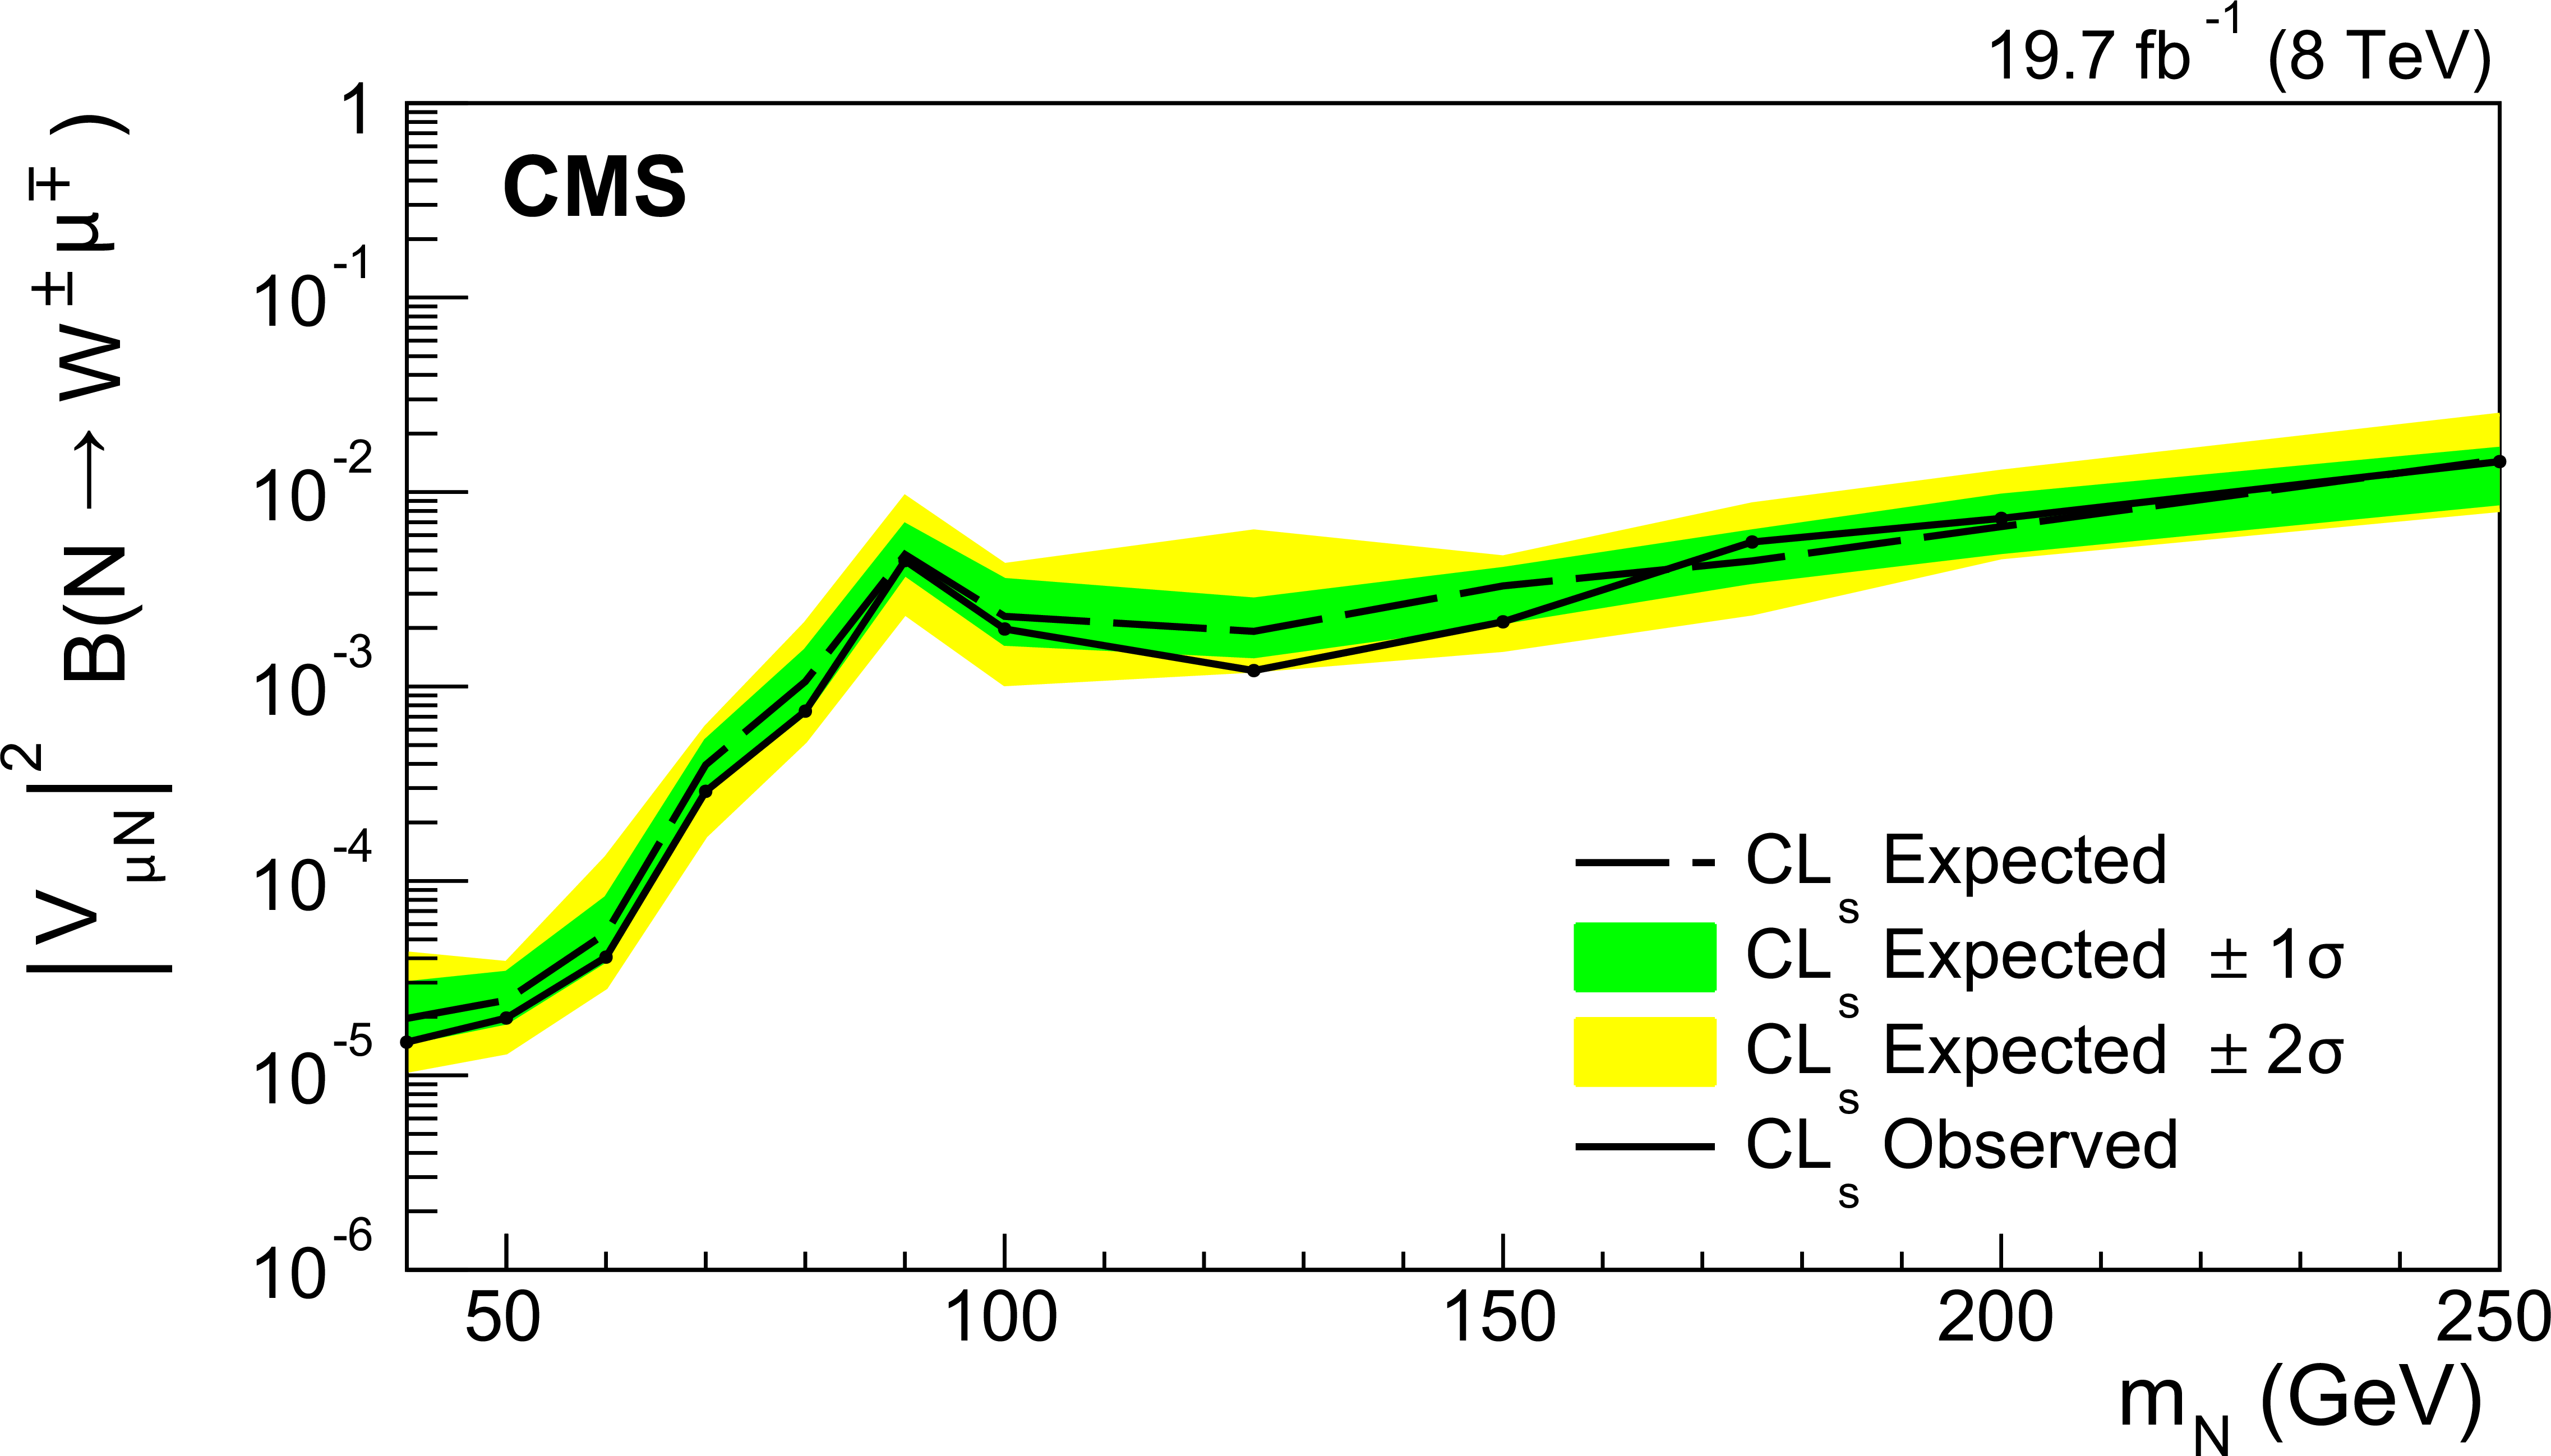
Figure 5-a:
Exclusion region at 95% CL in the square of the heavy Majorana neutrino mixing parameter times branching fraction of the N to a W boson and a muon, as a function of the heavy Majorana neutrino mass: ($ {| {V_{\mu \mathrm {N}}} | }^2 \mathcal {B}( {\mathrm {N}} \to {\mathrm {W}}^\pm \mu ^\mp )$ vs. $ {m_\mathrm {N}} $). The long-dashed black curve is the expected upper limit, with one and two standard deviation bands shown in dark green and light yellow, respectively. The solid black curve is the observed upper limit. The regions above the exclusion curves are ruled out. The lower panel shows an expanded view of the region 40 GeV $ < {m_\mathrm {N}} < $ 250 GeV. |
png pdf |
Figure 5-b:
Exclusion region at 95% CL in the square of the heavy Majorana neutrino mixing parameter times branching fraction of the N to a W boson and a muon, as a function of the heavy Majorana neutrino mass: ($ {| {V_{\mu \mathrm {N}}} | }^2 \mathcal {B}( {\mathrm {N}} \to {\mathrm {W}}^\pm \mu ^\mp )$ vs. $ {m_\mathrm {N}} $). The long-dashed black curve is the expected upper limit, with one and two standard deviation bands shown in dark green and light yellow, respectively. The solid black curve is the observed upper limit. The regions above the exclusion curves are ruled out. The lower panel shows an expanded view of the region 40 GeV $ < {m_\mathrm {N}} < $ 250 GeV. |

png pdf |
Figure 6-a:
Exclusion region at 95% CL in the square of the heavy Majorana neutrino mixing parameter as a function of the heavy Majorana neutrino mass: ($ {| {V_{\mu \mathrm {N}}} | }^2$ vs. $ {m_\mathrm {N}} $). The long-dashed black curve is the expected upper limit, with one and two standard deviation bands shown in dark green and light yellow, respectively. The solid black curve is the observed upper limit. Also shown are the upper limits from other direct searches: L3, DELPHI, and the upper limits from CMS obtained with the 2011 LHC data at $\sqrt{s} =$ 7 TeV. The regions above the exclusion curves are ruled out. The lower panel shows an expanded view of the region 40 GeV $ < {m_\mathrm {N}} < $ 250 GeV. |
png pdf |
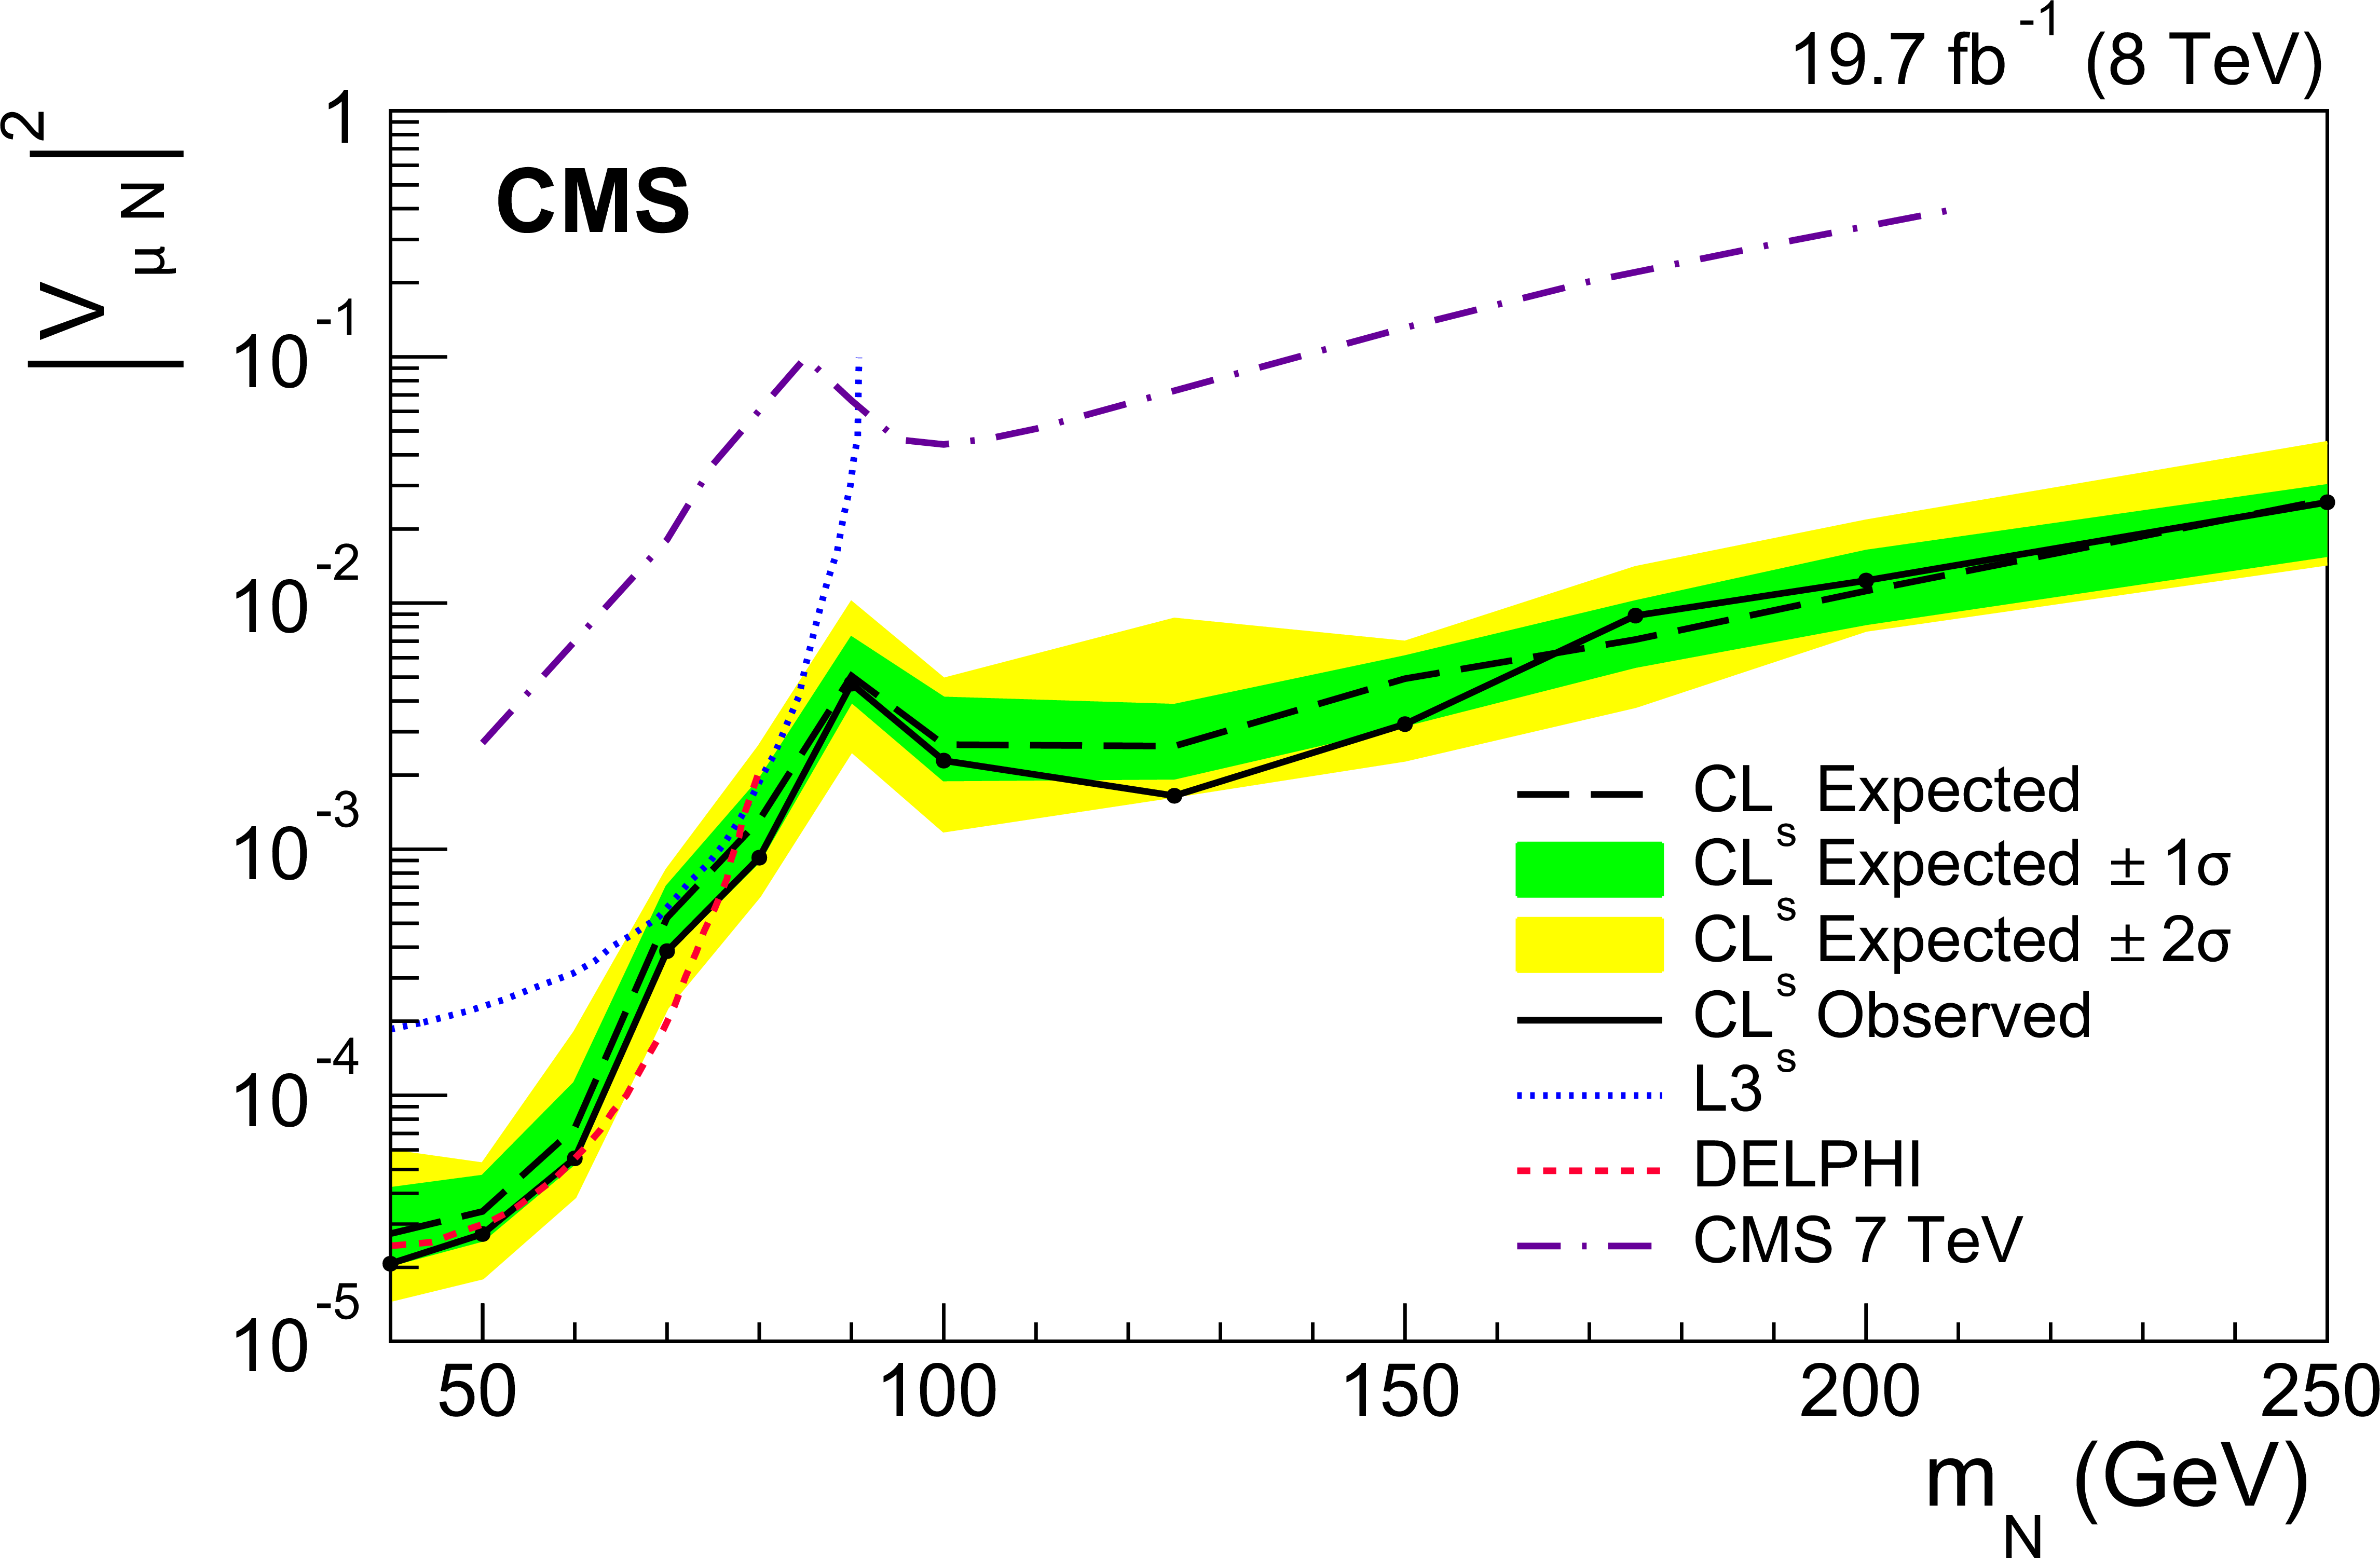
Figure 6-b:
Exclusion region at 95% CL in the square of the heavy Majorana neutrino mixing parameter as a function of the heavy Majorana neutrino mass: ($ {| {V_{\mu \mathrm {N}}} | }^2$ vs. $ {m_\mathrm {N}} $). The long-dashed black curve is the expected upper limit, with one and two standard deviation bands shown in dark green and light yellow, respectively. The solid black curve is the observed upper limit. Also shown are the upper limits from other direct searches: L3, DELPHI, and the upper limits from CMS obtained with the 2011 LHC data at $\sqrt{s} =$ 7 TeV. The regions above the exclusion curves are ruled out. The lower panel shows an expanded view of the region 40 GeV $ < {m_\mathrm {N}} < $ 250 GeV. |
|
|
Compact Muon Solenoid LHC, CERN |
|

|

|

|

|

|