

Compact Muon Solenoid
LHC, CERN
| CMS-EXO-13-007 ; CERN-PH-EP-2015-010 | ||
| Search for narrow high-mass resonances in proton-proton collisions at $\sqrt{s}$ = 8 TeV decaying to Z and Higgs bosons | ||
| CMS Collaboration | ||
| 17 February 2015 | ||
| Phys. Lett. B 748 (2015) 255 | ||
| Abstract: The first search for a narrow, high-mass resonance decaying into Z and Higgs (H) bosons is presented. The final state studied consists of a merged jet pair and a $\tau$ pair resulting from the decays of Z and H bosons, respectively. The analysis is based on a data sample of proton-proton collisions at a center-of-mass energy of 8 TeV, collected with the CMS experiment in 2012, and corresponding to an integrated luminosity of 19.7 fb$^{-1}$. In the resonance mass range of interest, the Z and H bosons are produced with large momenta, which implies that the final products of the two quarks or the two $\tau$ leptons must be detected within a small angular interval. From a combination of all possible decay modes of the $\tau$ leptons, production cross sections in a range between 0.9 and 27.8 fb are excluded at 95% confidence level, depending on the resonance mass. | ||
| Links: e-print arXiv:1502.04994 [hep-ex] (PDF) ; CDS record ; inSPIRE record ; Public twiki page ; CADI line (restricted) ; | ||
| Figures | |
png pdf |
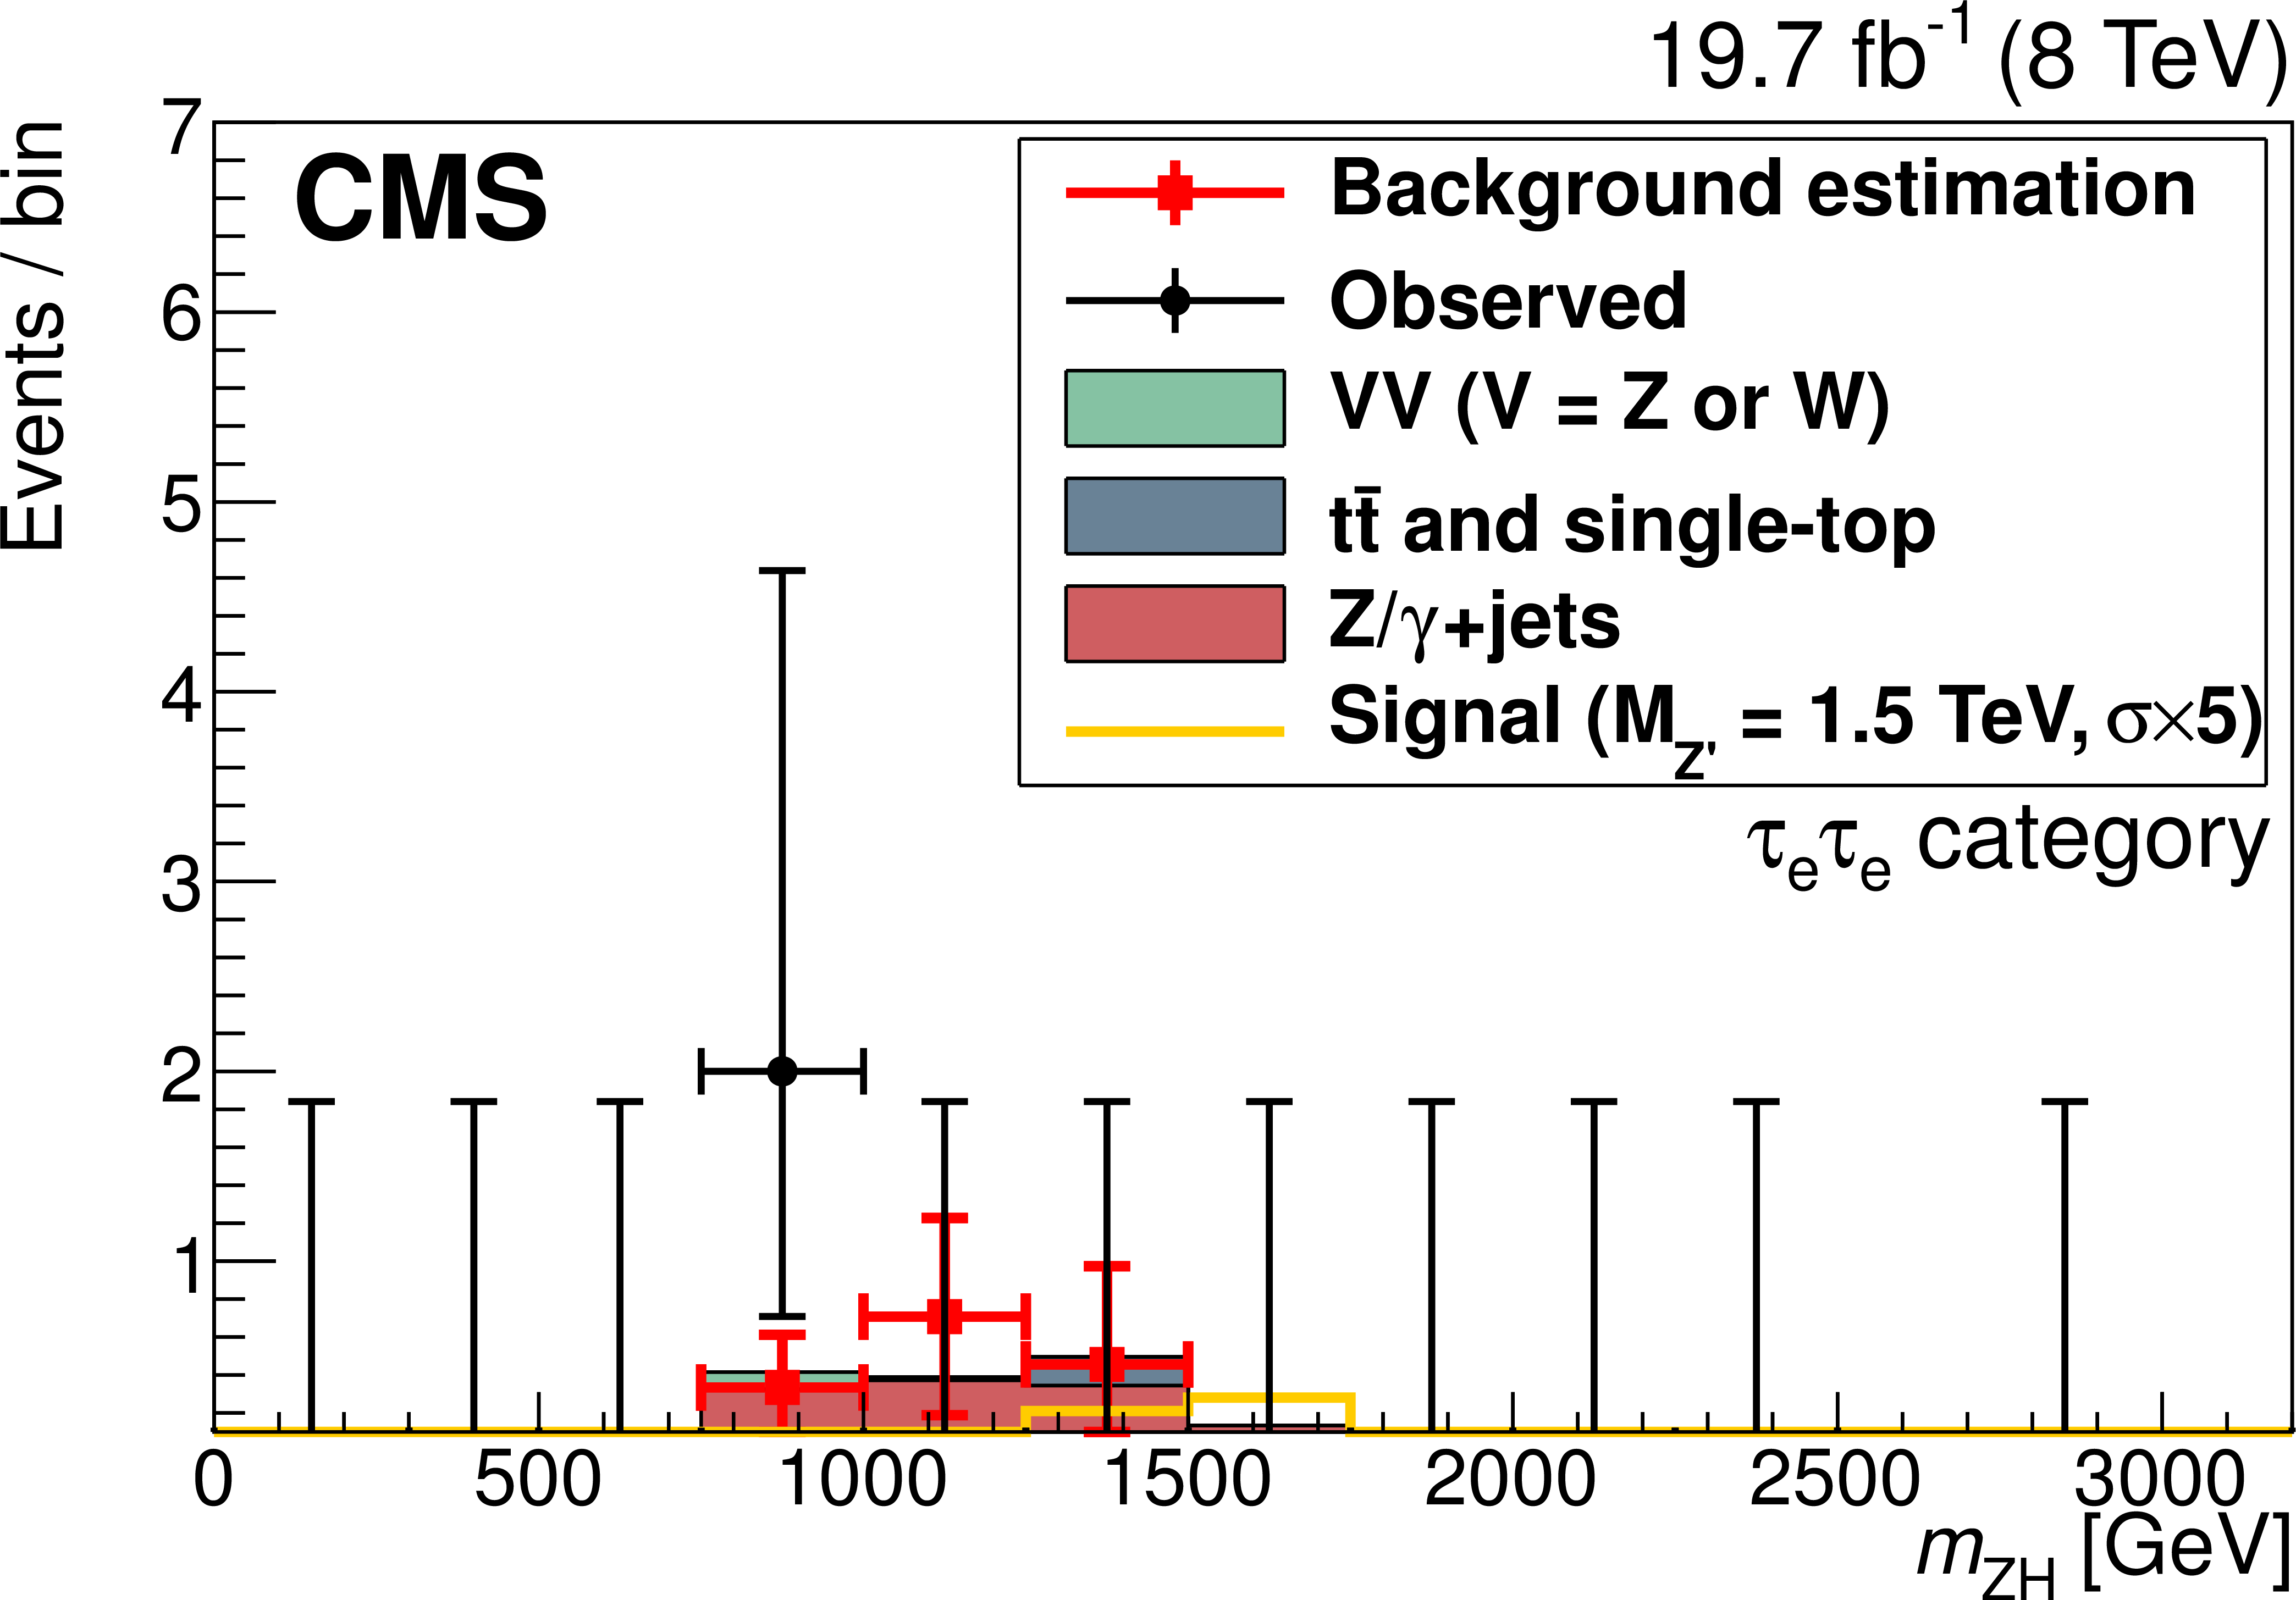
Figure 1-a:
Observed distributions of $ {m_{ {\mathrm {Z}} {\mathrm {H}} }} $ for the all-leptonic channels along with the corresponding MC expectations for signal and background, as well as background estimation derived from data: (a) $ {\tau _{ {\mathrm {e}}} } {\tau _{ {\mathrm {e}}} } $ category; (b) $ {\tau _{ {\mathrm {e}}} } {\tau _{{\mu }} } $ category; (c) $ {\tau _{{\mu }} } {\tau _{{\mu }} }$ category. Ten equal-size histogram bins cover the region from 0 to 2.5 TeV, while a single bin is used at higher $ {m_{ {\mathrm {Z}} {\mathrm {H}} }} $ because of the limited number of MC and data events. The signal cross section is scaled by a factor of 5. |
png pdf |
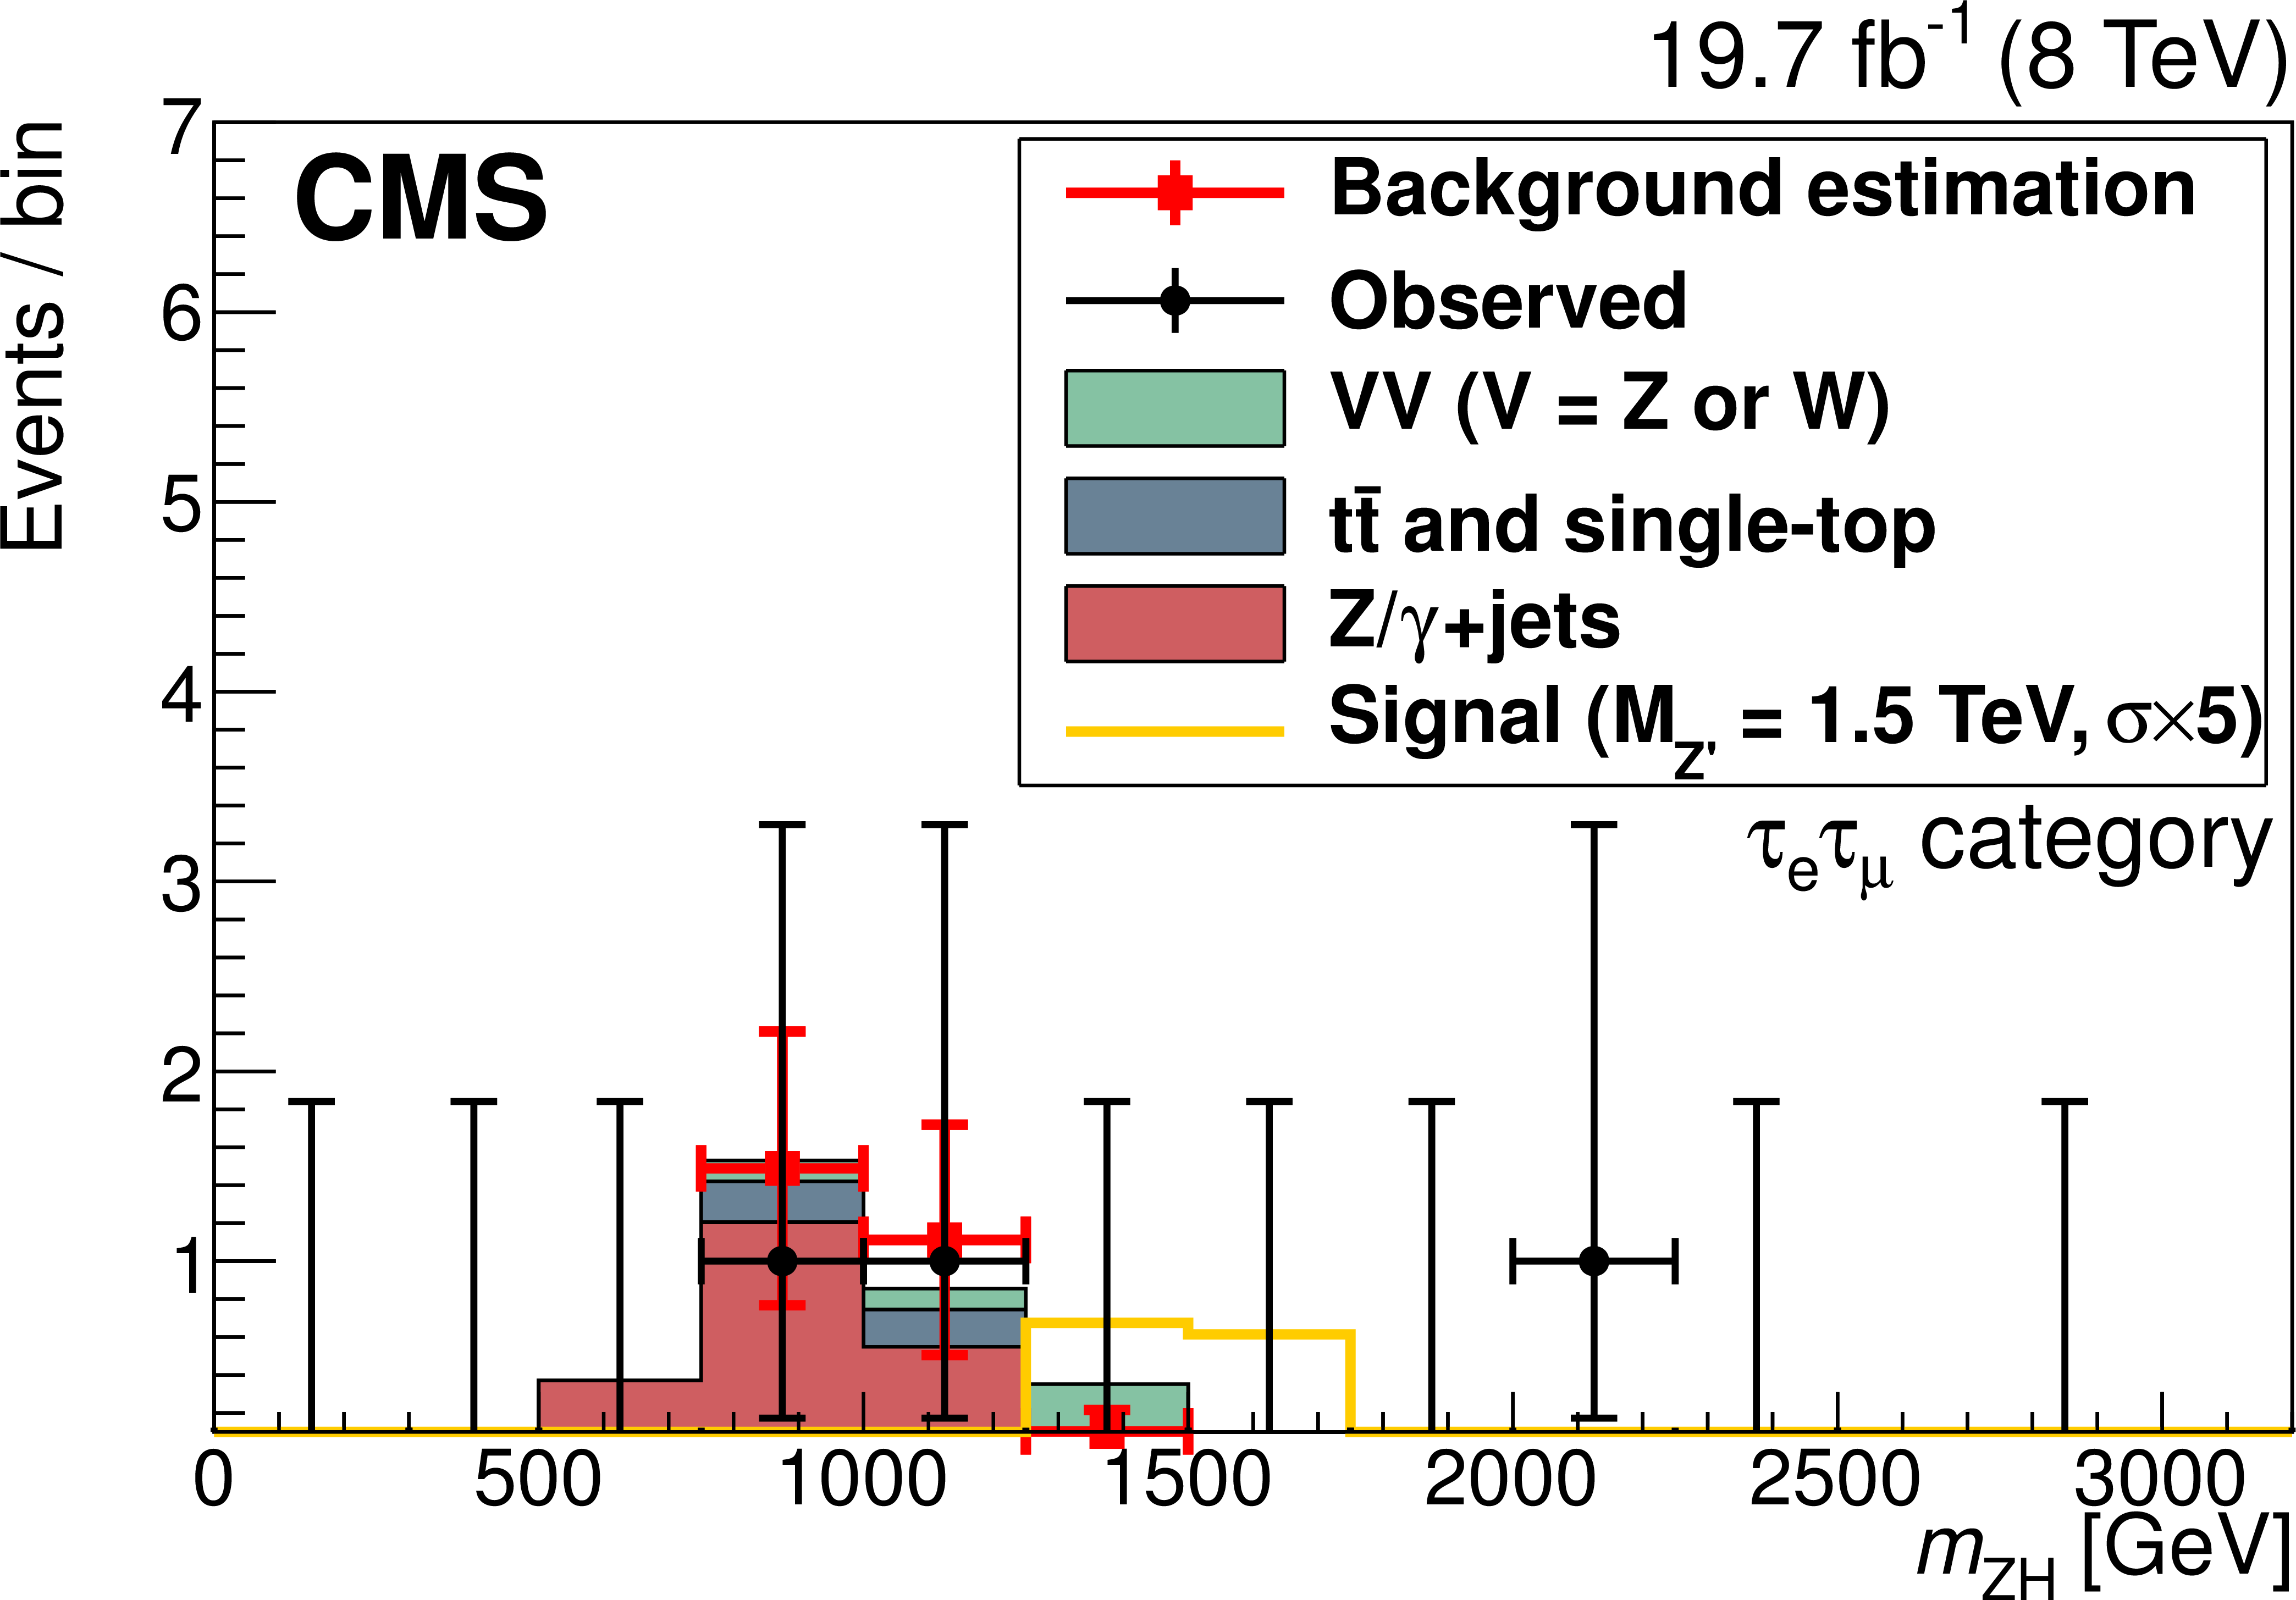
Figure 1-b:
Observed distributions of $ {m_{ {\mathrm {Z}} {\mathrm {H}} }} $ for the all-leptonic channels along with the corresponding MC expectations for signal and background, as well as background estimation derived from data: (a) $ {\tau _{ {\mathrm {e}}} } {\tau _{ {\mathrm {e}}} } $ category; (b) $ {\tau _{ {\mathrm {e}}} } {\tau _{{\mu }} } $ category; (c) $ {\tau _{{\mu }} } {\tau _{{\mu }} }$ category. Ten equal-size histogram bins cover the region from 0 to 2.5 TeV, while a single bin is used at higher $ {m_{ {\mathrm {Z}} {\mathrm {H}} }} $ because of the limited number of MC and data events. The signal cross section is scaled by a factor of 5. |
png pdf |
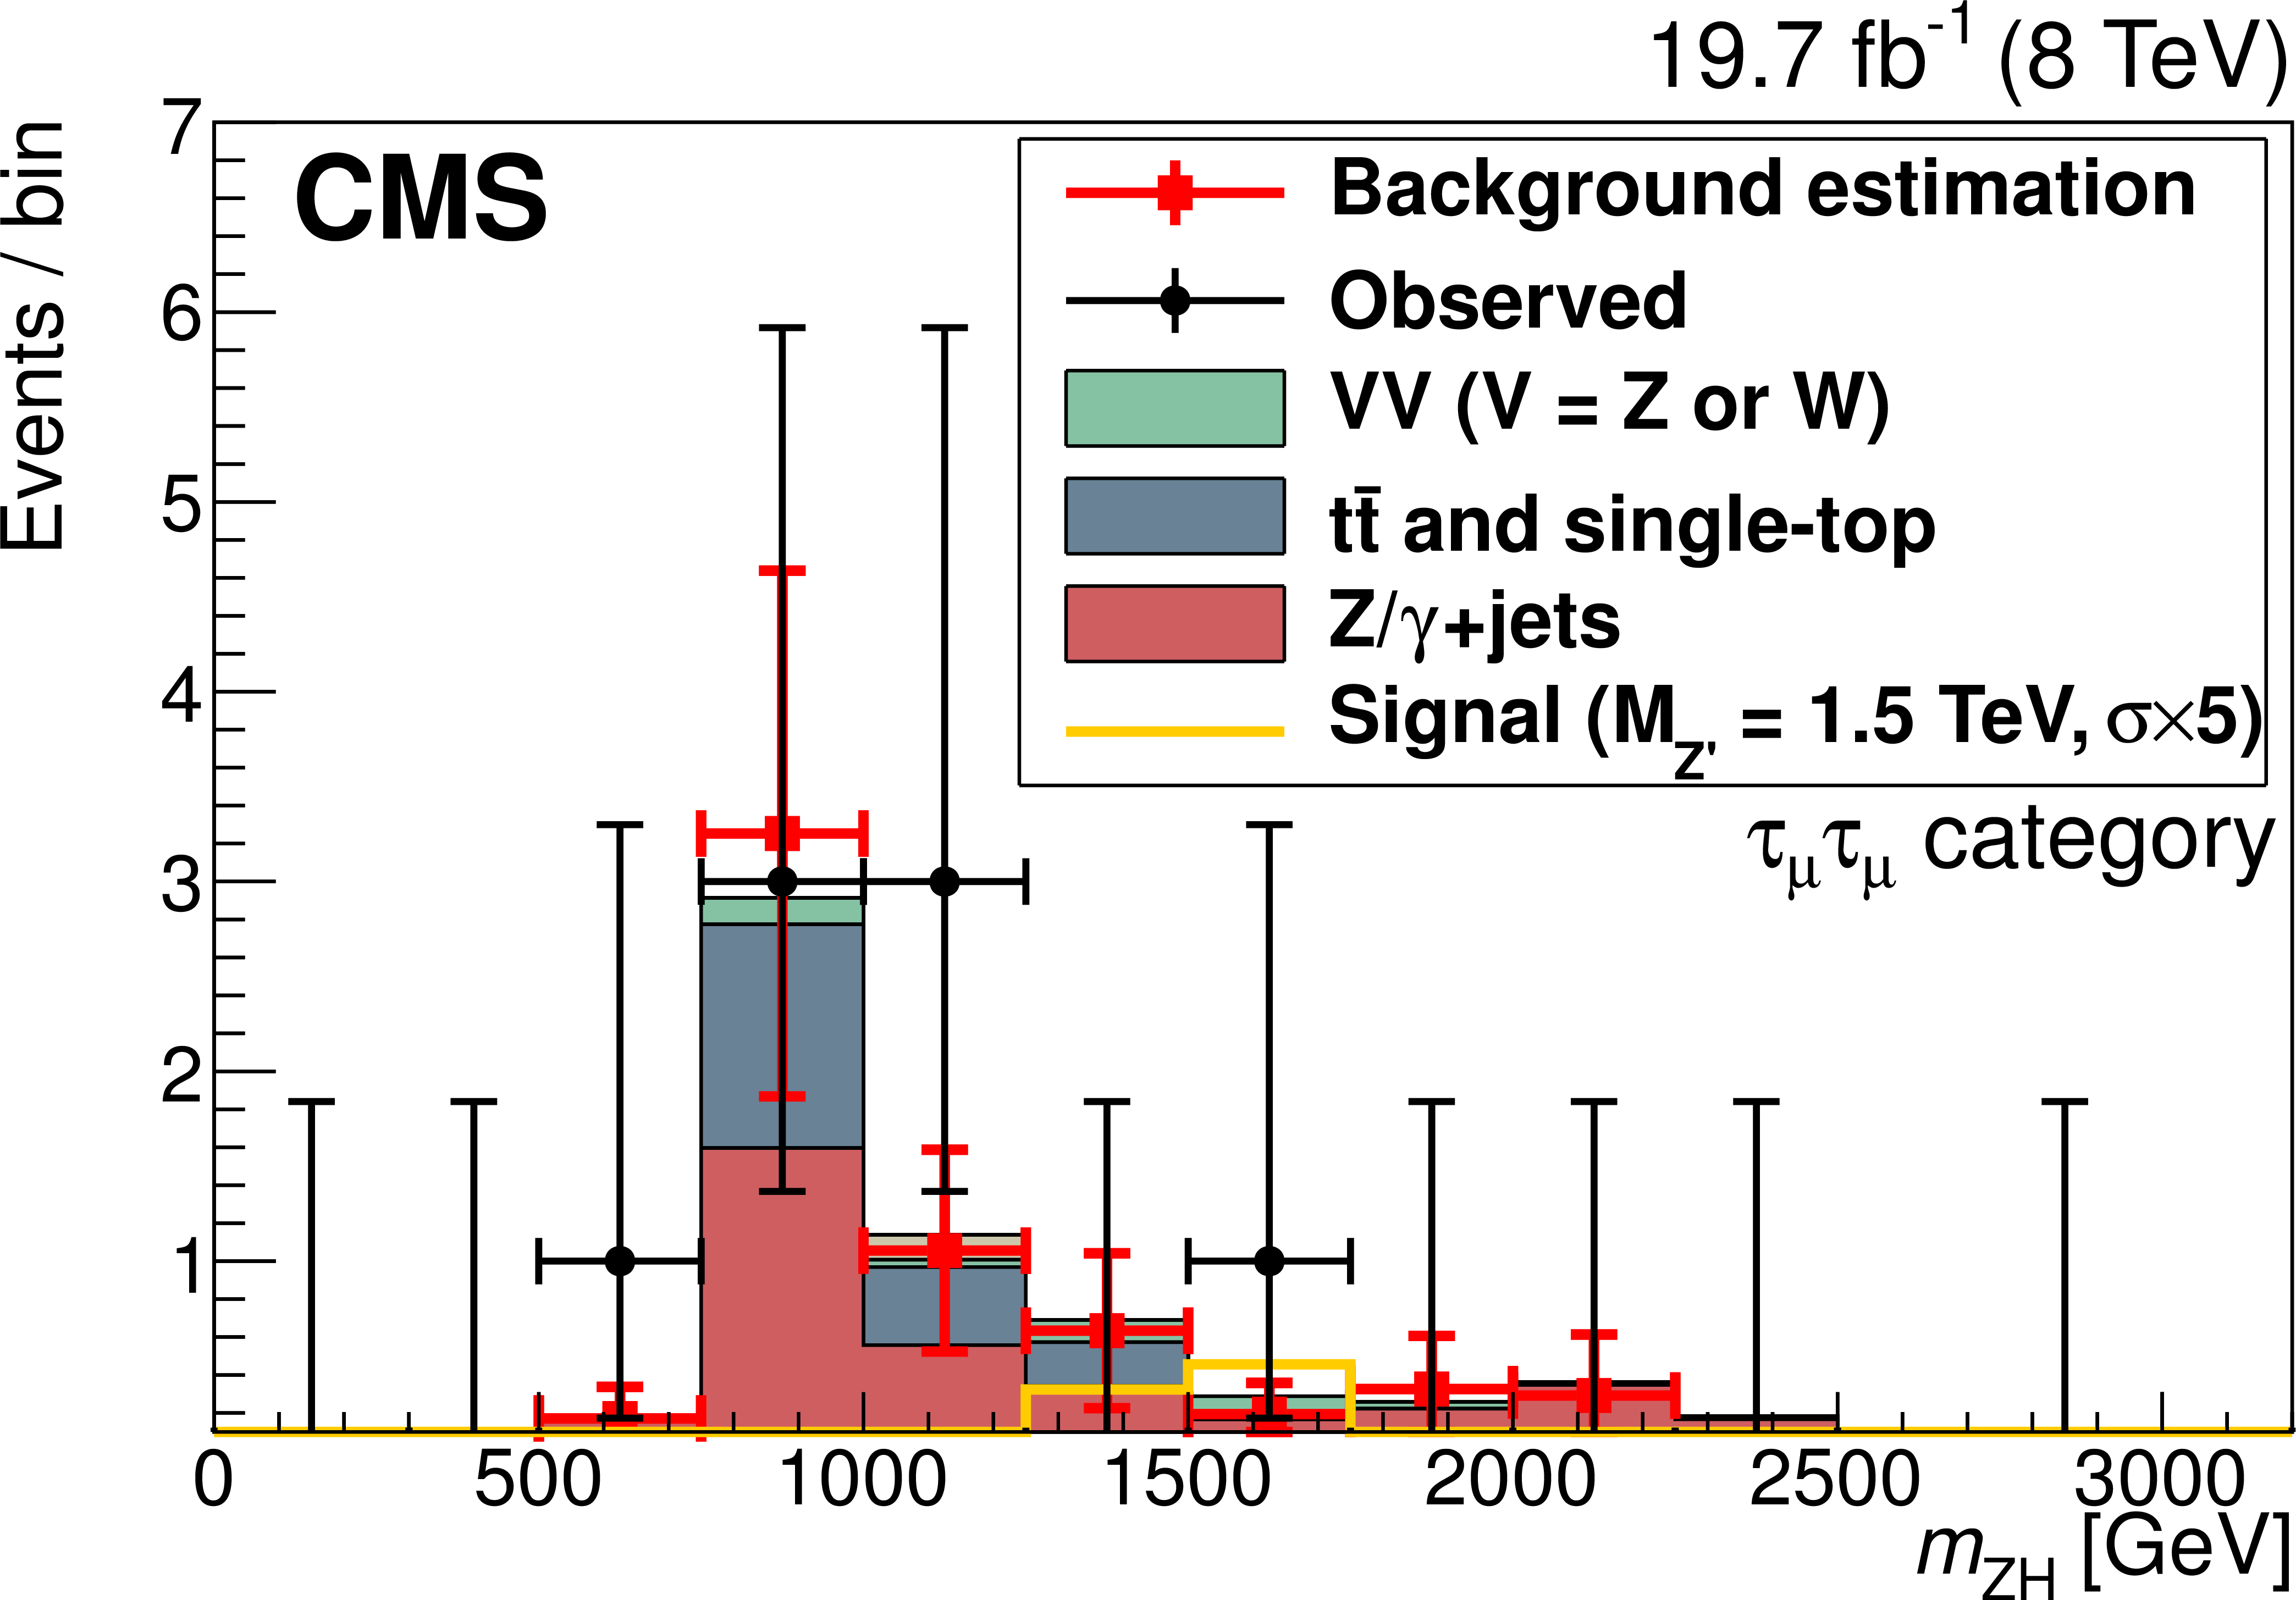
Figure 1-c:
Observed distributions of $ {m_{ {\mathrm {Z}} {\mathrm {H}} }} $ for the all-leptonic channels along with the corresponding MC expectations for signal and background, as well as background estimation derived from data: (a) $ {\tau _{ {\mathrm {e}}} } {\tau _{ {\mathrm {e}}} } $ category; (b) $ {\tau _{ {\mathrm {e}}} } {\tau _{{\mu }} } $ category; (c) $ {\tau _{{\mu }} } {\tau _{{\mu }} }$ category. Ten equal-size histogram bins cover the region from 0 to 2.5 TeV, while a single bin is used at higher $ {m_{ {\mathrm {Z}} {\mathrm {H}} }} $ because of the limited number of MC and data events. The signal cross section is scaled by a factor of 5. |
png pdf |
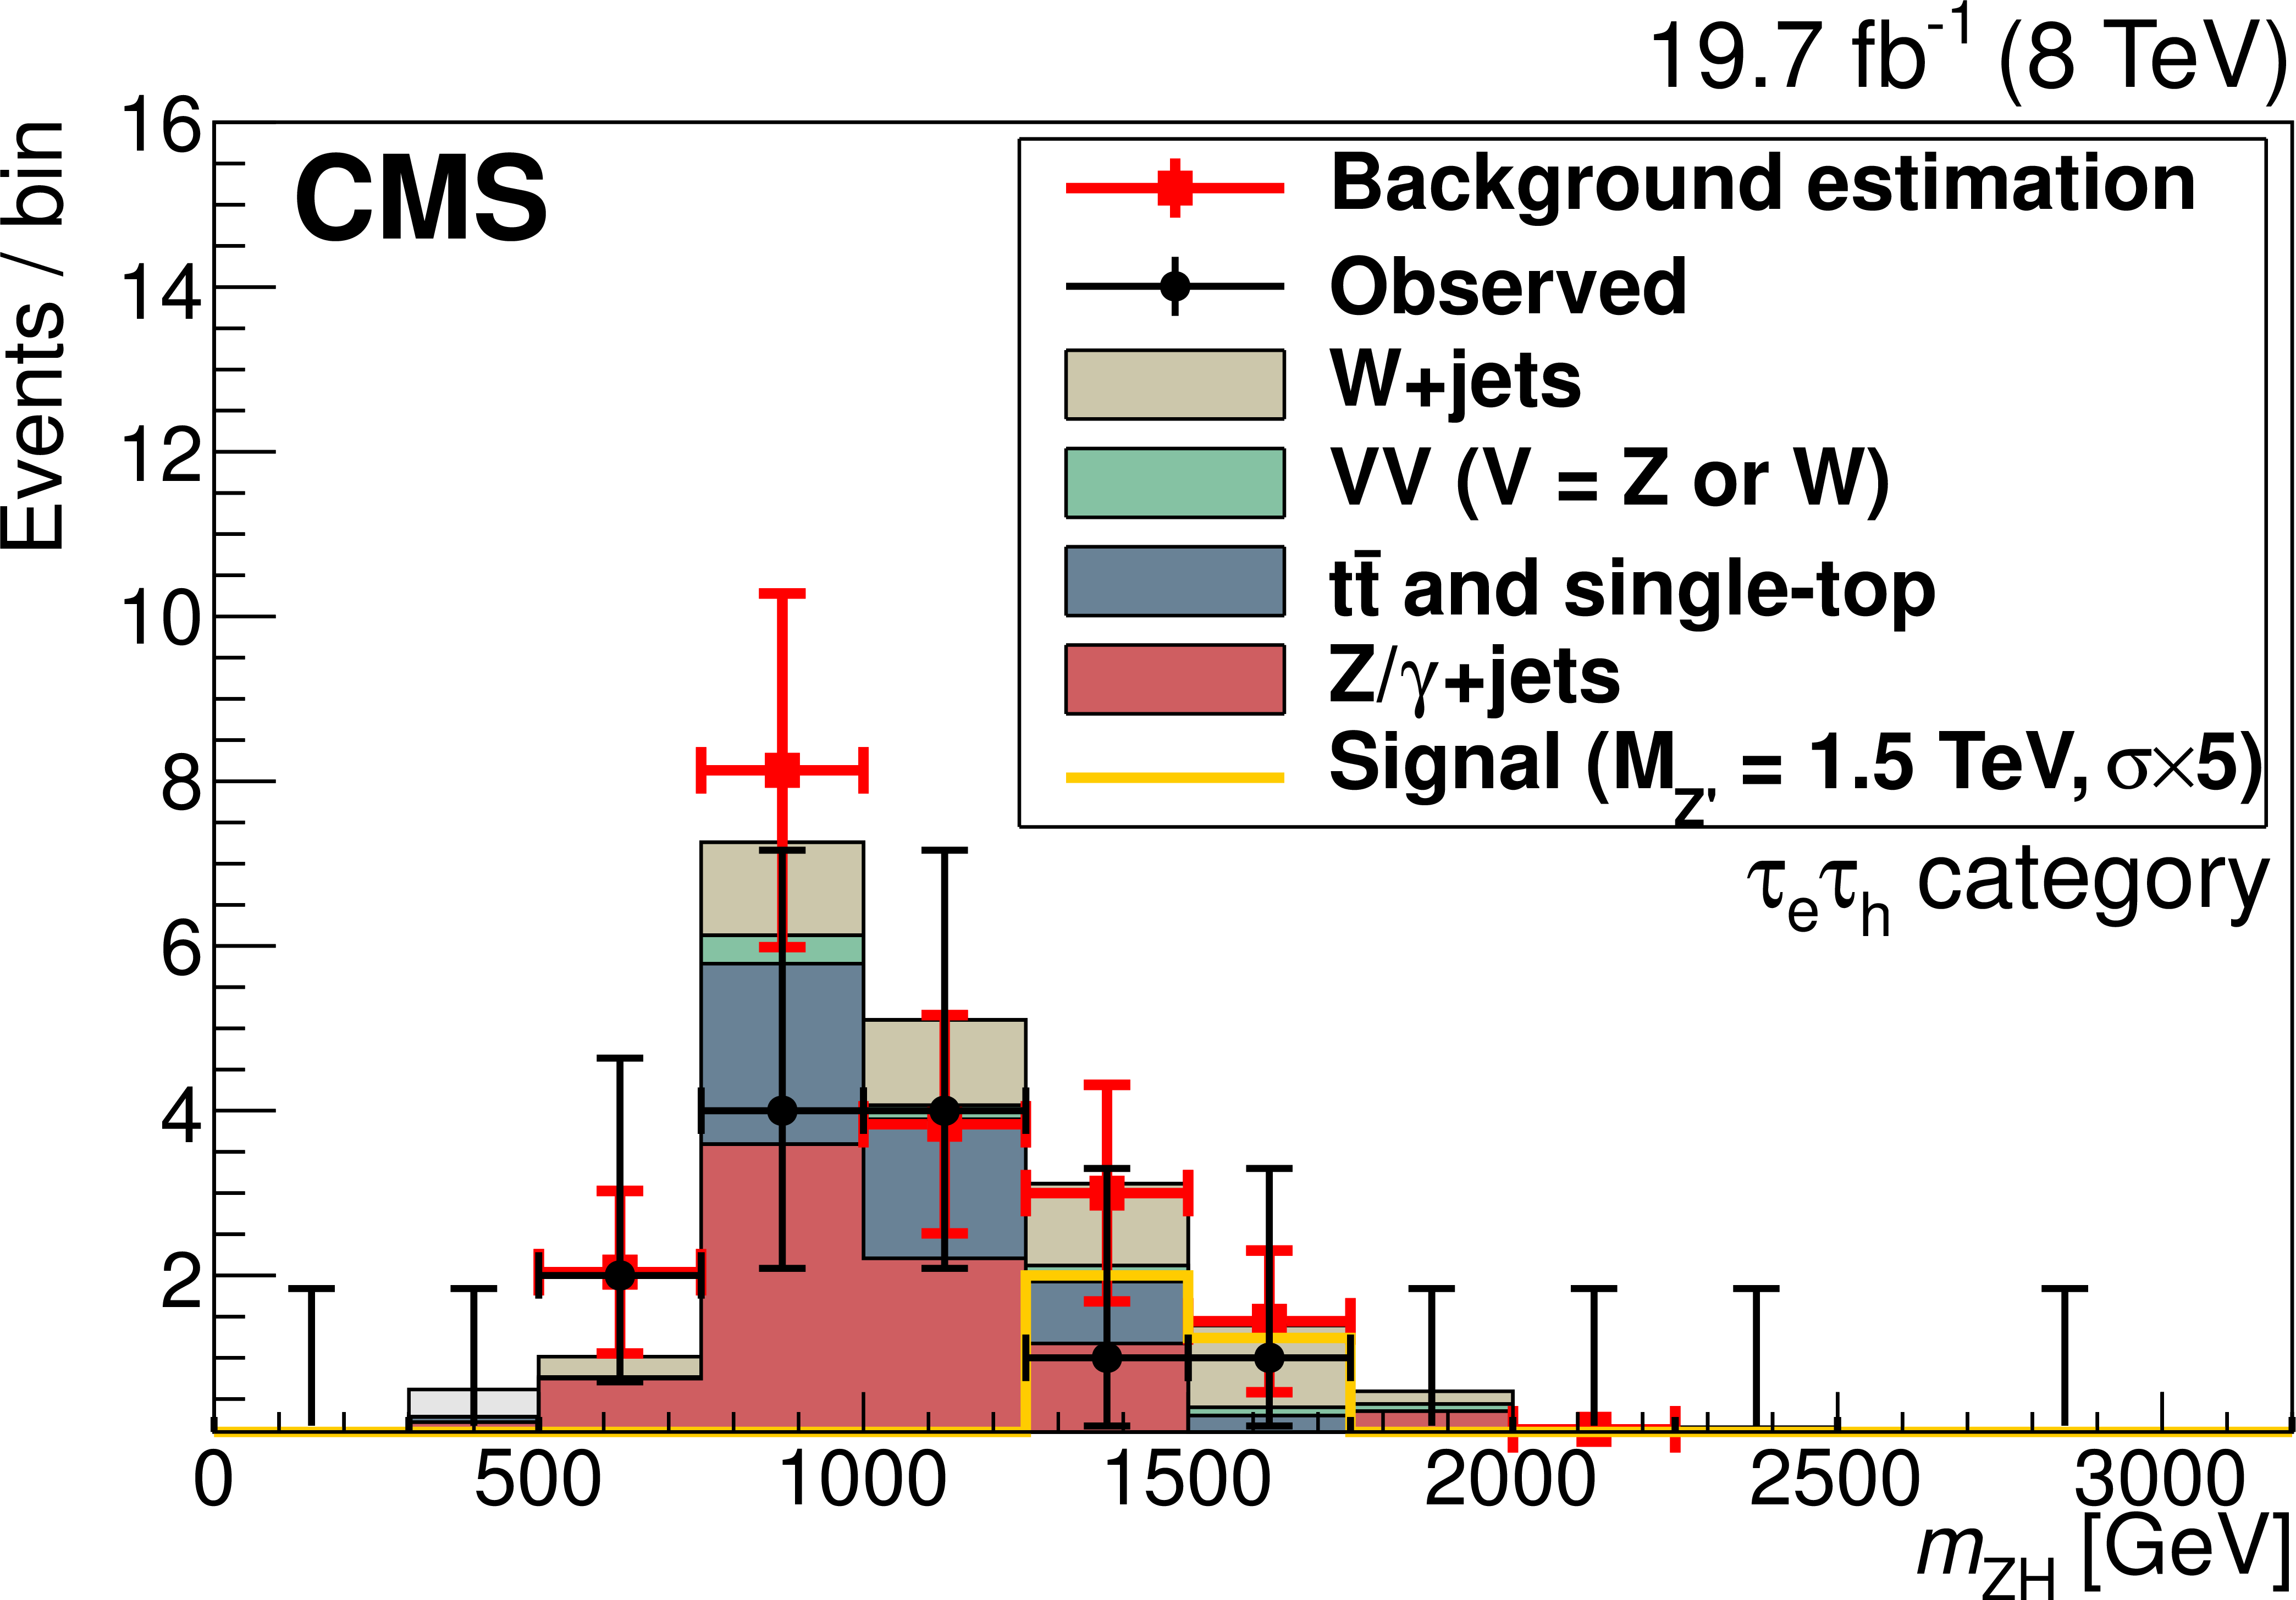
Figure 2-a:
Observed distributions of $ {m_{ {\mathrm {Z}} {\mathrm {H}} }} $ for the semileptonic channels along with the corresponding MC expectations for signal and background, as well as background estimation derived from data: (a) $ {\tau _{ {\mathrm {e}}} } {\tau _\mathrm {h}} $ category; (b) $ {\tau _{{\mu }} } {\tau _\mathrm {h}} $ category. Ten equal-size histogram bins cover the region from 0 to 2.5 TeV, while a single bin is used at higher ${m_{ {\mathrm {Z}} {\mathrm {H}} }} $ because of the limited number of MC and data events. The signal cross section is scaled by a factor of 5. |
png pdf |
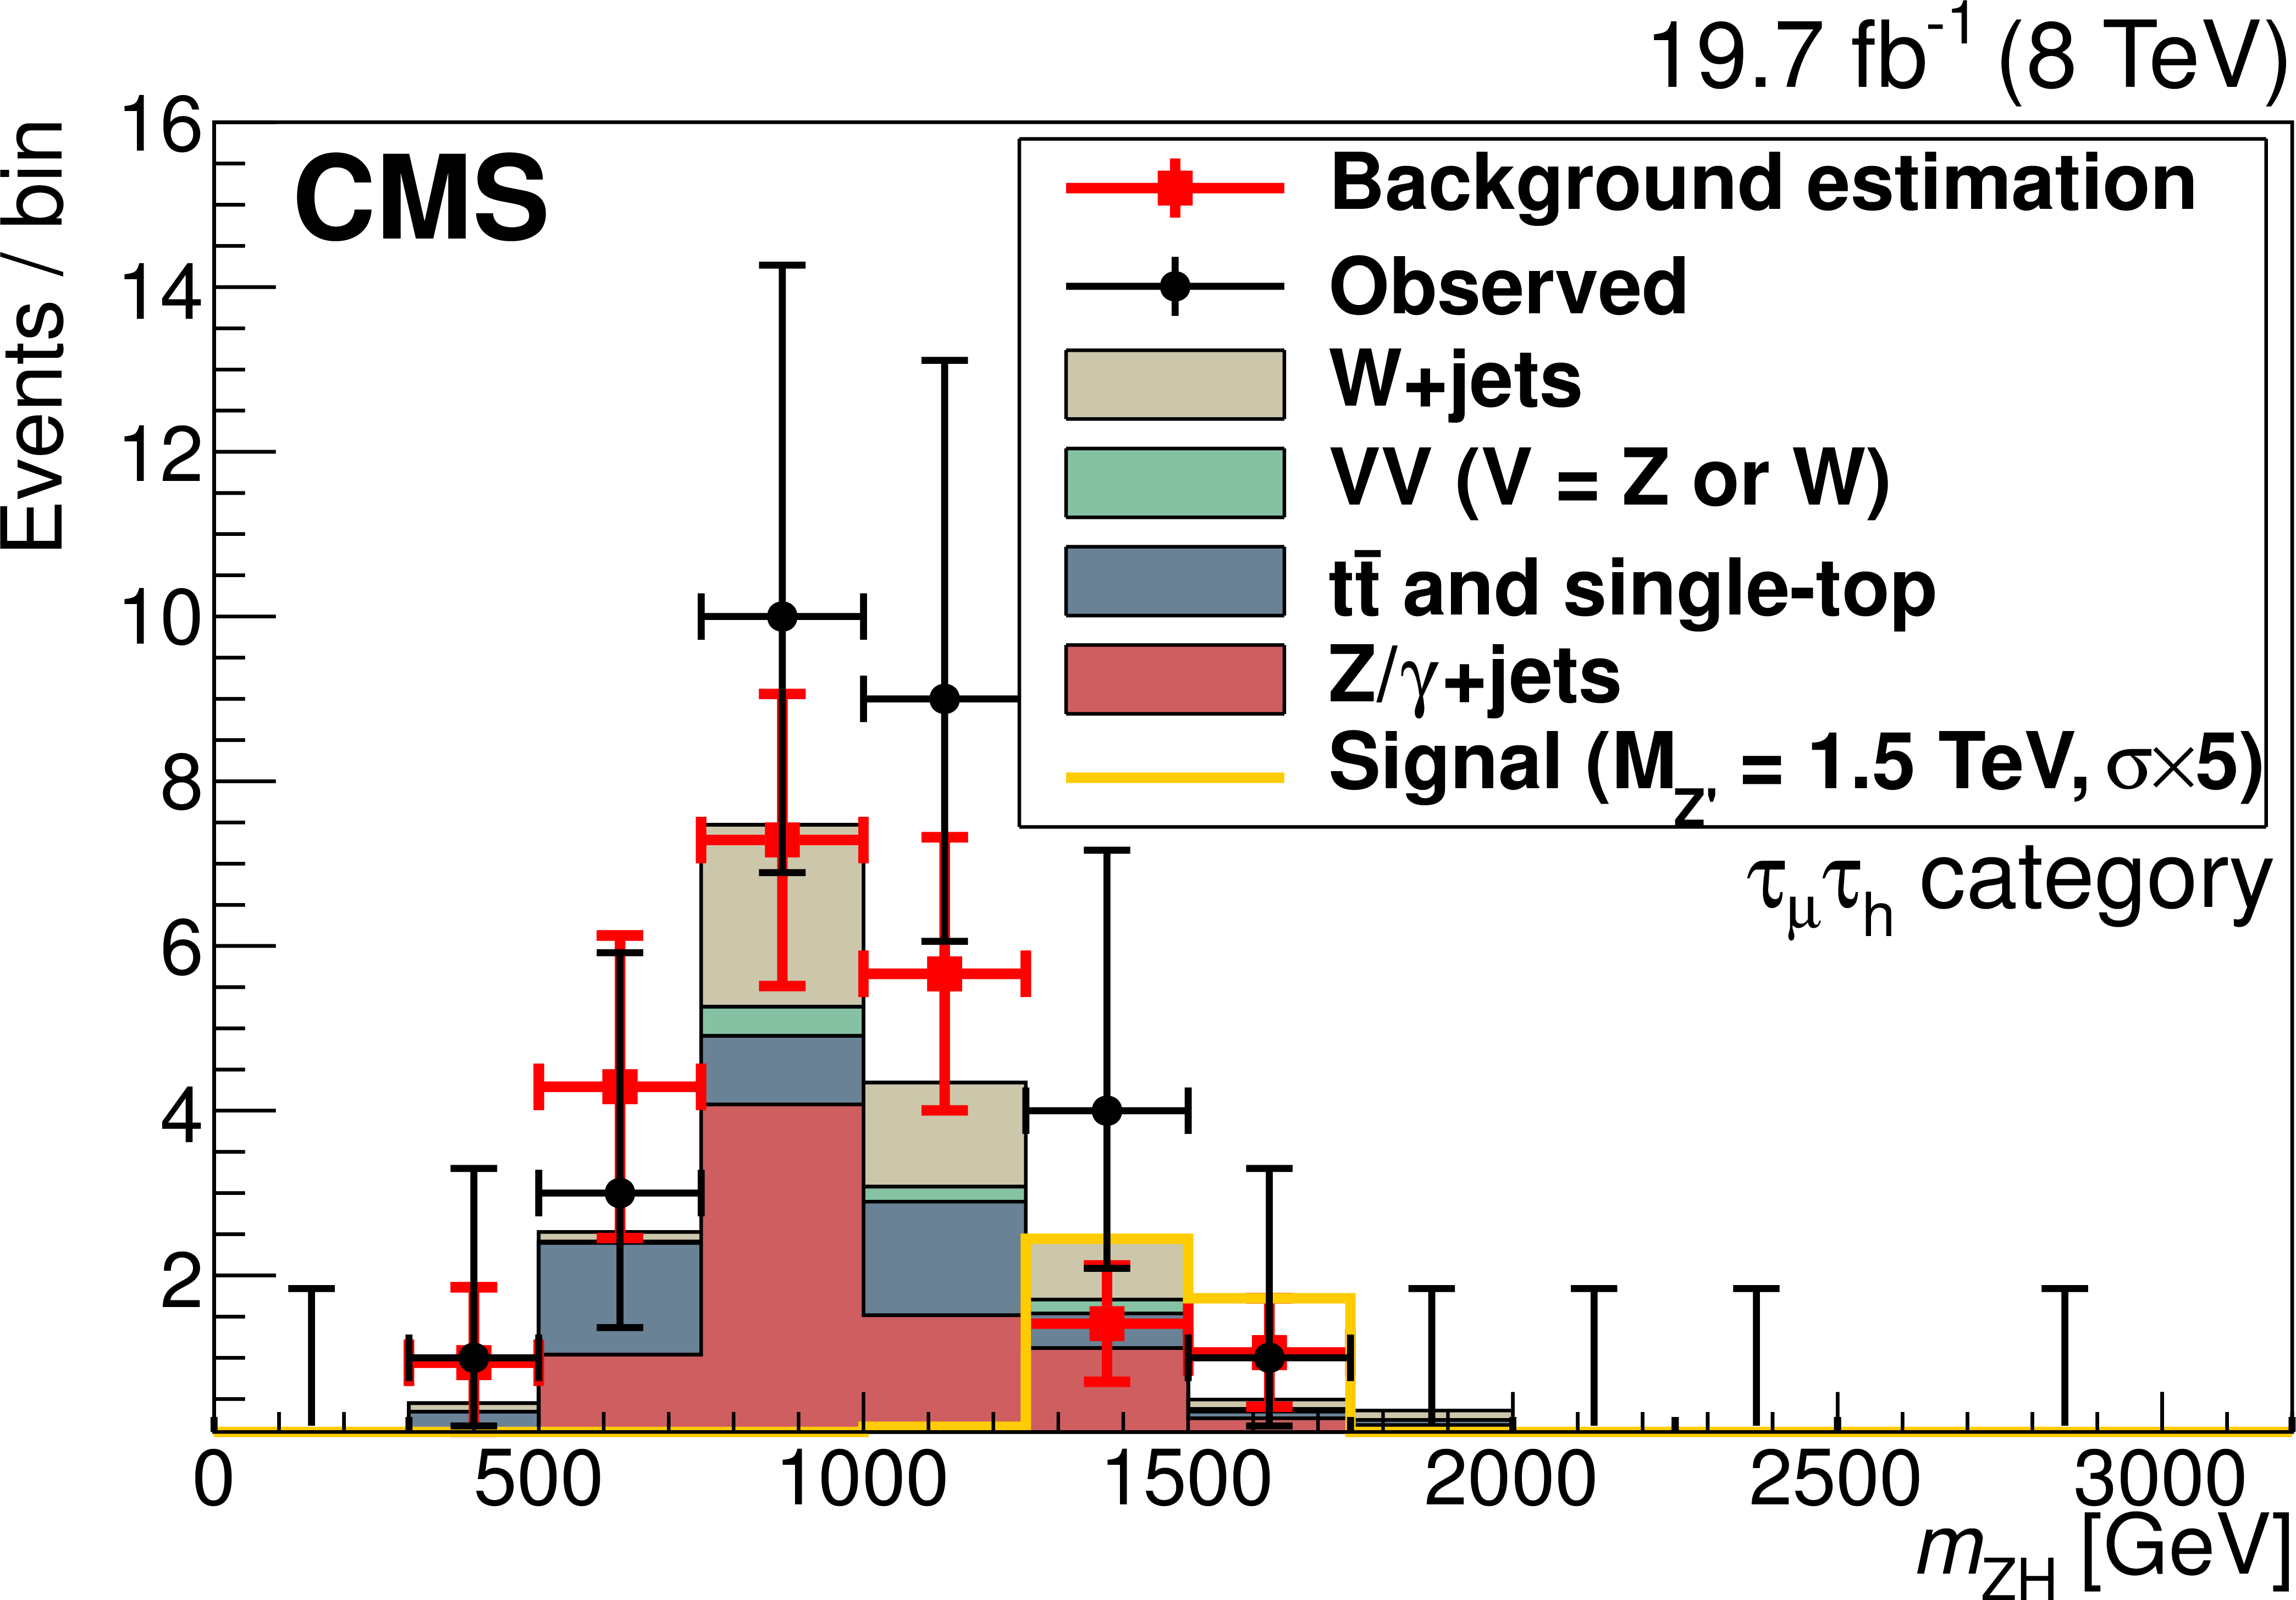
Figure 2-b:
Observed distributions of $ {m_{ {\mathrm {Z}} {\mathrm {H}} }} $ for the semileptonic channels along with the corresponding MC expectations for signal and background, as well as background estimation derived from data: (a) $ {\tau _{ {\mathrm {e}}} } {\tau _\mathrm {h}} $ category; (b) $ {\tau _{{\mu }} } {\tau _\mathrm {h}} $ category. Ten equal-size histogram bins cover the region from 0 to 2.5 TeV, while a single bin is used at higher ${m_{ {\mathrm {Z}} {\mathrm {H}} }} $ because of the limited number of MC and data events. The signal cross section is scaled by a factor of 5. |
png pdf |
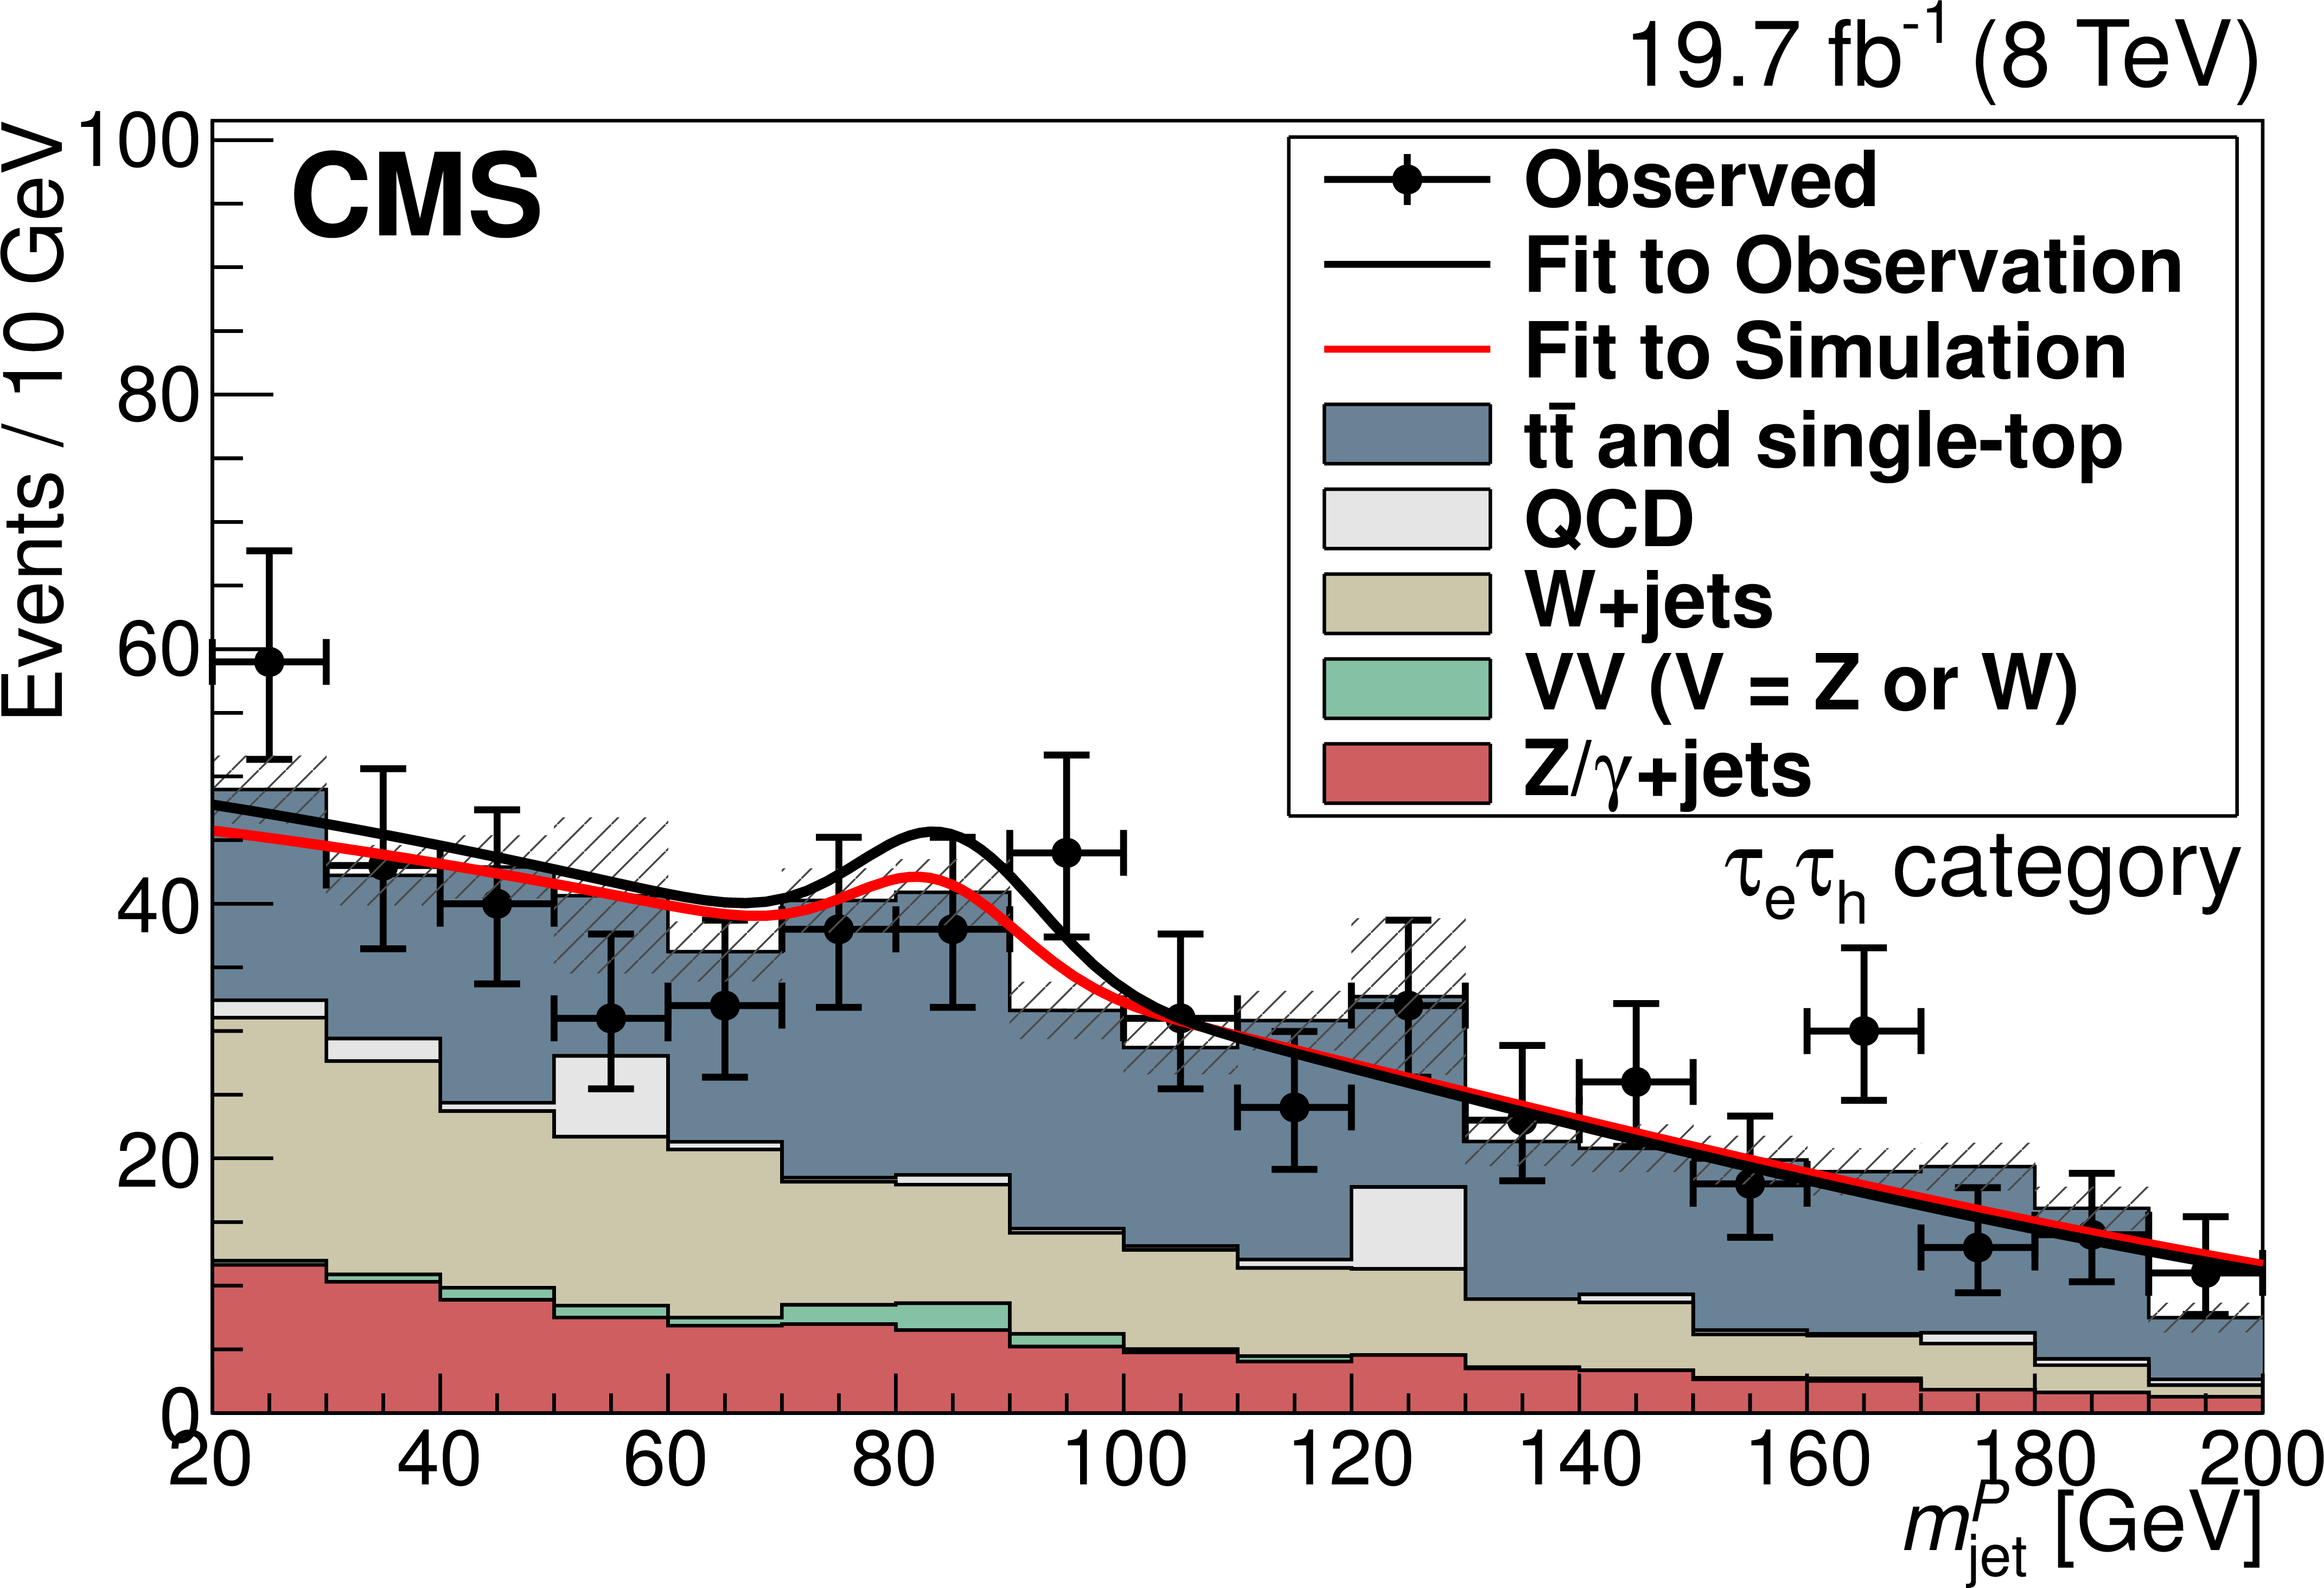
Figure 3-a:
Observed distributions of $ {m_\text {jet}^P }$ for the semileptonic channels along with the corresponding MC expectations for signal and background: (a) $ {\tau _{ {\mathrm {e}}} } {\tau _\mathrm {h}} $ category; (b) $ {\tau _{{\mu }} } {\tau _\mathrm {h}} $ category. Fits are performed for MC and data (as discussed in the text). |
png pdf |
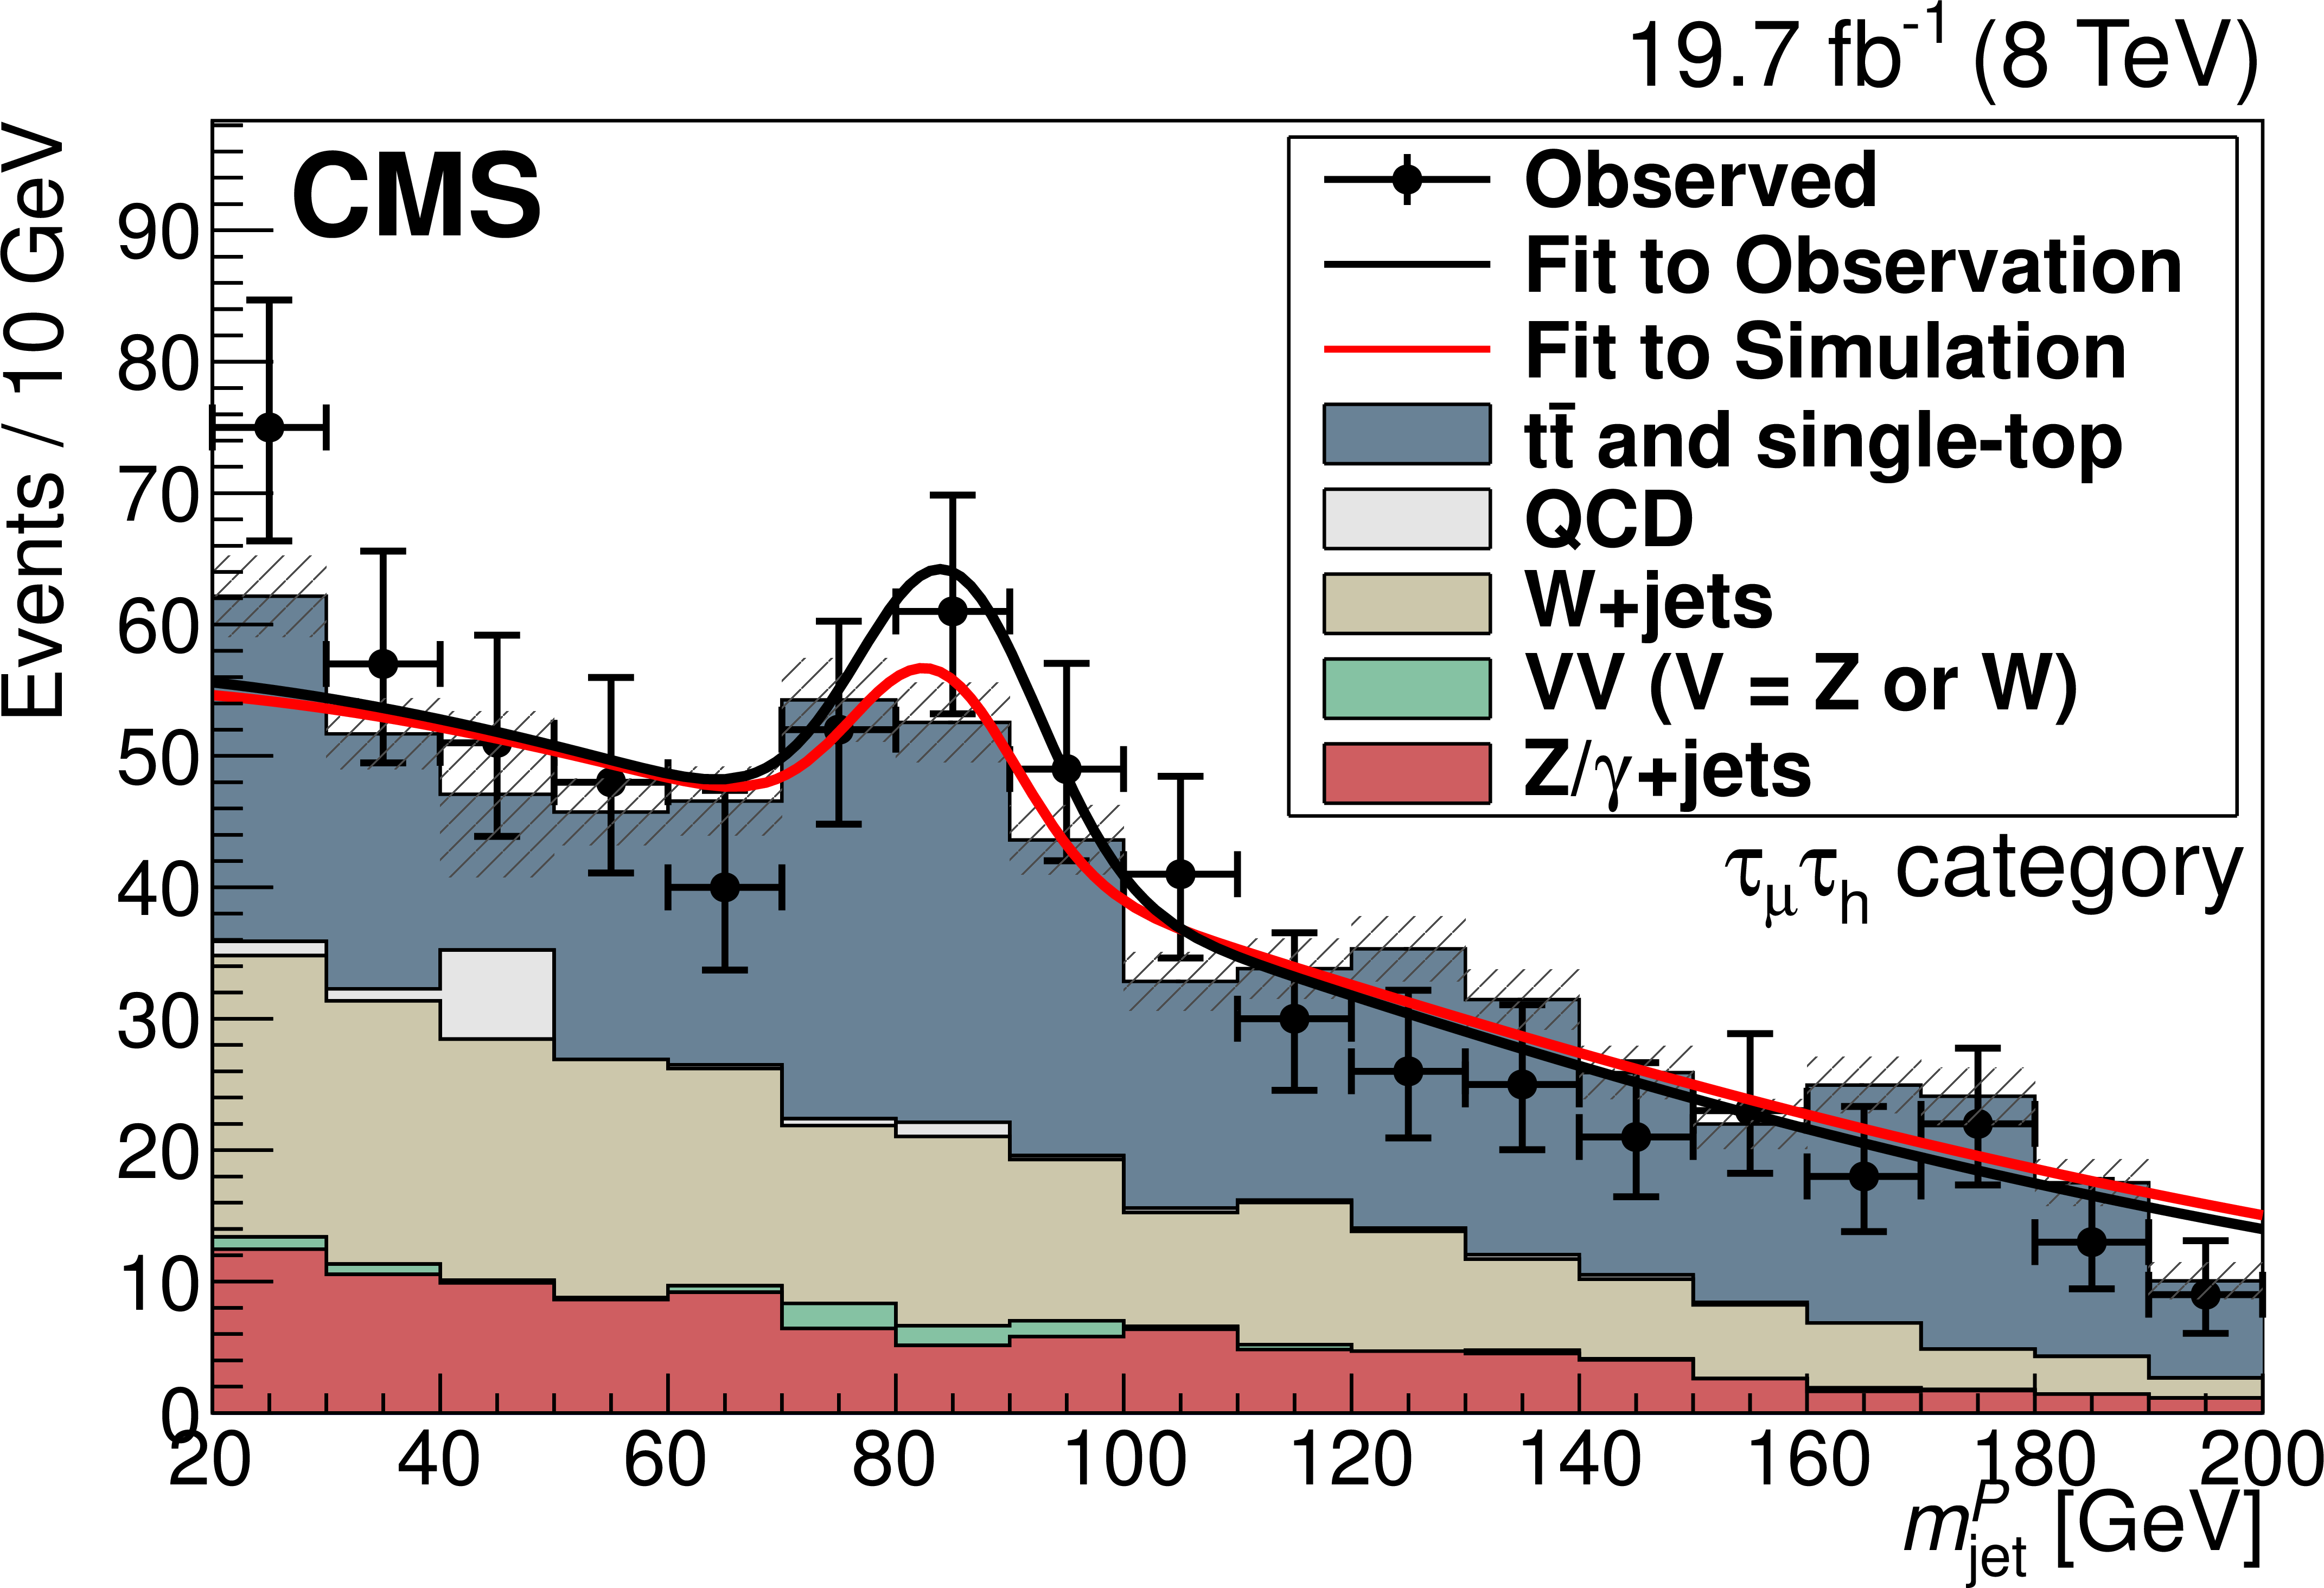
Figure 3-b:
Observed distributions of $ {m_\text {jet}^P }$ for the semileptonic channels along with the corresponding MC expectations for signal and background: (a) $ {\tau _{ {\mathrm {e}}} } {\tau _\mathrm {h}} $ category; (b) $ {\tau _{{\mu }} } {\tau _\mathrm {h}} $ category. Fits are performed for MC and data (as discussed in the text). |

png pdf |
Figure 4:
Definitions of the A, B, C, and D regions in the $ {m_\text {jet}^P }/ {m_{\tau \tau }} $ plane used in the background estimation for the all-hadronic channel. |
png pdf |
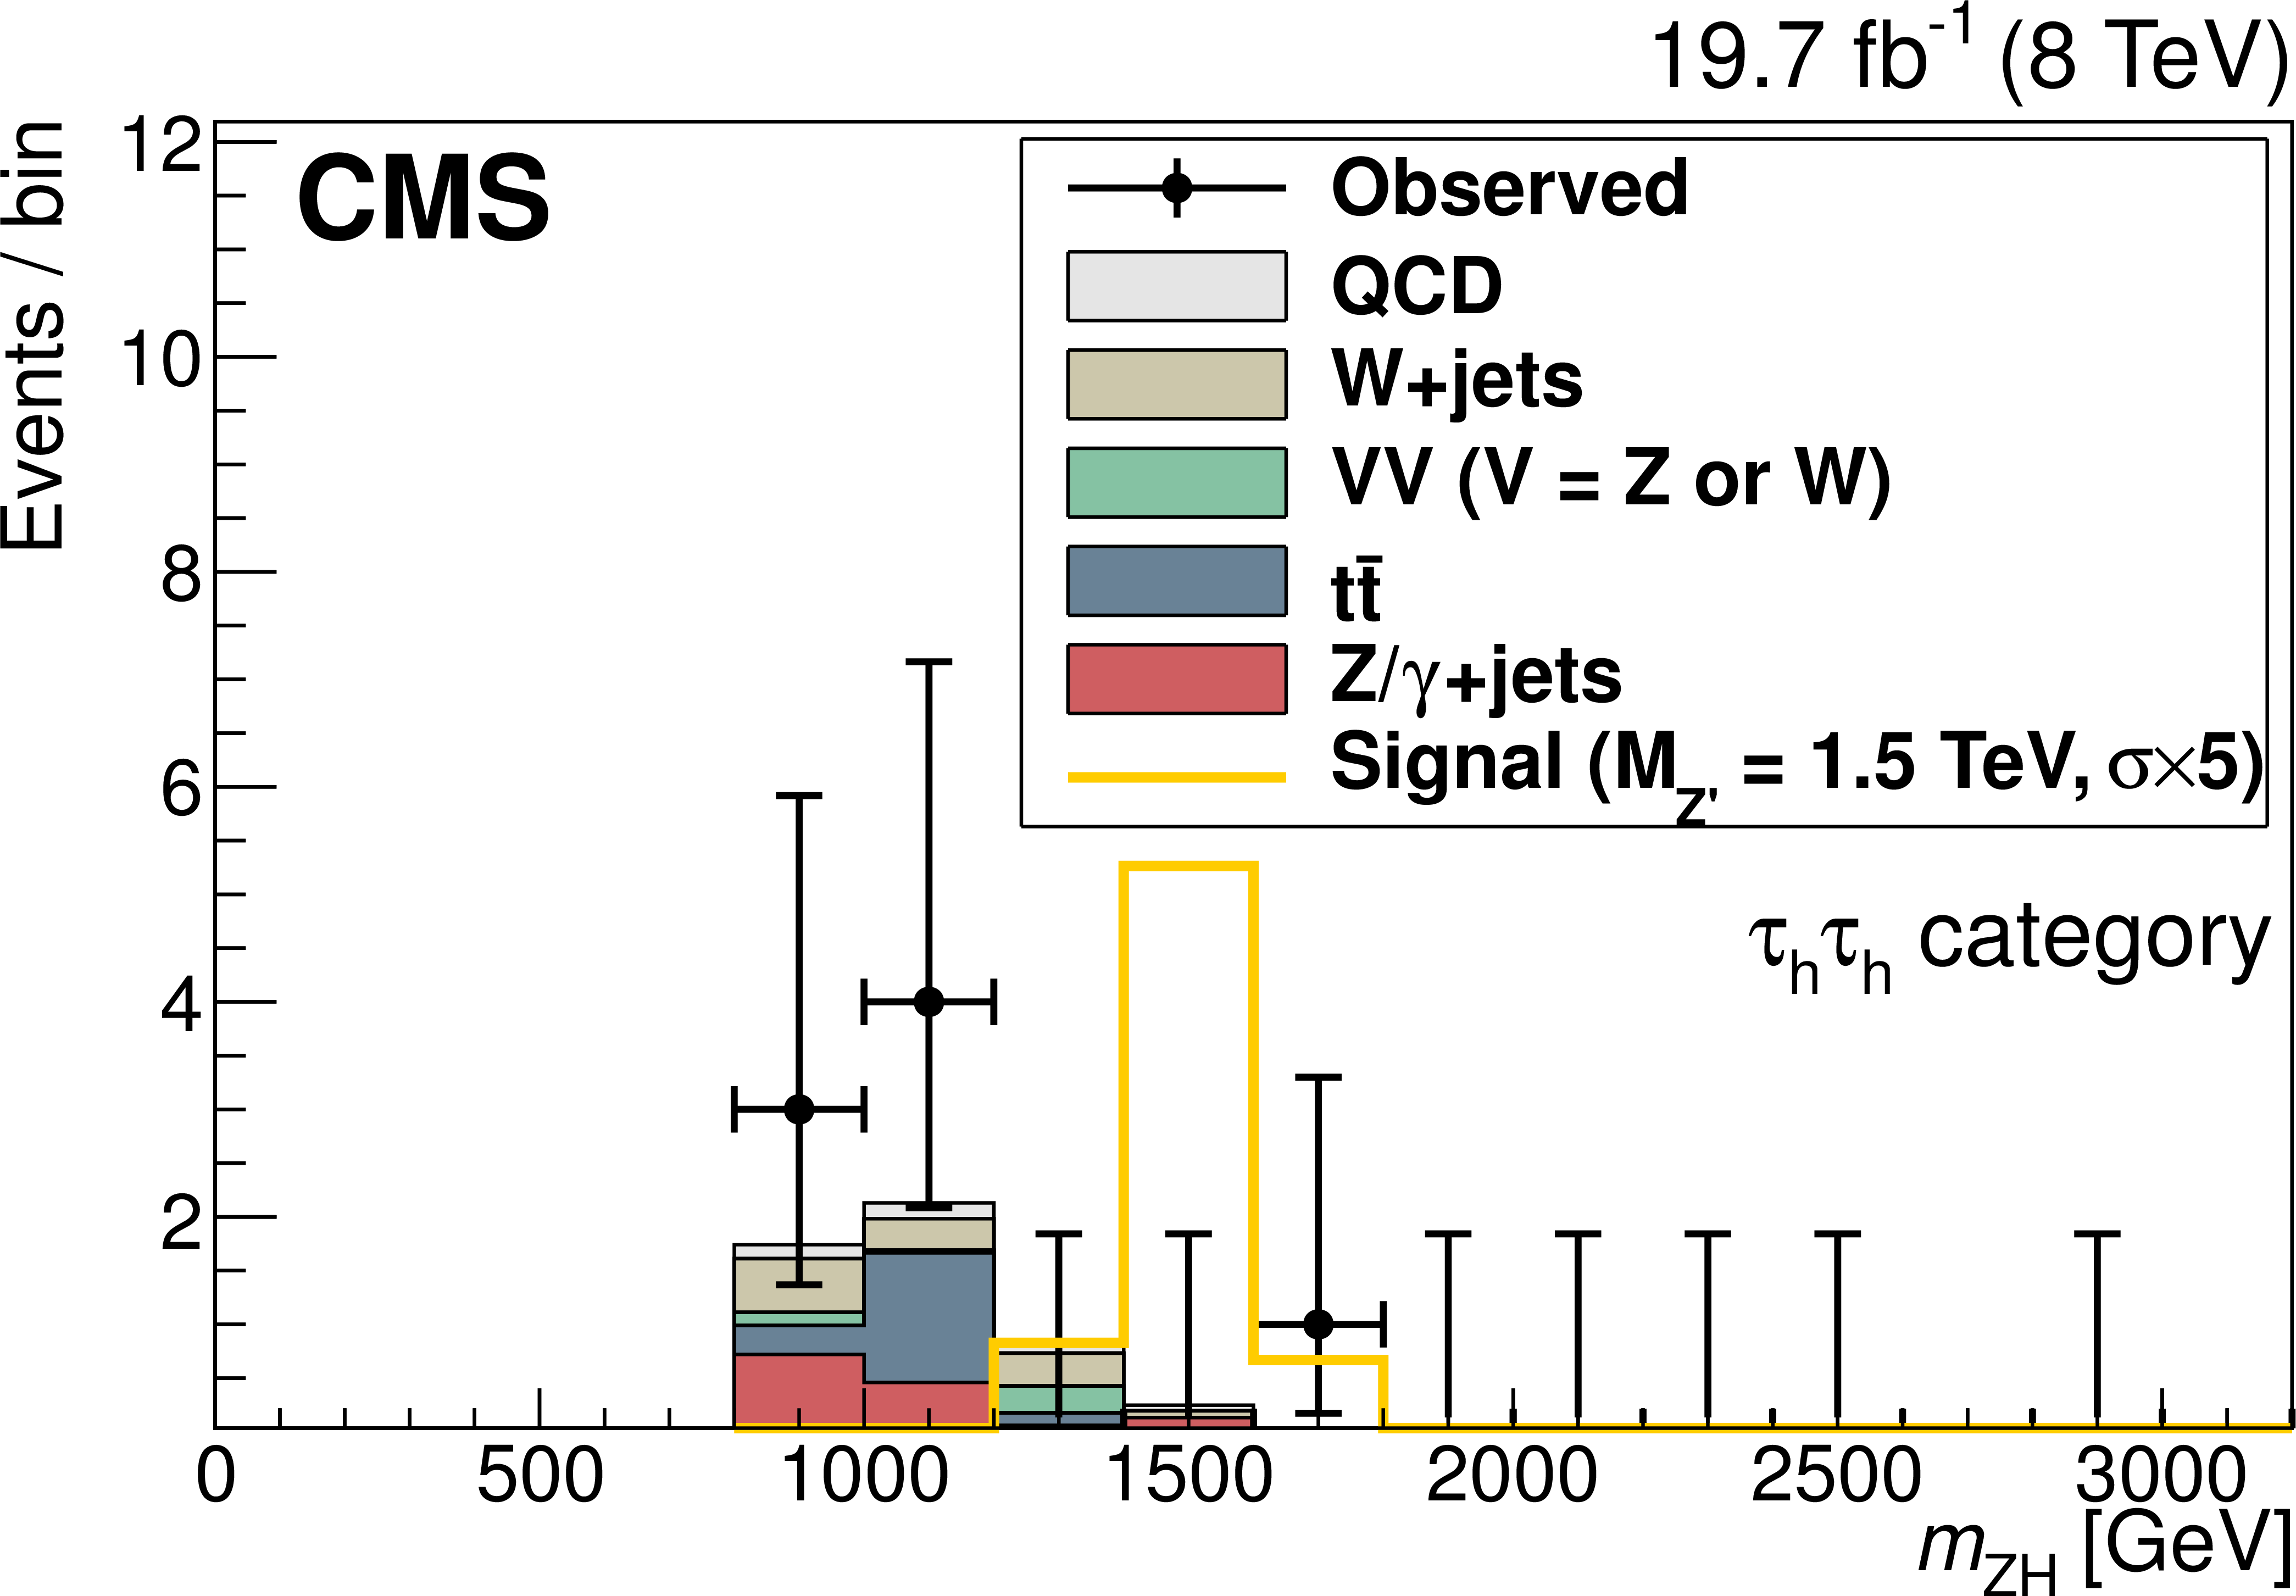
Figure 5:
Observed distributions of $ {m_{ {\mathrm {Z}} {\mathrm {H}} }} $ for the $ {\tau _\mathrm {h}} {\tau _\mathrm {h}} $ category along with the corresponding MC expectations for signal and background. Ten equal-size histogram bins cover the region from 0 to 2.5 TeV, while a single bin is used at higher $ {m_{ {\mathrm {Z}} {\mathrm {H}} }} $ because of the limited number of MC and data events. The signal cross section is scaled by a factor of 5. |
png pdf |
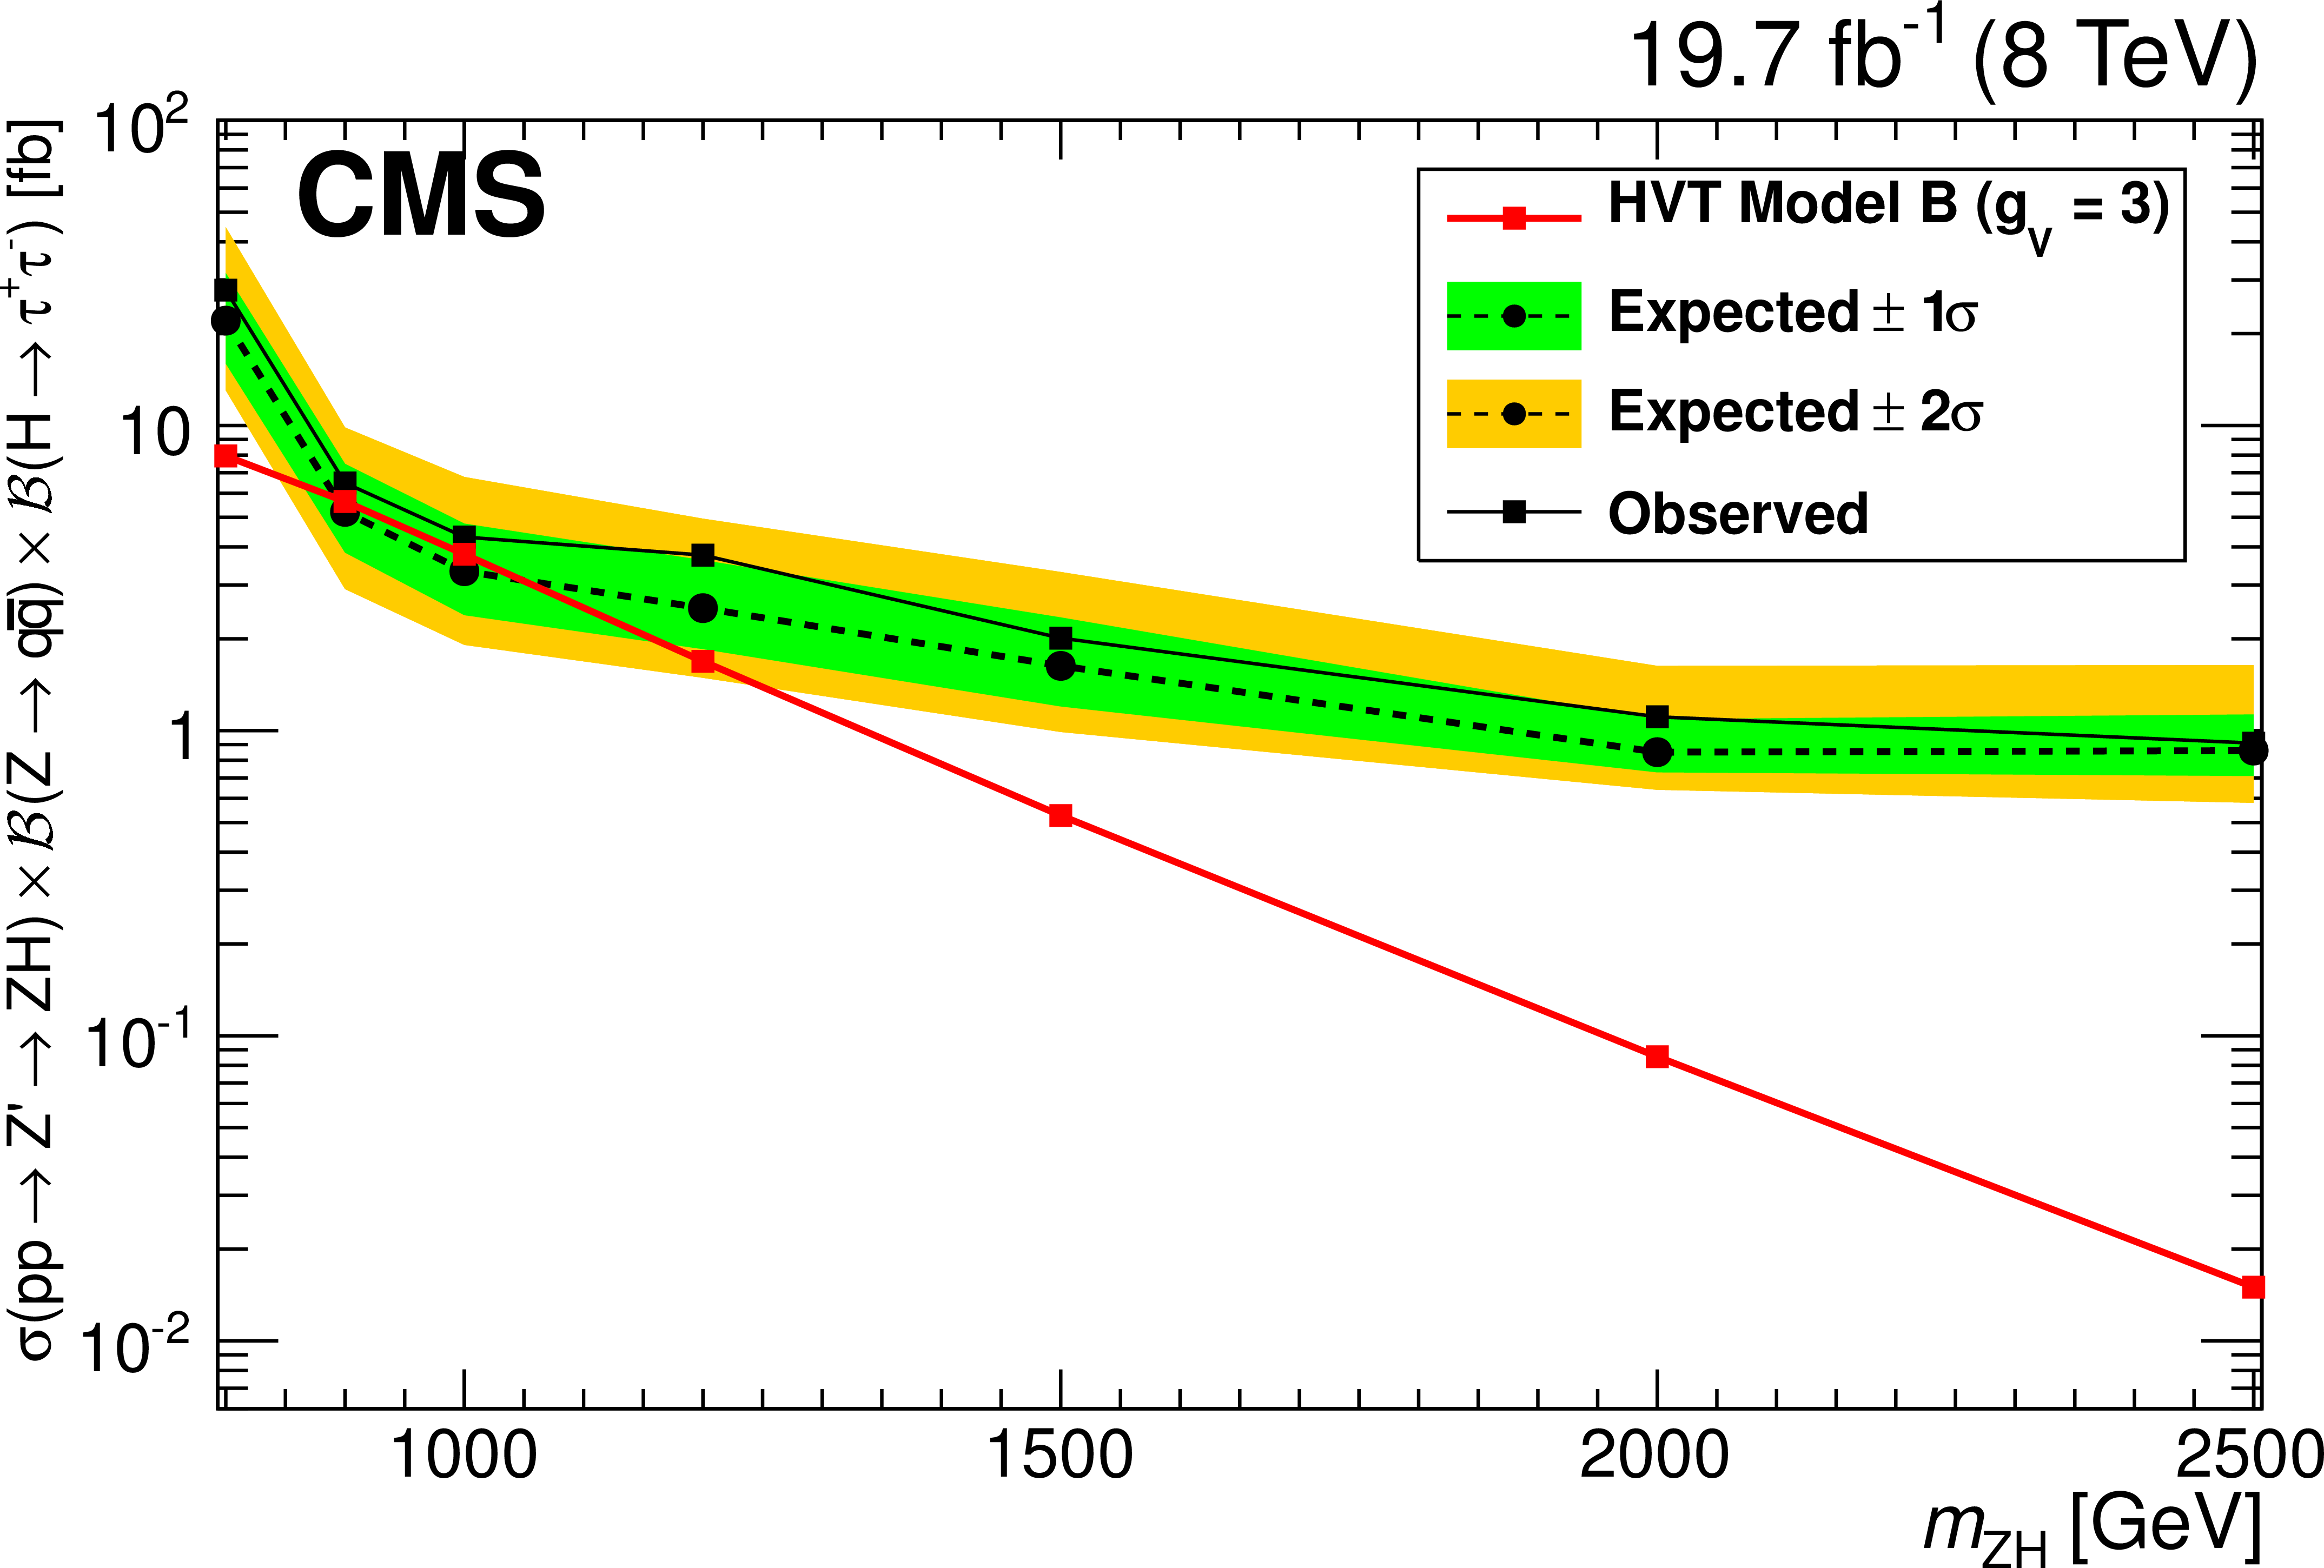
Figure 6:
Expected and observed upper limits on the quantity $\sigma ( {\mathrm {Z}^\prime } ) \mathcal {B}( {\mathrm {Z}^\prime } \to {\mathrm {Z}} {\mathrm {H}} )$ for the six analysis channels combined. Green and yellow bands correspond to $\pm $1 or $\pm 2\sigma $ variations on the expected upper limit, respectively. |

png pdf |
Figure 7:
Exclusion regions in the plane of the HVT-model coupling constants ($ {g_{\mathrm {V}}} {c_{ {\mathrm {H}} }} $, $g^2c_\mathrm {F}/ {g_{\mathrm {V}}} $) for two resonance masses, 1.0 and 1.5 TeV. The point B of the benchmark model used in the analysis, corresponding to $ {g_{\mathrm {V}}} =3$ and $c_\mathrm {F}=- {c_{ {\mathrm {H}} }} =1$, is also shown. The boundaries of the regions of the plane excluded by this search are indicated by the dashed and dotted lines, and associated hatching. The areas indicated by the solid line and solid shading correspond to regions where the theoretical width is larger than the experimental resolution of the present search and thus the narrow-resonance assumption is not satisfied. |
| Tables | |
png pdf |
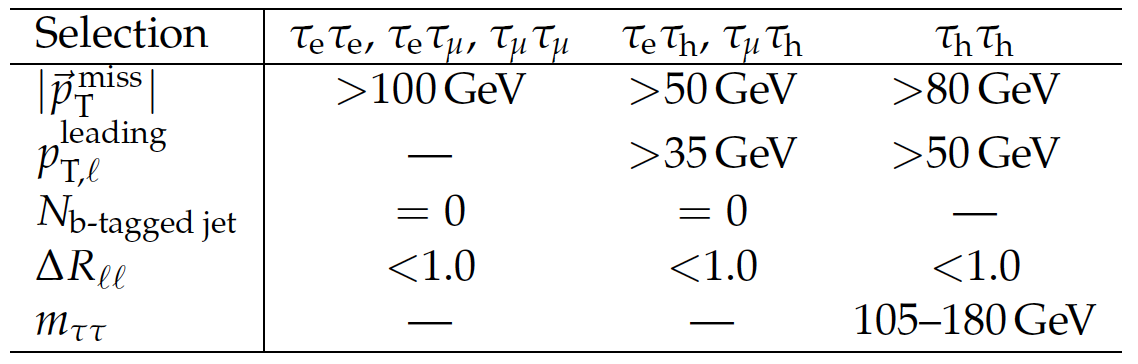
Table 1:
Summary of the optimized event selection for the six $\tau \tau $ channels. The selection variables are explained in the text. The label $\ell $ refers to electrons, muons, and $\tau $ leptons decaying hadronically. |

png pdf |
Table 2:
Summary of the signal efficiencies, number of expected background events, and number of observed events for the six $\tau \tau $ channels. Only statistical uncertainties are included. For the all-leptonic and semileptonic channels, numbers of expected background events and observed events are evaluated for each mass point in $ {m_{ {\mathrm {Z}} {\mathrm {H}} }} $ intervals corresponding to $\pm $2.5 times the expected resolution. For the all-hadronic channel we consider the number of expected background, signal, and observed events for $ {m_{ {\mathrm {Z}} {\mathrm {H}} }} > $ 800 GeV. When the expected background is zero, the 68% confidence level upper limit is listed. |
| Summary |
| A search for a highly massive ($\le$0.8 TeV) and narrow resonance decaying to Z and H bosons that decay in turn to merged dijet and $\tau^+\tau^-$ final states has been conducted with data samples collected in 8 TeV proton-proton collisions by the CMS experiment in 2012. For a high-mass resonance decaying to much lighter Z and H bosons, the final state particles must be detected and reconstructed in small angular regions. This is the first search performed by adopting novel and advanced reconstruction techniques to accomplish that end. From a combination of all possible decay modes of the $\tau$ leptons, production cross sections in a range between 0.9 and 27.8 fb, depending on the resonance mass (0.8?2.5 TeV), are excluded at a 95% confidence level. |
|
|
Compact Muon Solenoid LHC, CERN |
|

|

|

|

|

|