

Compact Muon Solenoid
LHC, CERN
| CMS-HIG-13-010 ; CERN-PH-EP-2015-116 | ||
| A search for pair production of new light bosons decaying into muons | ||
| CMS Collaboration | ||
| 31 May 2015 | ||
| Phys. Lett. B 752 (2016) 146 | ||
| Abstract: A search for the pair production of new light bosons, each decaying into a pair of muons, is performed with the CMS experiment at the LHC, using a dataset corresponding to an integrated luminosity of 20.7 fb$^{-1}$ collected in proton-proton collisions at center-of-mass energy of $\sqrt{s} =$ 8 TeV. No excess is observed in the data relative to standard model background expectation and a model independent upper limit on the product of the cross section, branching fraction, and acceptance is derived. The results are compared with two benchmark models, the first one in the context of the next-to-minimal supersymmetric standard model, and the second one in scenarios containing a hidden sector, including those predicting a non-negligible light boson lifetime. | ||
| Links: e-print arXiv:1506.00424 [hep-ex] (PDF) ; CDS record ; inSPIRE record ; CADI line (restricted) ; | ||
| Figures & Tables | Summary | Additional Figures | CMS Publications |
|---|
| Figures | |
png pdf |
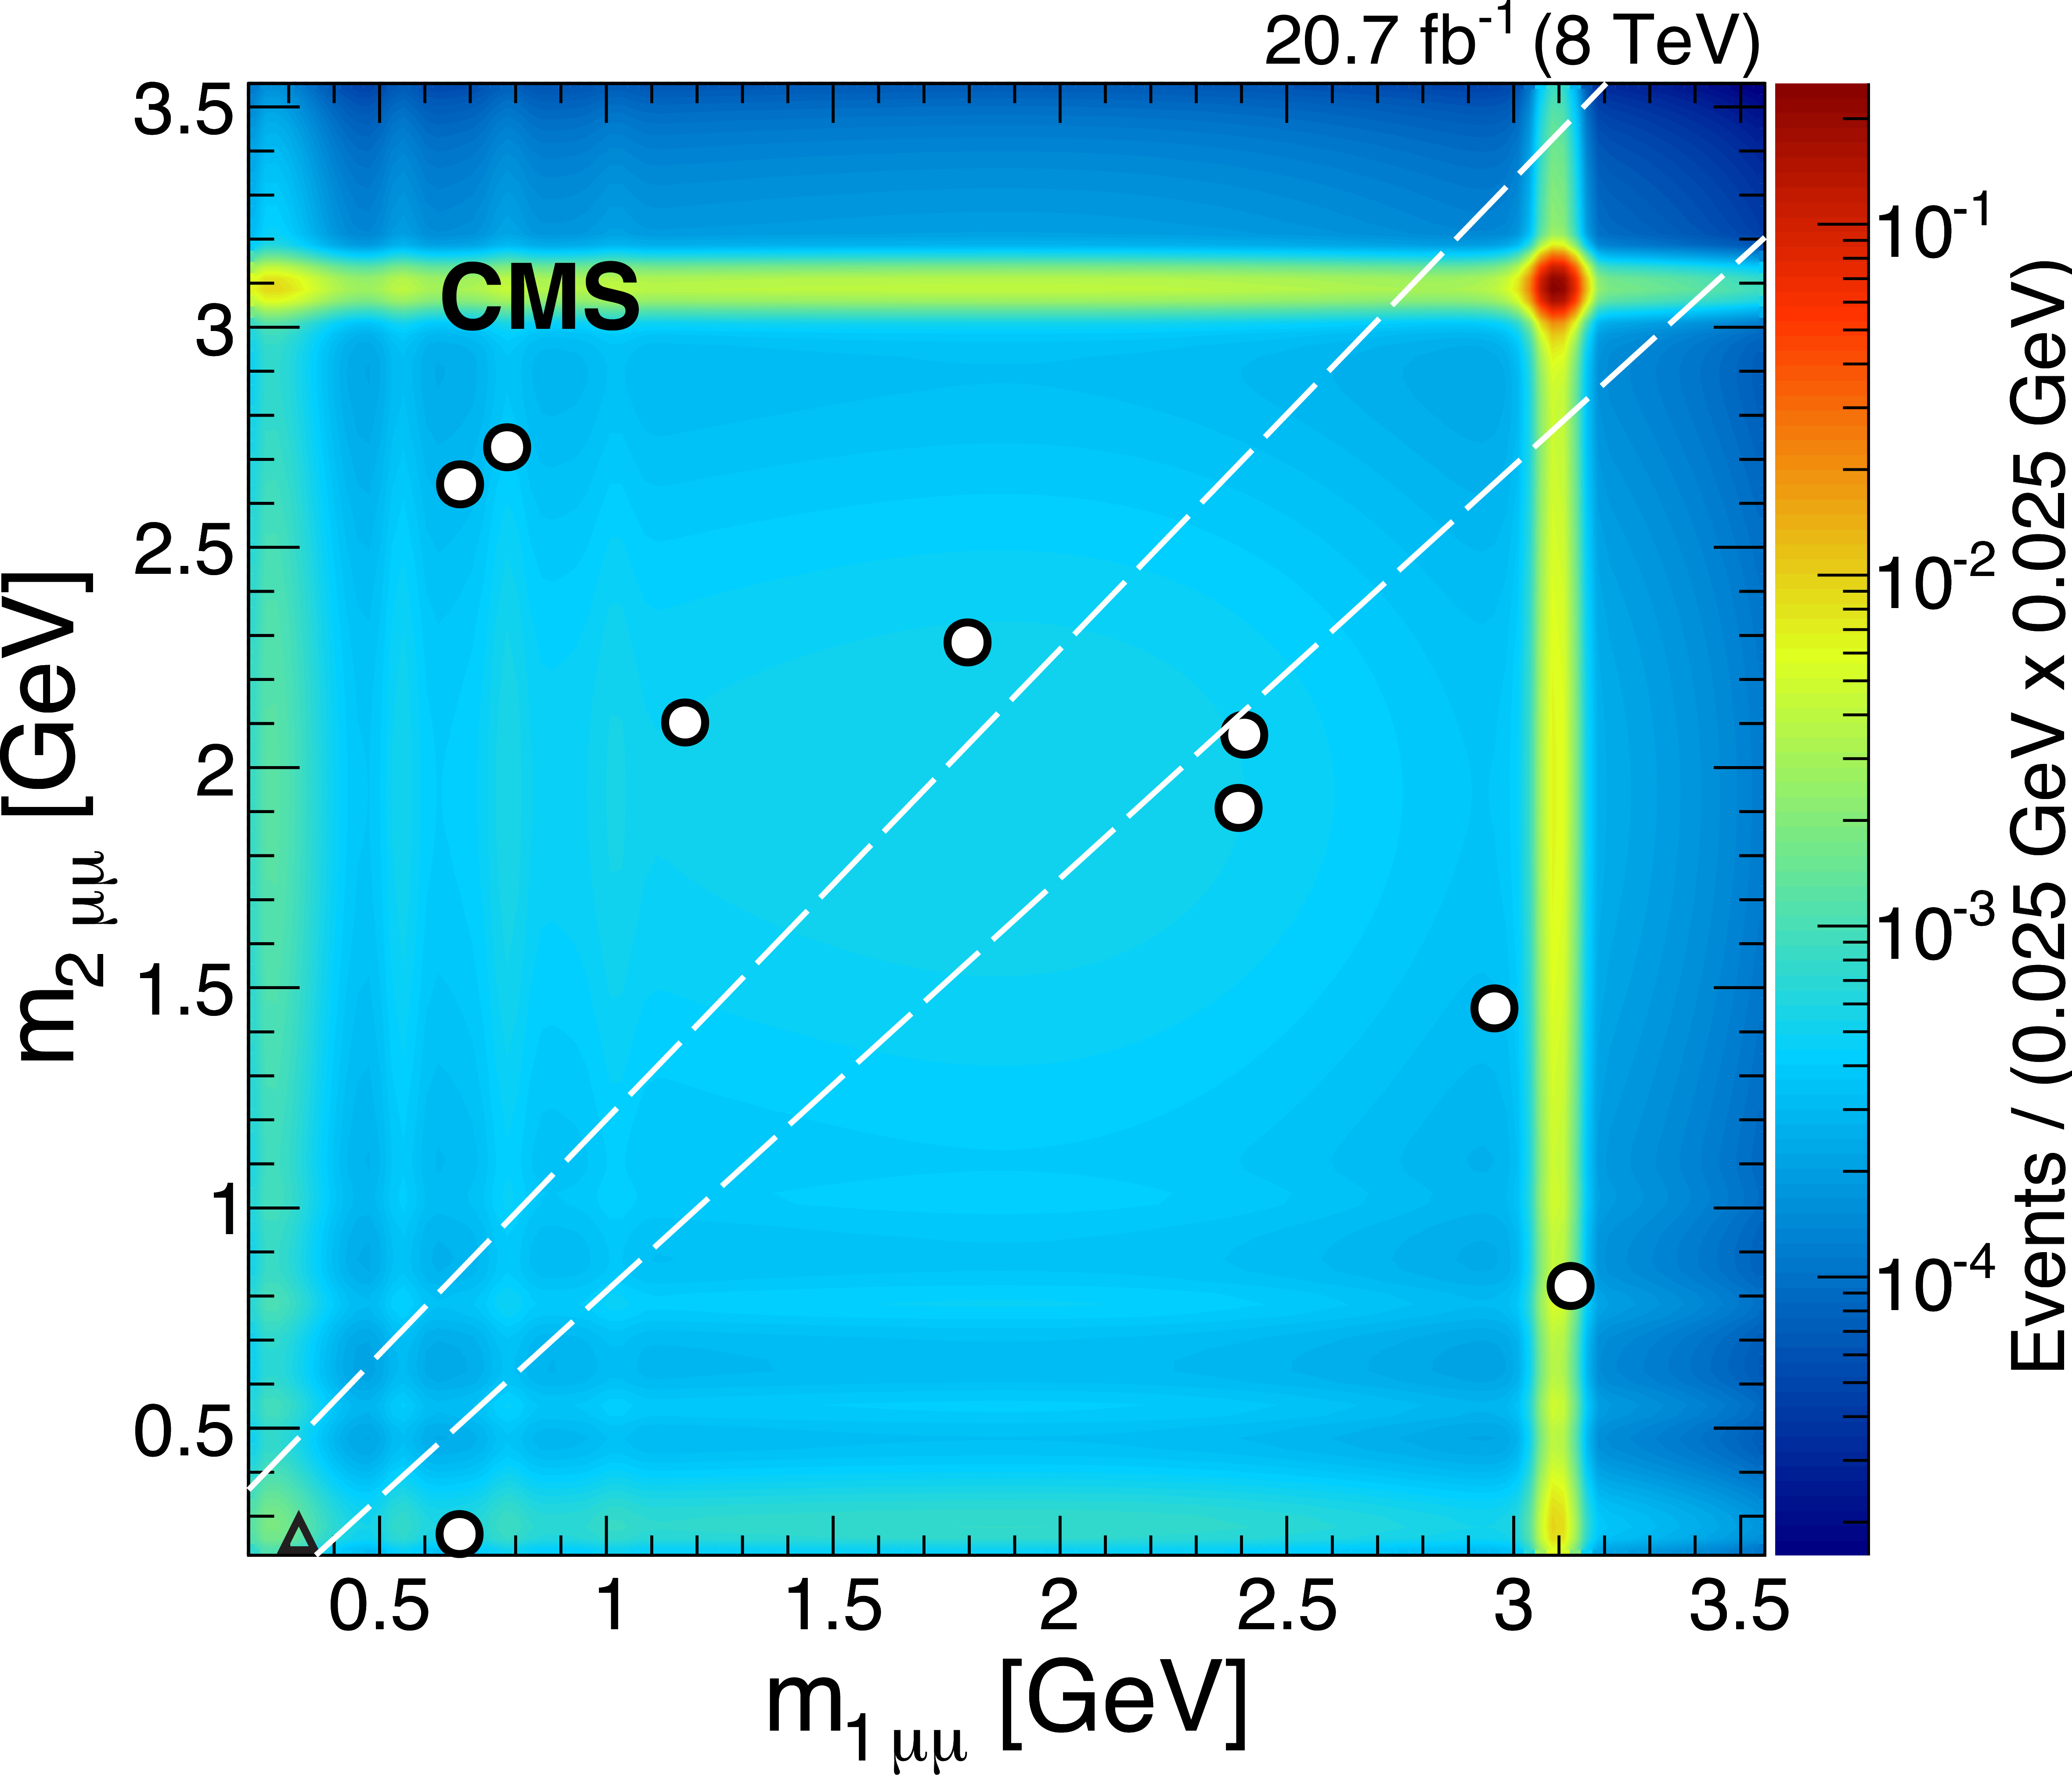
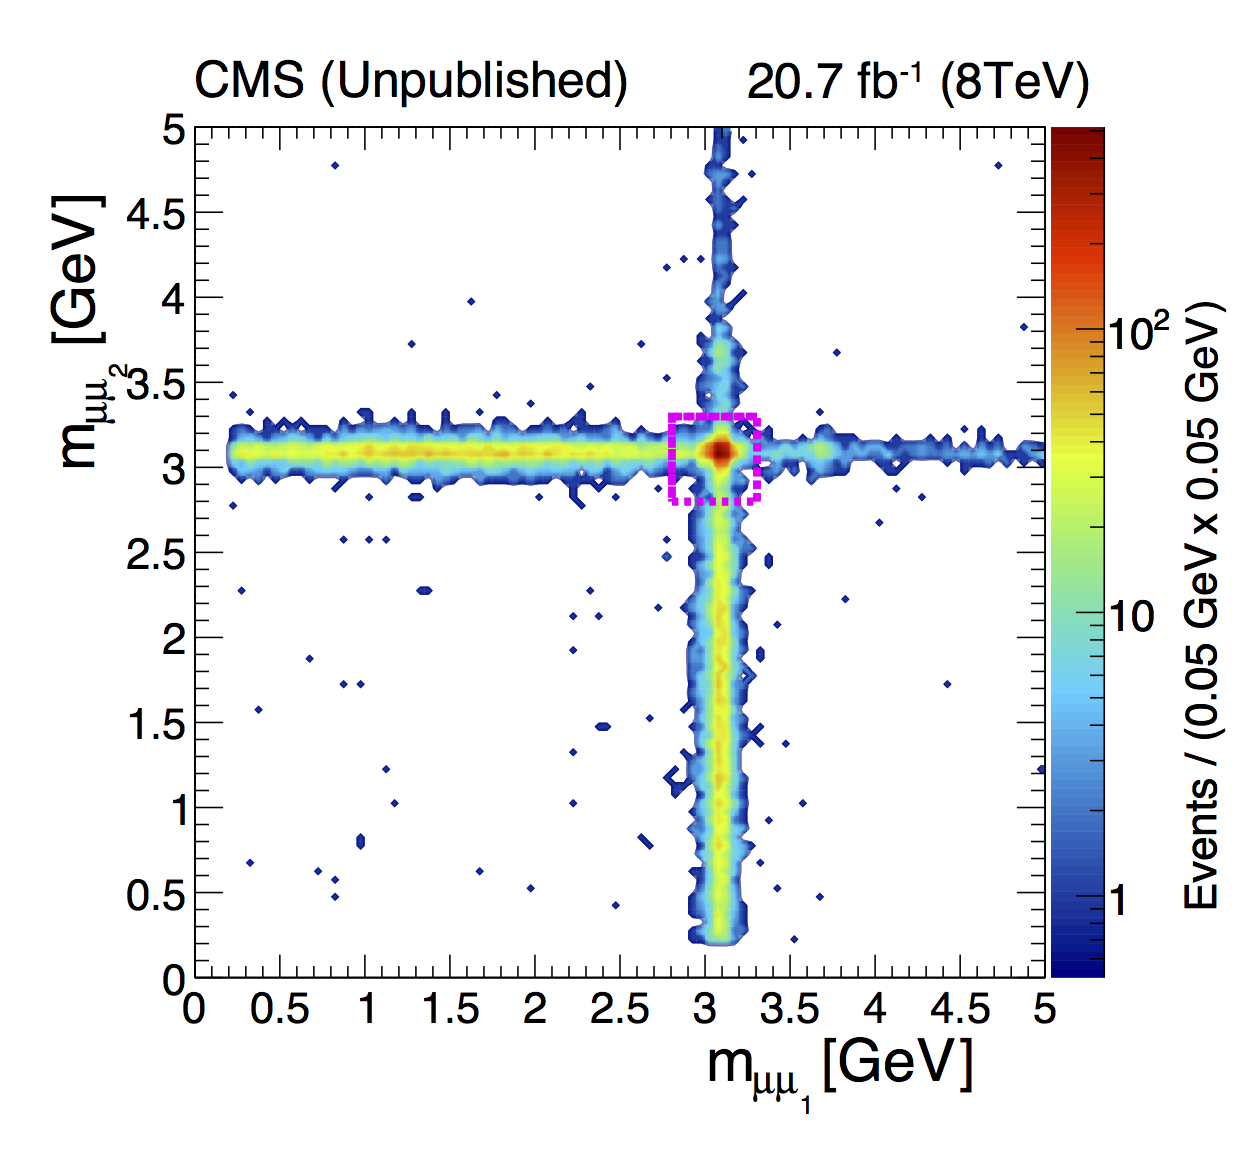
Figure 1:
Distribution of the invariant masses $m_{1\mu \mu }$ vs. $m_{2\mu \mu }$ for the isolated dimuon events following the application of all constraints except the $m_{1\mu \mu } \simeq m_{2\mu \mu }$ requirement of compatibility within the detector resolution. The compatible diagonal signal region (outlined with dashed lines) contains one data event (triangle) at $m_{1\mu \mu } =$ 0.33 GeV and $m_{2\mu \mu } =$ 0.22 GeV. There are also nine data events (white circles) which fail the $m_{1\mu \mu } \simeq m_{2\mu \mu }$ compatibility requirement. The color scale indicates the expected SM background in range $2 m_{\mu } < m_{1\mu \mu }, m_{2\mu \mu } < 2m_{\tau }$. |
png pdf |
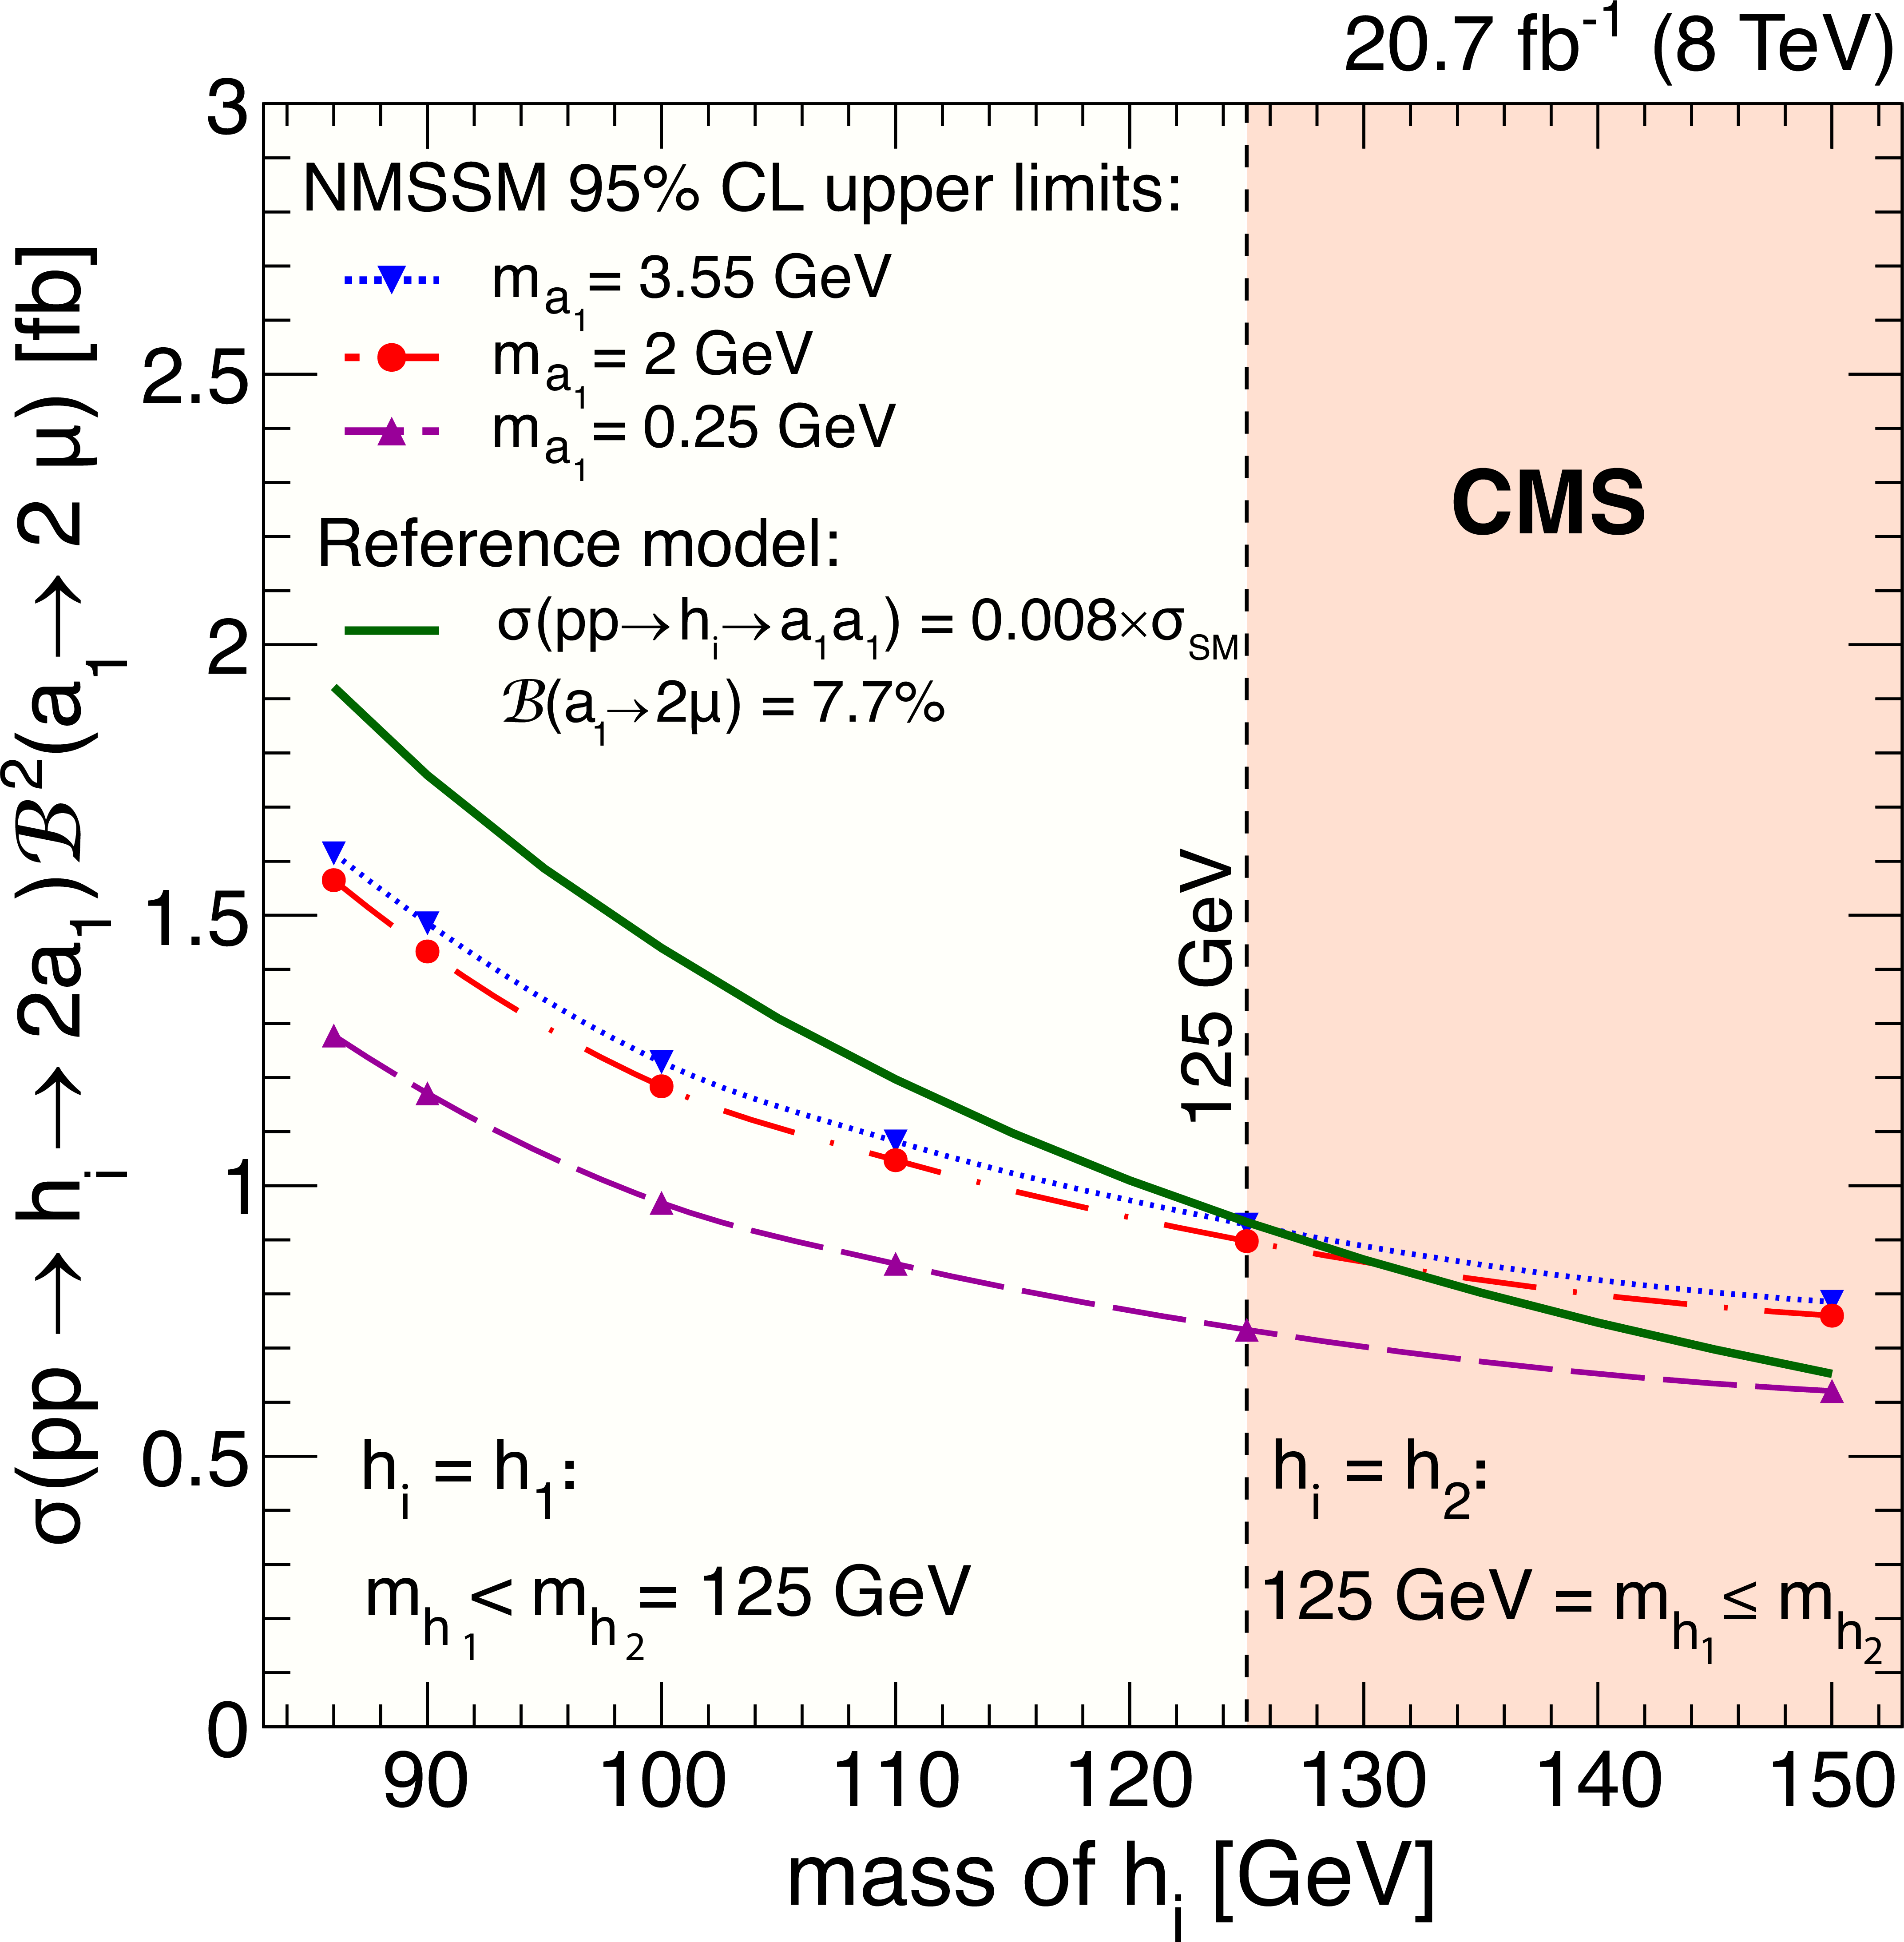
Figure 2-a:
(a) for benchmark model 1: 95%CL upper limits from this search for the NMSSM scenarios with $m_{\mathrm{a}_1}=$ 0.25 GeV (dashed curve), $m_{\mathrm{a}_1}=$ 2 GeV (dash-dotted curve) and $m_{\mathrm{a}_1}= $ 3.55 GeV (dotted curve) on $\sigma ( {\mathrm pp} \to {\mathrm {h}}_{1/2} \to 2 \mathrm{a}_1) \mathcal {B}^2(\mathrm{a}_1 \to 2 \mu )$ as a function of $m_{ {\mathrm {h}}_{1}}$ in the range 86 $< m_{ {\mathrm {h}} _1} <$ 125 GeV and of $m_{ {\mathrm {h}}_{2}}$ for $m_{ {\mathrm {h}}_2} > $ 125 GeV. As an illustration, the limits are compared to the predicted rate (solid curve) obtained using a simplified scenario with $\sigma ( \mathrm {pp} \to {\mathrm {h}}_i \to 2\mathrm{a}_1) =$ 0.008 $\sigma _{\mathrm {SM}}$, which yields predictions for the rates of dimuon pair events comparable to the obtained experimental limits, and $\mathcal {B}(\mathrm{a}_1 \to 2\mu ) =$ 7.7%. The chosen $\mathcal {B}(\mathrm{a}_1 \to 2\mu )$ is taken from [17, Dermisek and Gunion, PRD 81 (2010) 075003] for $m_{\mathrm{a}_1} = 2$ GeV and $\tan \beta =$ 20. (b) for benchmark model 2: 95% CL upper limits (black solid curves) from this search on $\sigma ( {\mathrm {p}} {\mathrm {p}}\to {\mathrm {h}} \to 2\gamma _{\mathrm {D}} + X) \mathcal {B}( {\mathrm {h}} \to 2\gamma _{\mathrm {D}} + X)$ (with $m_{\mathrm {n}_1}=$ 10 GeV, $m_{\mathrm {n}_{\mathrm {D}}}=$ 1 GeV) in the plane of two of the parameters ($\varepsilon $ and $m_{\gamma _{\mathrm {D}}}$) for the dark SUSY scenarios, along with constraints from other experiments. The colored contours represent different values of $\mathcal {B}( {\mathrm {h}} \to 2\gamma _{\mathrm {D}} + X)$ in the range 0.1--40%. |

png pdf |
Figure 2-b:
(a) for benchmark model 1: 95%CL upper limits from this search for the NMSSM scenarios with $m_{\mathrm{a}_1}=$ 0.25 GeV (dashed curve), $m_{\mathrm{a}_1}=$ 2 GeV (dash-dotted curve) and $m_{\mathrm{a}_1}= $ 3.55 GeV (dotted curve) on $\sigma ( {\mathrm pp} \to {\mathrm {h}}_{1/2} \to 2 \mathrm{a}_1) \mathcal {B}^2(\mathrm{a}_1 \to 2 \mu )$ as a function of $m_{ {\mathrm {h}}_{1}}$ in the range 86 $< m_{ {\mathrm {h}} _1} <$ 125 GeV and of $m_{ {\mathrm {h}}_{2}}$ for $m_{ {\mathrm {h}}_2} > $ 125 GeV. As an illustration, the limits are compared to the predicted rate (solid curve) obtained using a simplified scenario with $\sigma ( \mathrm {pp} \to {\mathrm {h}}_i \to 2\mathrm{a}_1) =$ 0.008 $\sigma _{\mathrm {SM}}$, which yields predictions for the rates of dimuon pair events comparable to the obtained experimental limits, and $\mathcal {B}(\mathrm{a}_1 \to 2\mu ) =$ 7.7%. The chosen $\mathcal {B}(\mathrm{a}_1 \to 2\mu )$ is taken from [17, Dermisek and Gunion, PRD 81 (2010) 075003] for $m_{\mathrm{a}_1} = 2$ GeV and $\tan \beta =$ 20. (b) for benchmark model 2: 95% CL upper limits (black solid curves) from this search on $\sigma ( {\mathrm {p}} {\mathrm {p}}\to {\mathrm {h}} \to 2\gamma _{\mathrm {D}} + X) \mathcal {B}( {\mathrm {h}} \to 2\gamma _{\mathrm {D}} + X)$ (with $m_{\mathrm {n}_1}=$ 10 GeV, $m_{\mathrm {n}_{\mathrm {D}}}=$ 1 GeV) in the plane of two of the parameters ($\varepsilon $ and $m_{\gamma _{\mathrm {D}}}$) for the dark SUSY scenarios, along with constraints from other experiments. The colored contours represent different values of $\mathcal {B}( {\mathrm {h}} \to 2\gamma _{\mathrm {D}} + X)$ in the range 0.1--40%. |
| Tables | |
png pdf |
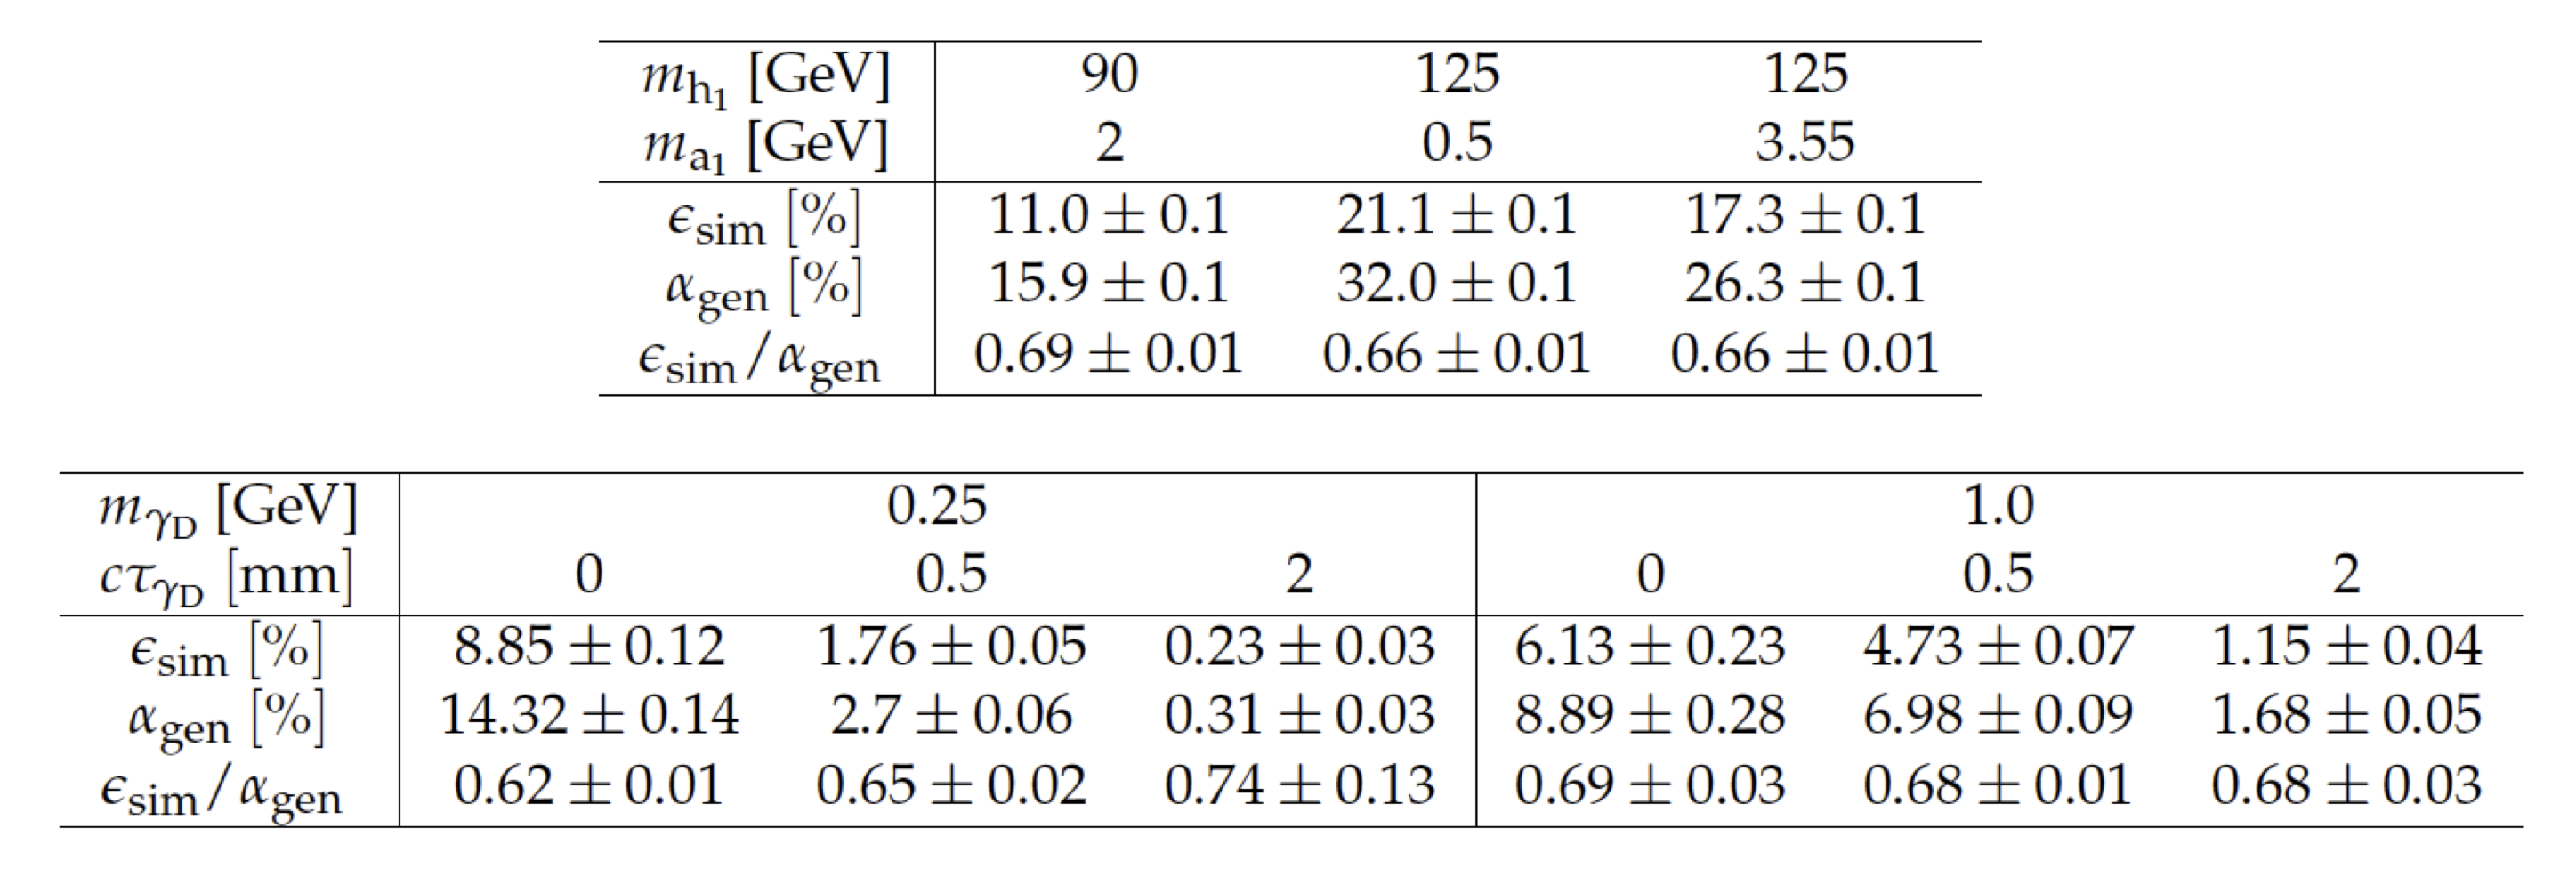
Table 1:
Event selection efficiencies $\epsilon_{\text{sim}}( m_{\mathrm{h1}} , m_{\mathrm{a1}})$ and $\epsilon_{\text{sim}}(m_{\gamma D} , c\tau_{\gamma D})$, as obtained from simulation, the geometric and kinematic acceptances $\alpha_{\text{gen}}( m_{\mathrm{h1}} , m_{\mathrm{a1}})$ and $\alpha_{\text{gen}}(m_{\gamma D} , c\tau_{\gamma D})$, calculated using only generator-level information, and their ratios (with statistical uncertainties), for a few representative NMSSM and dark SUSY benchmark samples. The experimental data-to- simulation scale factor ($\epsilon_{\text{data}}/\epsilon_{\text{sim}}$, described later) is not applied. |
| Summary |
| A search for pairs of new light bosons produced in the decay of a Higgs boson, that subse- quently decay to pairs of oppositely charged muons, is presented. One event is observed in the signal region, with 2.2 $\pm$ 0.7 events expected from the SM backgrounds. A model independent upper limit at 95% CL on the product of the cross section, branching fraction, and acceptance is obtained. This limit is valid for light boson masses in the range $2 m_{\mu} < m_{\mathrm{a}} < 2m_{\tau}$. The obtained results allow a straightforward interpretation within a broad range of physics models that predict the same type of signature. The results are compared with two benchmark models in the context of the NMSSM and dark SUSY, including scenarios predicting a non-negligible light boson lifetime. |
| Additional Figures | |
png pdf |
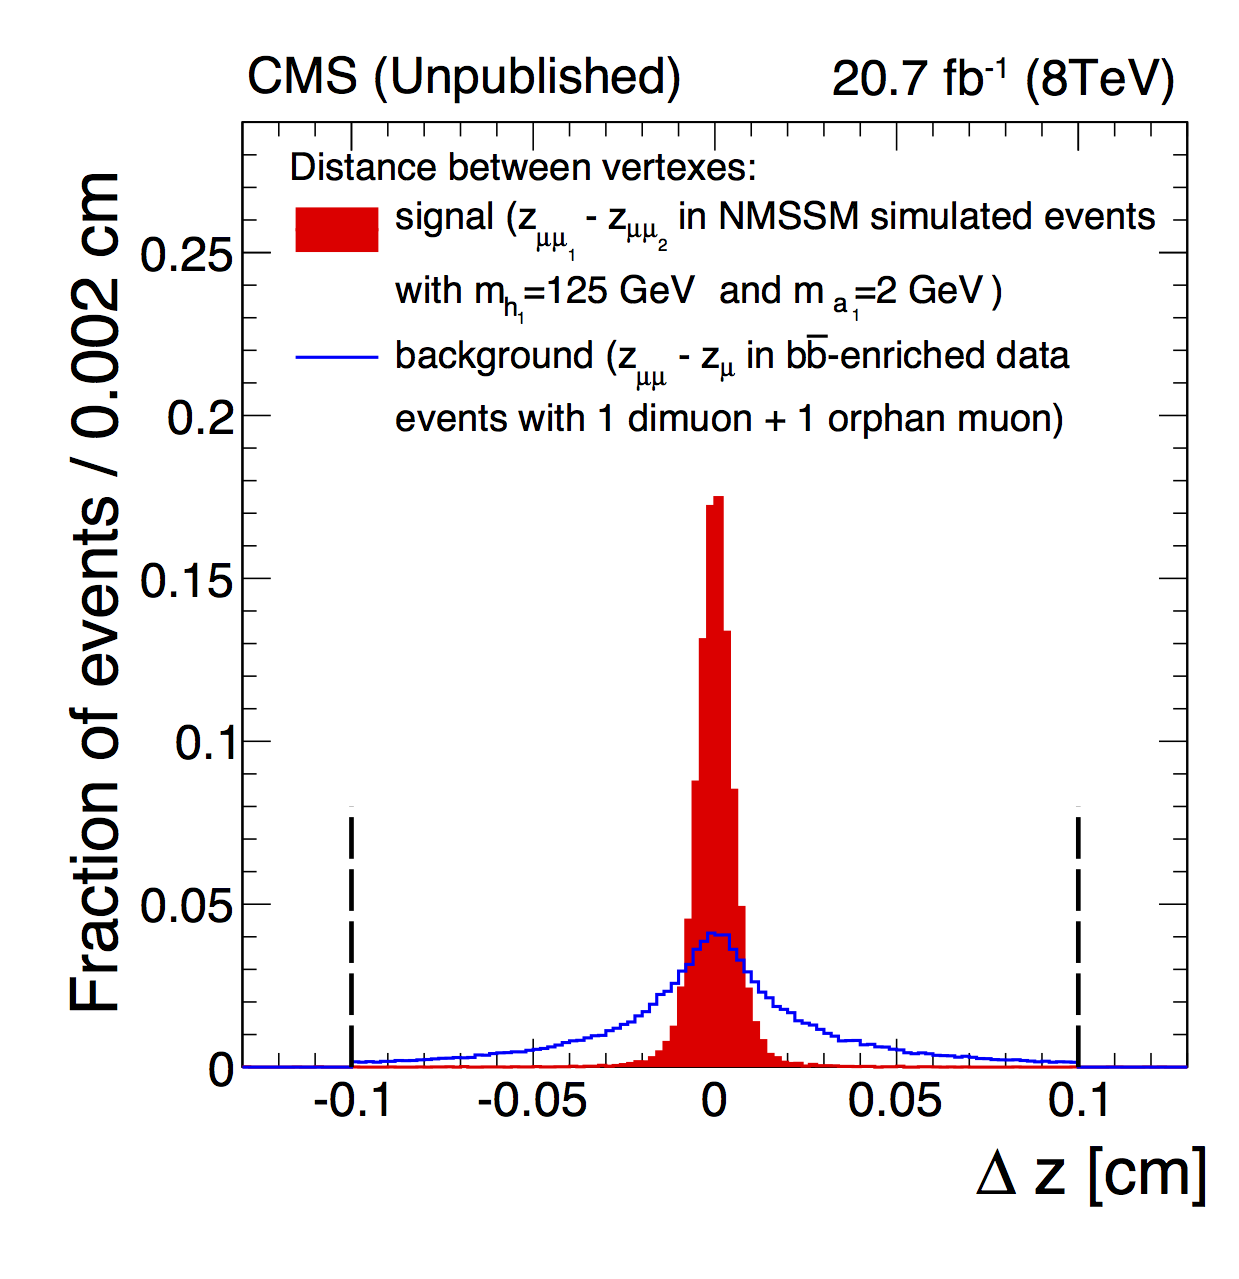
Additional Figure 1:
Separation between dimuon vertexes. The distance between vertexes measured for two dimuons ($\Delta z = z_{\mu\mu_1} - z_{\mu\mu_2}$) for a NMSSM simulated sample with $m_{h_1}=$ 125 GeV and $m_{a_1} =$ 2 GeV and for dimuon and ``orphan'' muon ($\Delta z = z_{\mu\mu} - z_{\mu}$) in events from $\text{b}\bar{\text{b}}$-background-enriched part of data sample. |
png pdf |
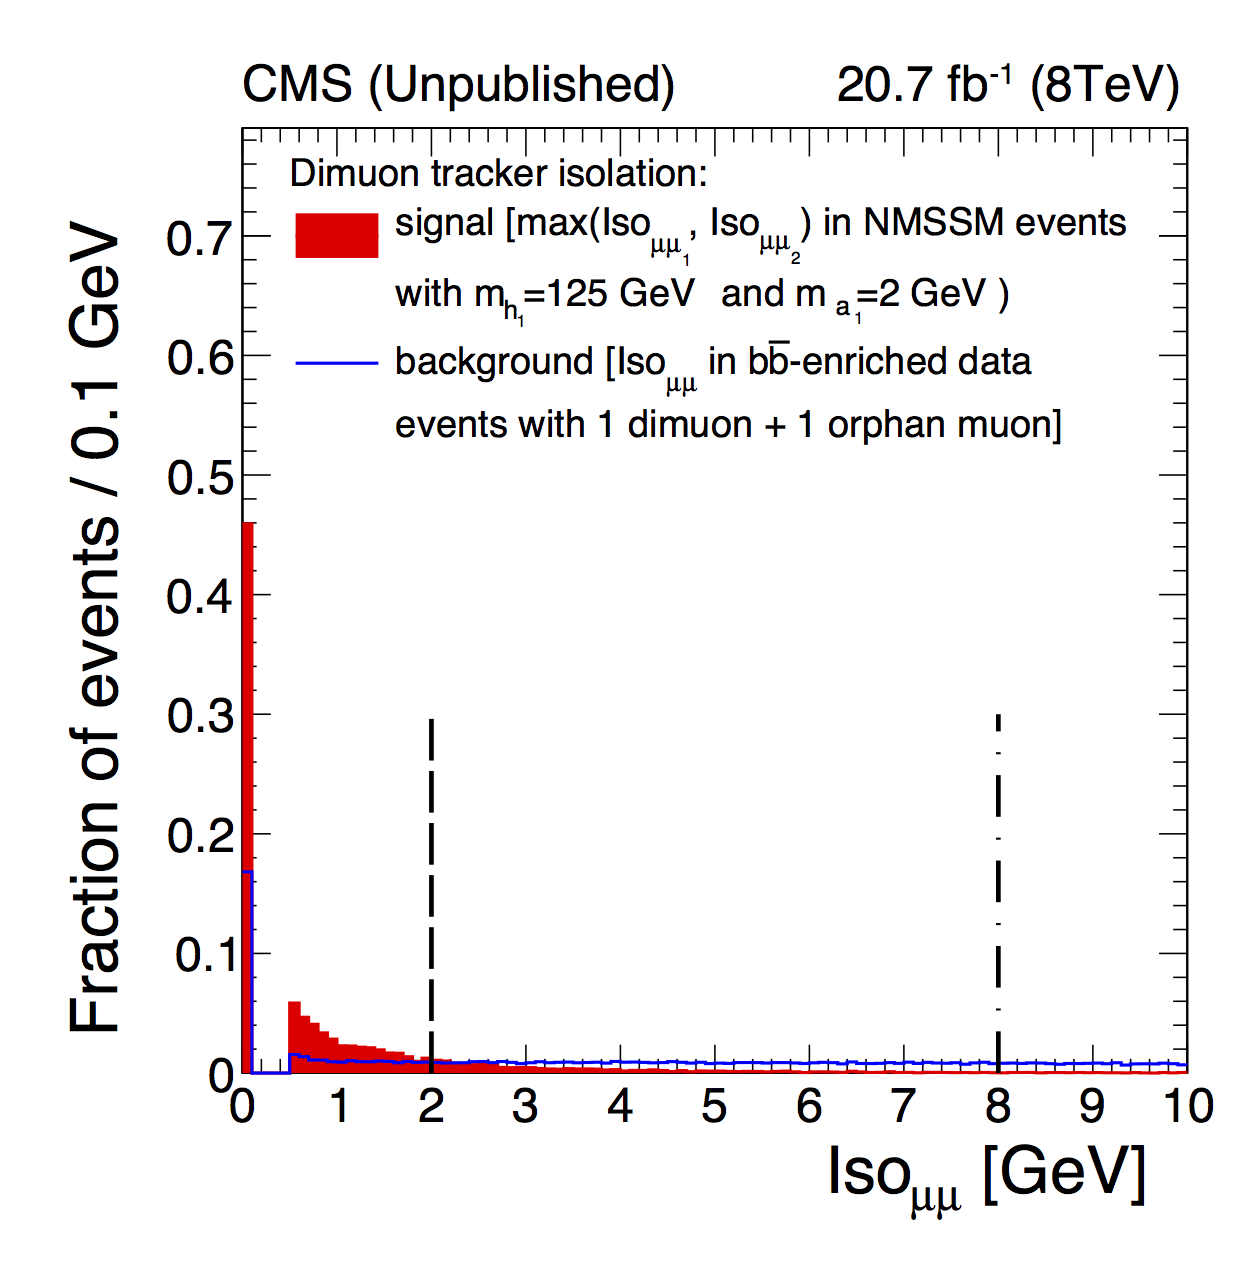
Additional Figure 2:
Dimuon isolation. The dimuon isolation distribution $max(Iso_{\mu\mu_{1}},Iso_{\mu\mu_{2}}$) in a NMSSM simulated sample with $m_{h_1}=$ 125 GeV and $m_{a_1} =$ 2 GeV and in events from $\text{b}\bar{\text{b}}$-background-enriched part of data sample. |
png pdf |
Additional Figure 3:
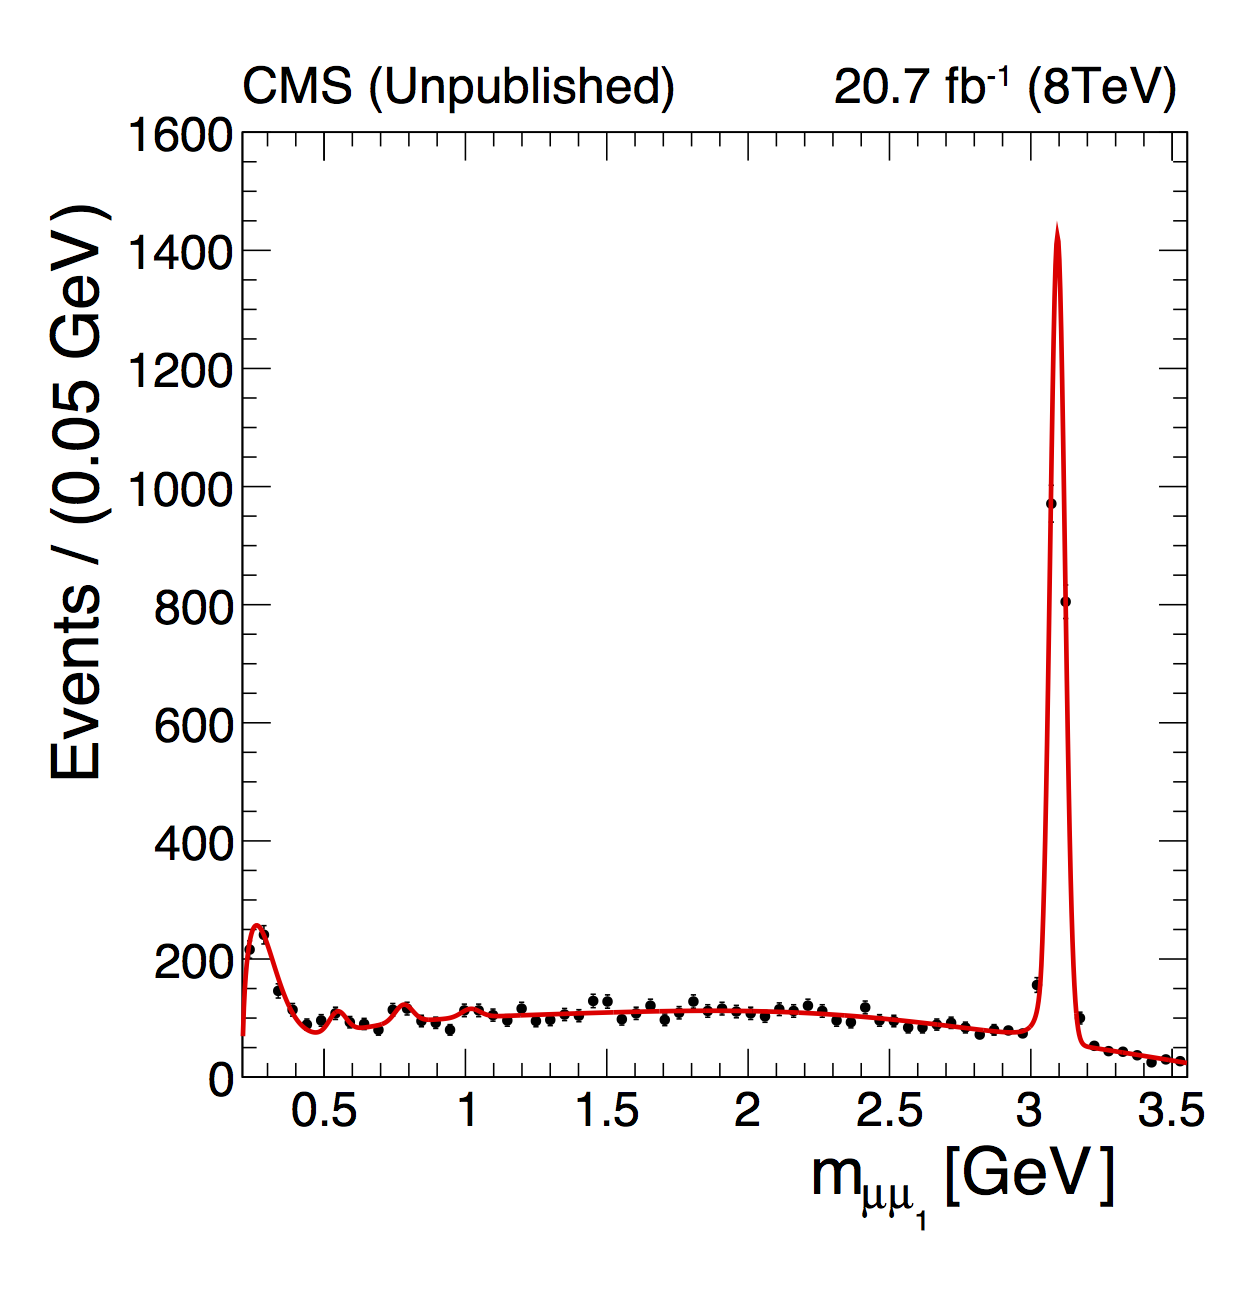
$\text{b}\bar{\text{b}}$ background 1D template. The dimuon invariant mass distribution for a $\text{b}\bar{\text{b}}$-background-enriched data sample (solid circles) in which at least one of the muons is "high pT" ($ p_{T}>$ 17 GeV,$|\eta|<$ 0.9), and the template (solid line) used to describe the low mass resonances, where the $ \eta, \omega$ and $\phi$ are modeled using a gaussian distribution and the $ \mathrm{J/\psi}$ is parametrized with a Crystal Ball function, this distribution is commonly referred as $B_{17+8}$. |
png pdf |
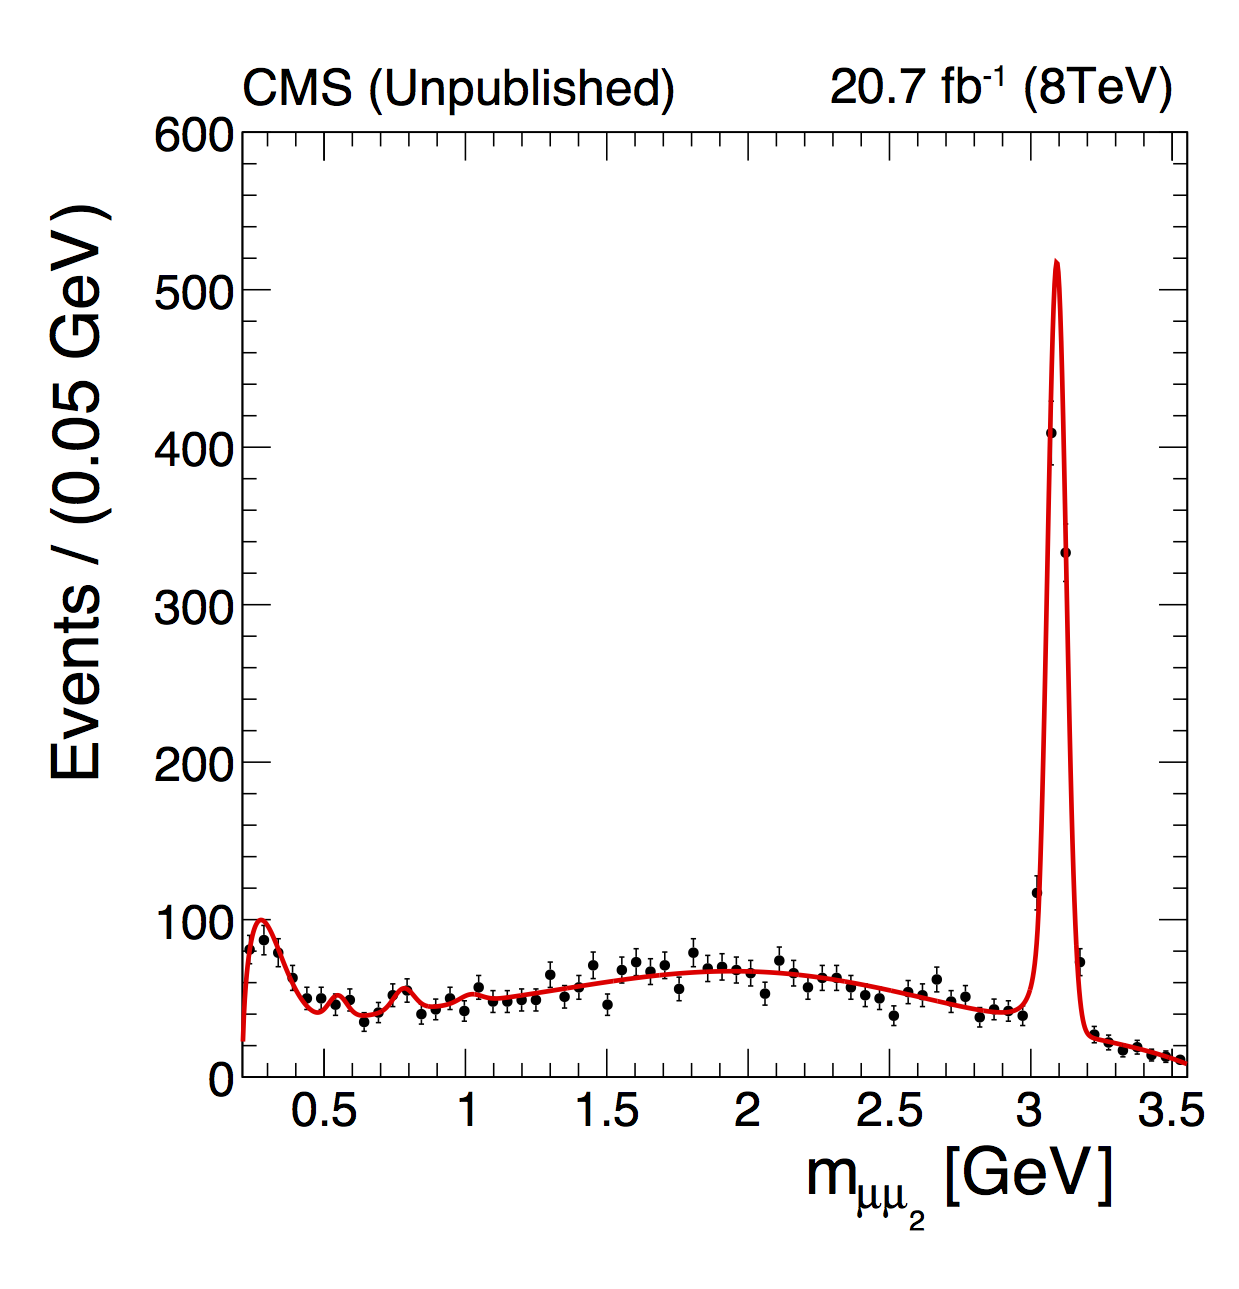
Additional Figure 4:
$\text{b}\bar{\text{b}}$ background 1D template. The dimuon invariant mass distribution for a $\text{b}\bar{\text{b}}$-background-enriched data sample (solid circles) in which both muons satisfy the minimum pt and eta requirements ($ p_{T}> $ 8 GeV,$|\eta|<$2.4), and the template (solid line) used to describe the low mass resonances, where the $ \eta, \omega$ and $\phi$ are modeled using a gaussian distribution and the $ \mathrm{J/\psi}$ is parametrized with a Crystal Ball function, this distribution is commonly referred as $B_{8+8}$. |

png pdf |
Additional Figure 5:
$\text{b}\bar{\text{b}}$ background 3D template. The analytical template for the distribution of the dimuon masses $m_{\mu\mu_1}$ and $m_{\mu\mu_2}$ obtained using a $\text{b}\bar{\text{b}}$-background-enriched data sample. |
png pdf |
Additional Figure 6:
Prompt double $\mathrm{J/\psi}$ control sample (Invariant mass selection). Mass distribution for the first ($m_{\mu\mu_{1}}$) and second ($m_{\mu\mu_{2}}$) dimuon in data after applying initial double $\mathrm{J/\psi}$ control sample selection (i.e trigger, muon pt, muon eta), the long tails correspond to $\mathrm{J/\psi}$'s coming from b-decays or non-resonant dimuon pairs from semileptonic decays of b-quark, only events in which the dimuon invariant mass is between 2.8 and 3.3 GeV are selected (events inside the box). |
png pdf |
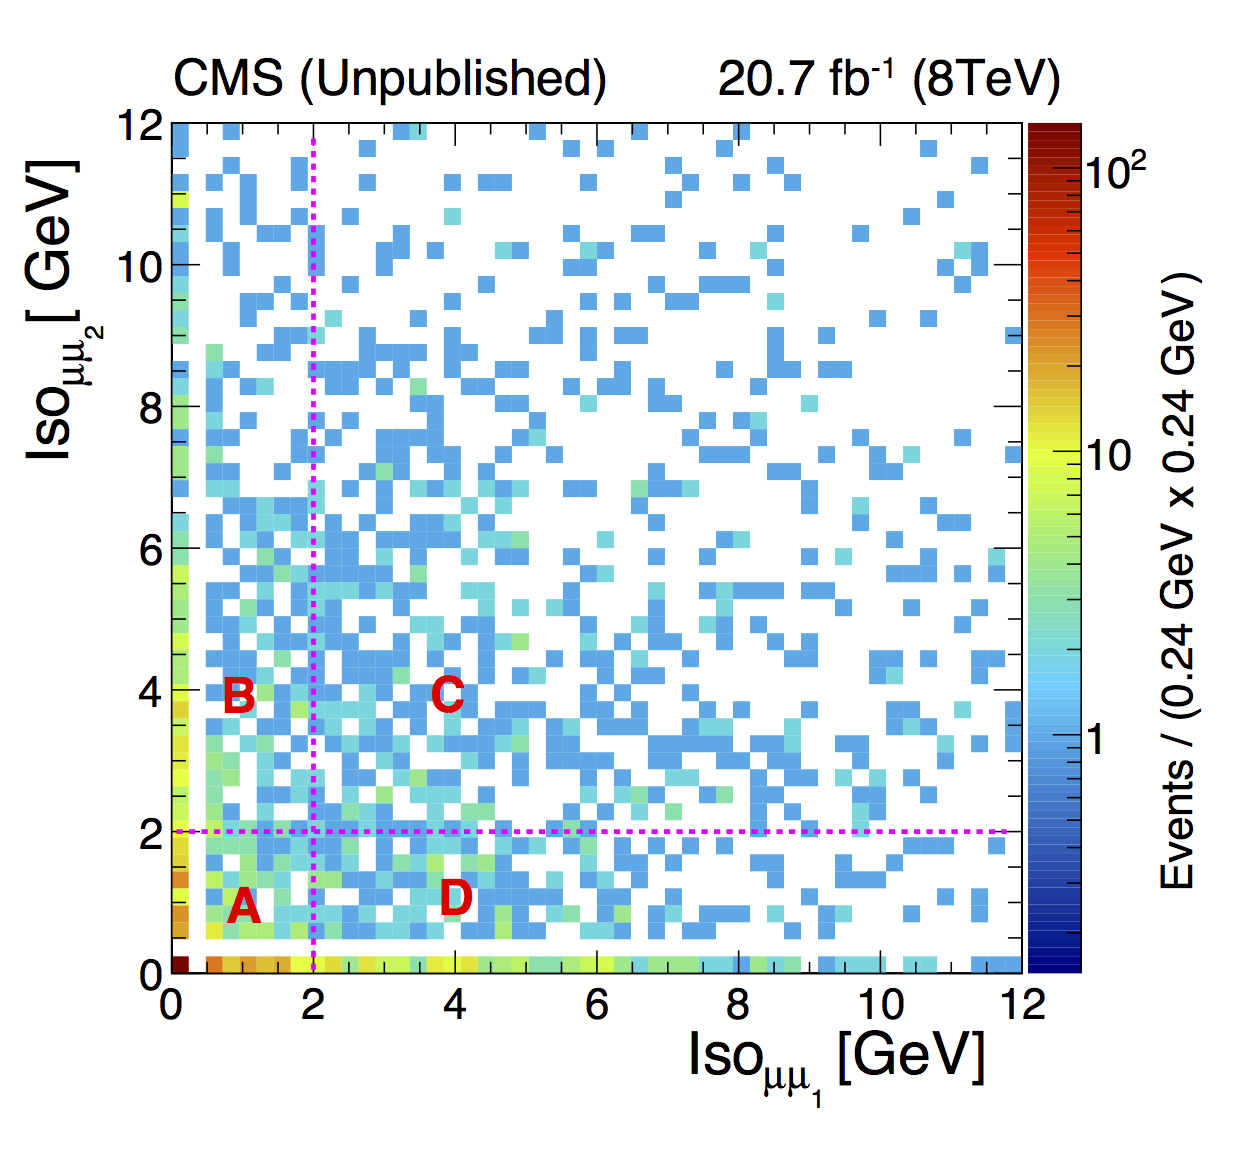
Additional Figure 7:
Prompt double $\mathrm{J/\psi}$ control sample ("non-prompt" subtraction 1). Isolation distribution for the first ($Iso_{\mu\mu_{1}}$) and second ($Iso_{\mu\mu_{2}}$) dimuon in data (including the invariant mass cut 2.8 $ < m_{\mu\mu} < $ 3.3 GeV), most of the "prompt" events are located inside region A, while the contribution from "non-prompt" events in this region is subtracted using non-isolated sidebands (B,C,D) in data. |
png pdf |
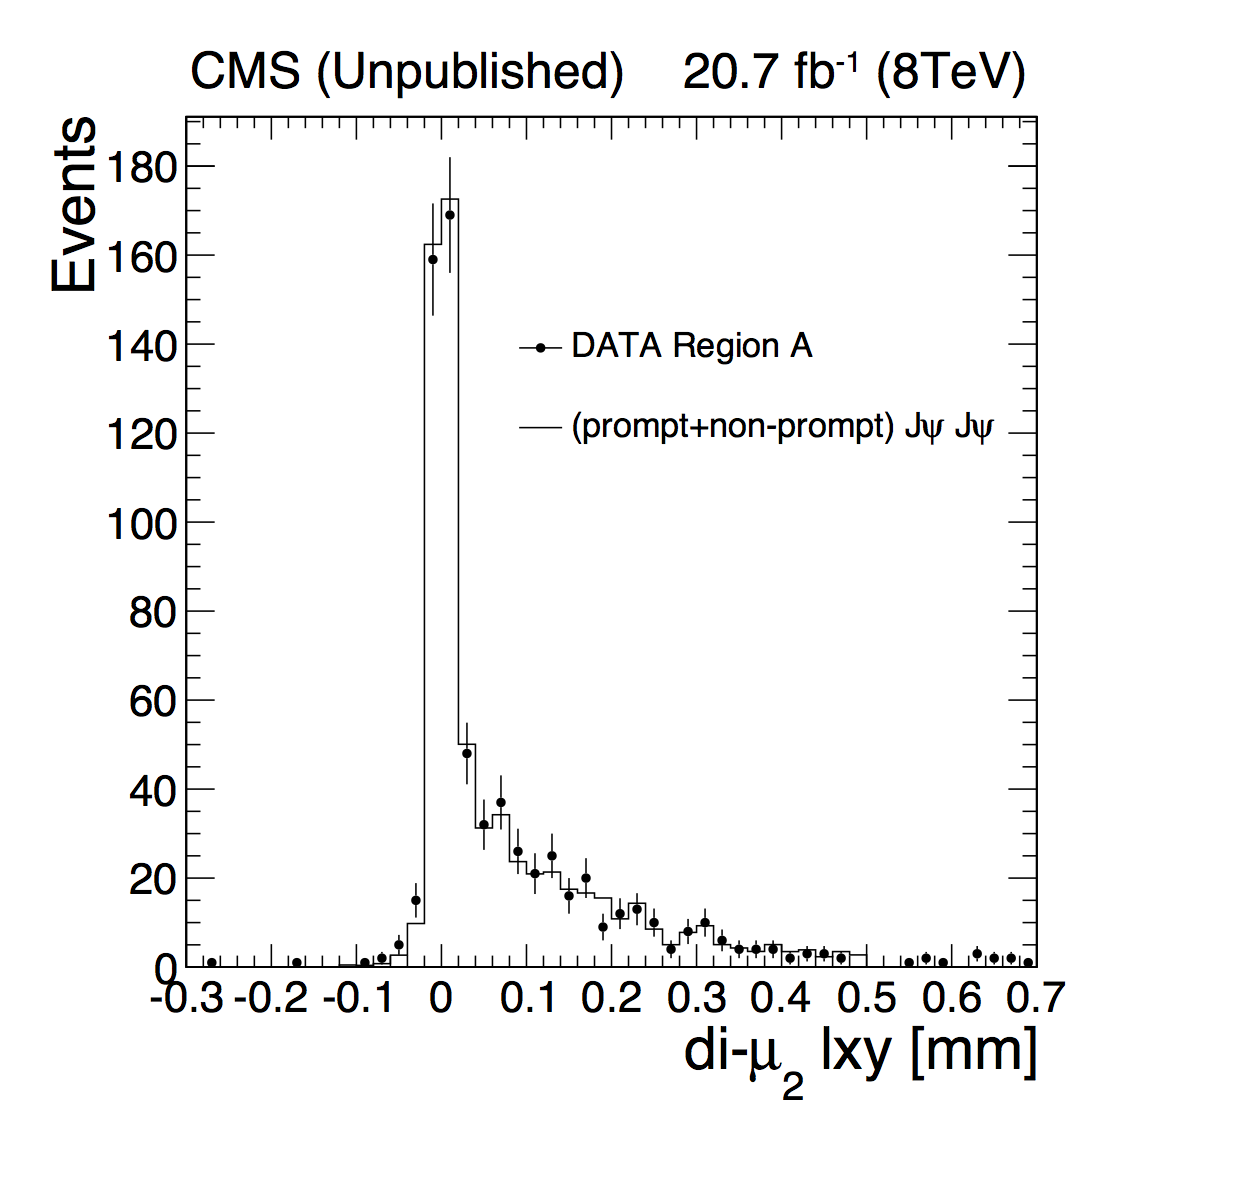
Additional Figure 8:
Prompt double $\mathrm{J/\psi}$ control sample ("non-prompt" subtraction 2). The $L_{xy}$ distribution for the second dimuon ($\mu\mu_{2}$) after applying the control sample selection including the invariant mass cut 2.8 $ < m_{\mu\mu} < $ 3.3 GeV and dimuon isolation $Iso_{\mu\mu}<$ 2 GeV (black dots), the combined ("prompt"+"non-prompt") model is obtained by fitting the two templates to data, the "prompt" template was obtained from Monte Carlo signal sample and the "non-prompt" from a non-isolated sideband in data. |
png pdf |
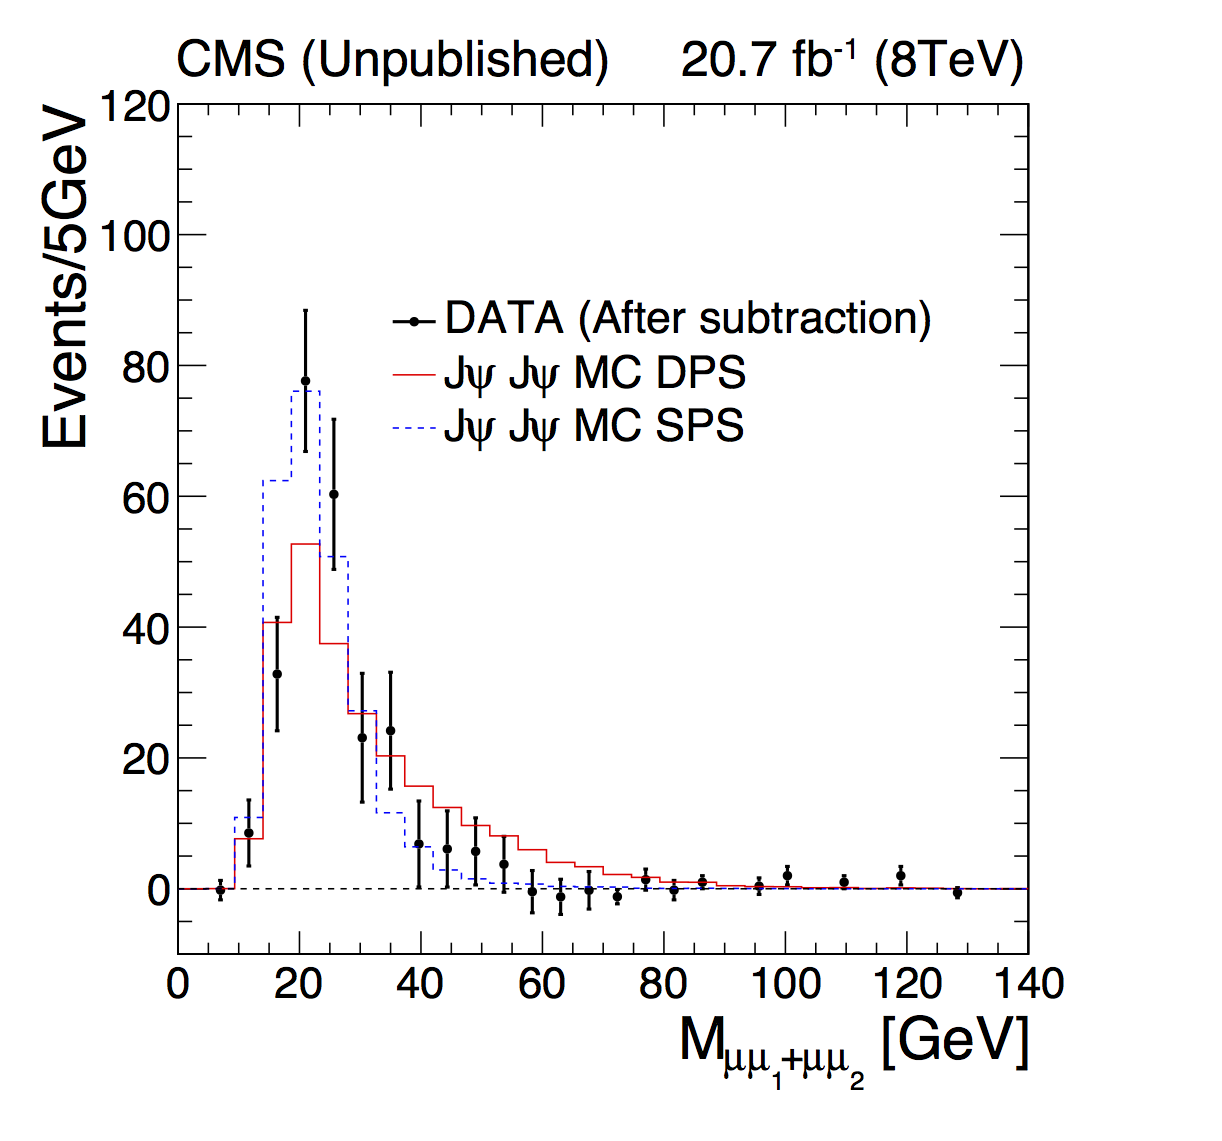
Additional Figure 9:
Prompt double $\mathrm{J/\psi}$ control sample. The two dimuon invariant mass distribution ($ M_{\mu\mu_{1}+\mu\mu_{2}}$) in data following the control sample selection with "non-prompt" contribution subtracted (black dots), and the corresponding DPS and SPS templates from Monte Carlo simulation (normalized to the number of events in data). |
png pdf |
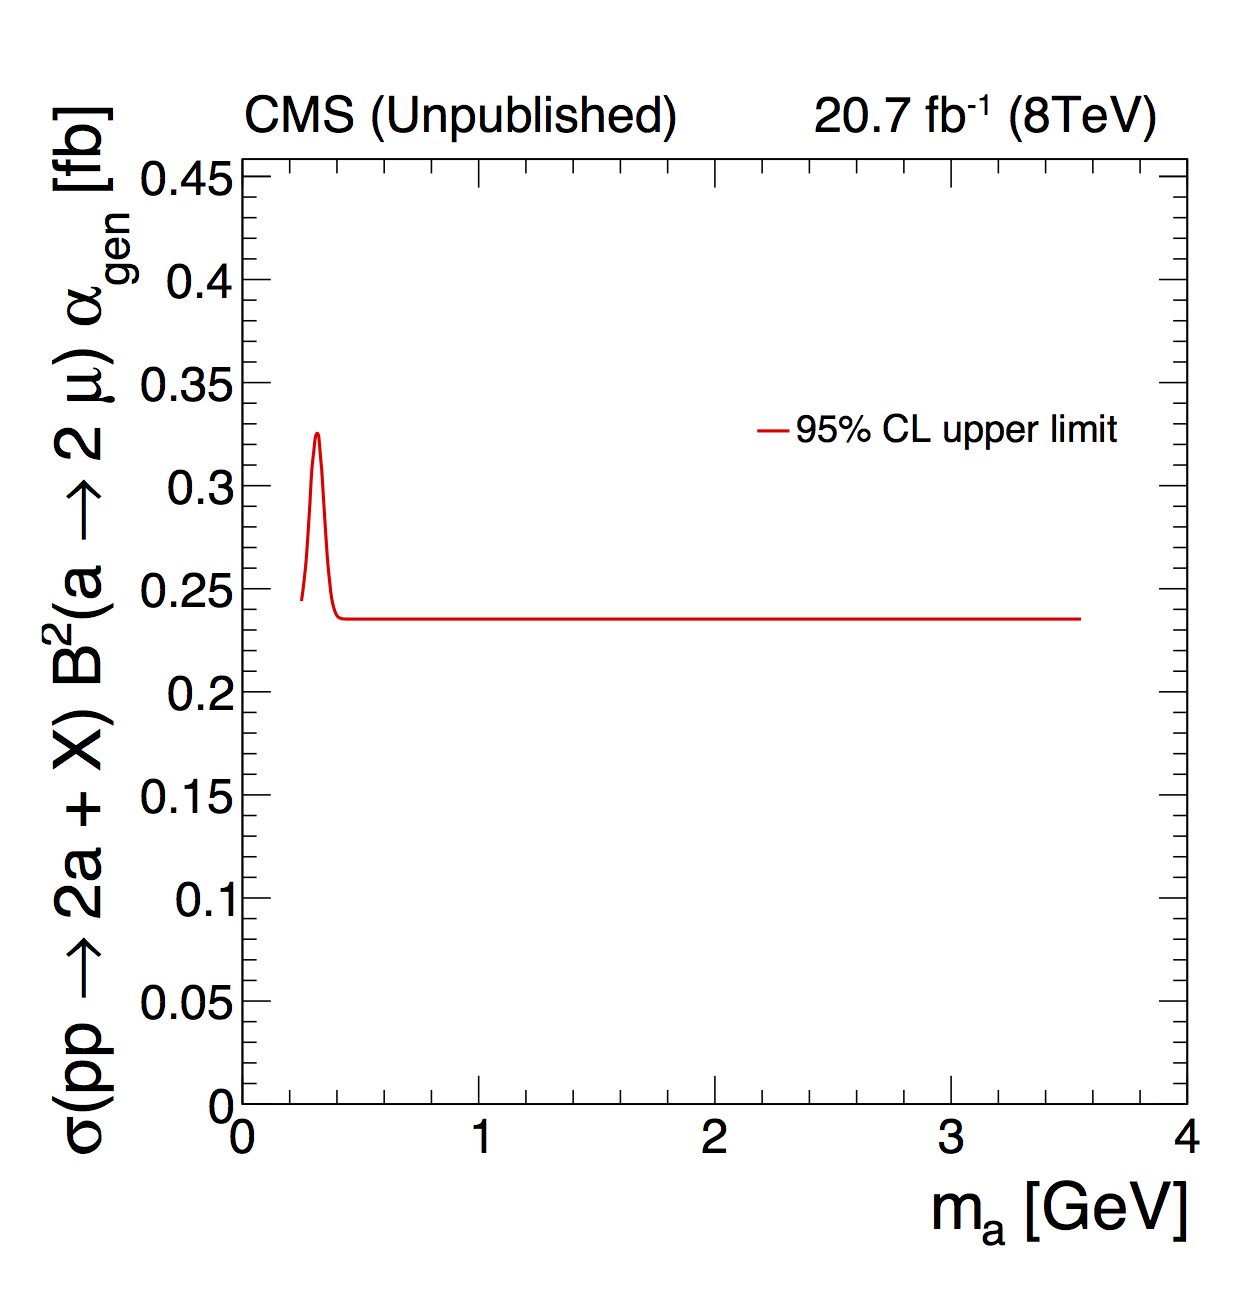
Additional Figure 10:
Model Independent Limit. Model independent 95% CL upper limit on the product of the cross section times branching fraction times acceptance: $\sigma(\text{p}\text{p} \rightarrow 2 \text{a} + \text{X}) \times \mathcal{B}^2 (\text{a} \rightarrow 2\mu) \times \alpha_{\text{gen}}$ , where $\alpha_{gen}$ is the generator level acceptance including the fiducial cut ($L_{xy}<$ 4.4 cm and $|L_{z}|<$ 34.5 cm). |
png pdf |
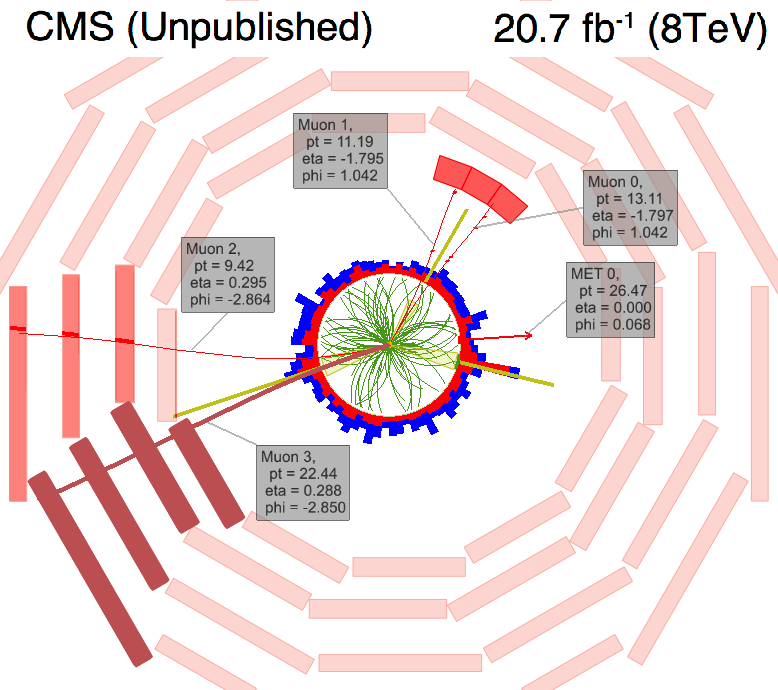
Additional Figure 11:
Signal candidate event display. Display of the one event in the data which survived all selection requirements. Muons are shown as red curves with parameters labeled. Muon chambers are shown as red shapes. Inner silicon tracker is outlined with charged tracks shown as green curves, the image shows a 2D cross section of the CMS detector. |
png pdf |
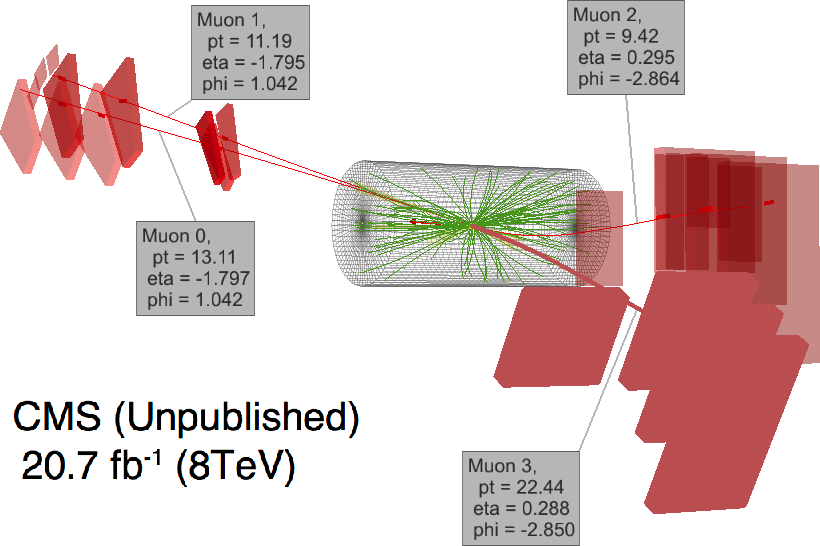
Additional Figure 12:
Signal candidate event display. Display of the one event in the data which survived all selection requirements. Muons are shown as red curves with parameters labeled. Muon chambers are shown as red shapes. Inner silicon tracker is outlined with charged tracks shown as green curves, the image shows a 3D representation of the CMS detector. |
png pdf |
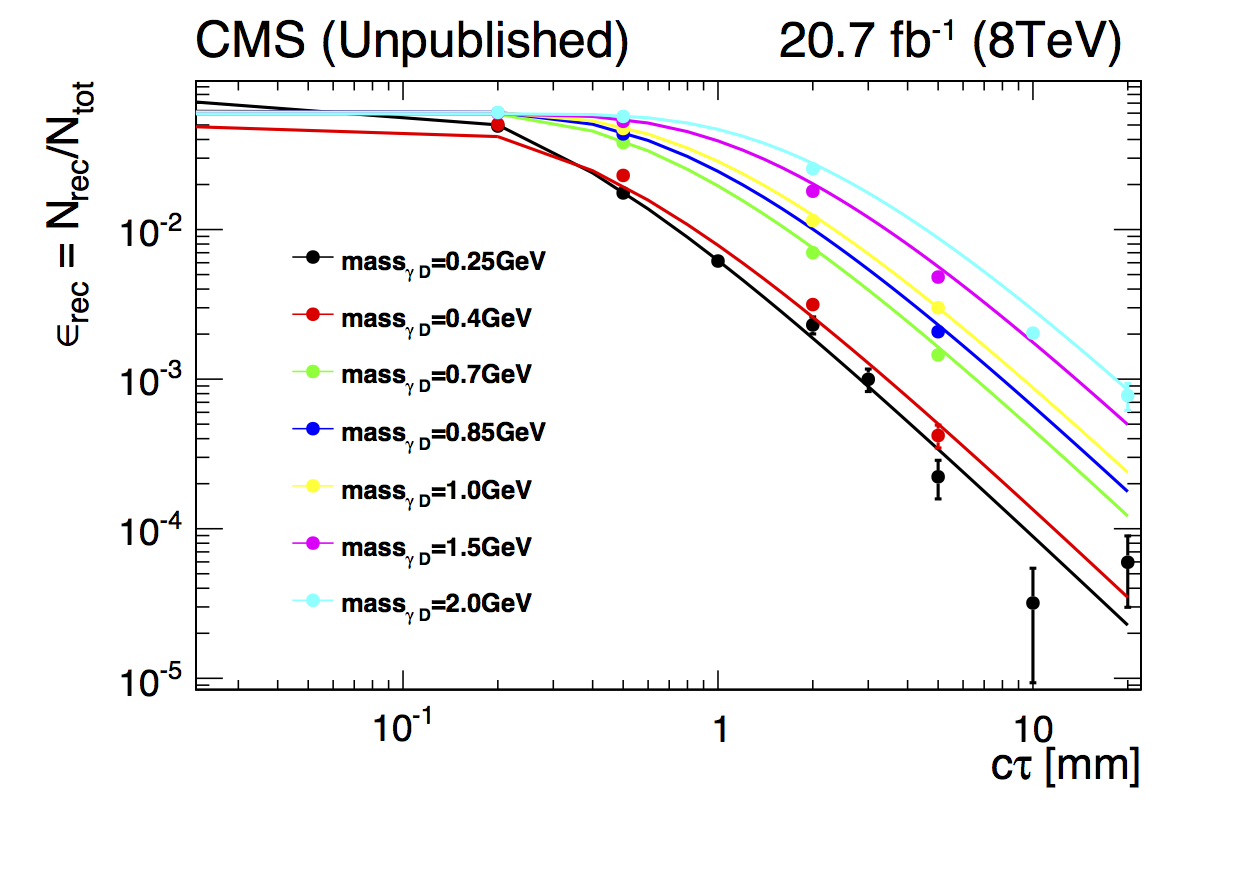
Additional Figure 13:
Interpolated acceptance $\epsilon_{rec}$ of the analysis selection requirements, evaluated using the dark SUSY simulated MC samples for several sets of $m_{\gamma D}$ and $c\tau_{\gamma D}$ (solid bullets) and extrapolated to other points in the ($m_{\gamma D}$, $c\tau_{\gamma D}$) plane. The plot shows the interpolation of the acceptance as a function of $c\tau_{\gamma D}$ (solid line). |
|
|
Compact Muon Solenoid LHC, CERN |
|

|

|

|

|

|