

Compact Muon Solenoid
LHC, CERN
| CMS-HIG-14-002 ; CERN-PH-EP-2014-078 | ||
| Constraints on the Higgs boson width from off-shell production and decay to Z-boson pairs | ||
| CMS Collaboration | ||
| 14 May 2014 | ||
| Phys. Lett. B 736 (2014) 64 | ||
| Abstract: Constraints are presented on the total width of the recently discovered Higgs boson, $ \Gamma_{\mathrm{H}} $, using its relative on-shell and off-shell production and decay rates to a pair of Z bosons, where one Z boson decays to an electron or muon pair, and the other to an electron, muon, or neutrino pair. The analysis is based on the data collected by the CMS experiment at the LHC in 2011 and 2012, corresponding to integrated luminosities of 5.1 fb$ ^{-1} $ at a centre-of-mass energy $ \sqrt{s} $ = 7 TeV and 19.7 fb$ ^{-1} $ at $ \sqrt{s} $ = 8 TeV. A simultaneous maximum likelihood fit to the measured kinematic distributions near the resonance peak and above the Z-boson pair production threshold leads to an upper limit on the Higgs boson width of $\Gamma_{\mathrm{H}}$ less than 22 MeV at a 95% confidence level, which is 5.4 times the expected value in the standard model at the measured mass. | ||
| Links: e-print arXiv:1405.3455 [hep-ex] (PDF) ; CDS record ; inSPIRE record ; Public twiki page ; CADI line (restricted) ; | ||
| Figures | |

png pdf |
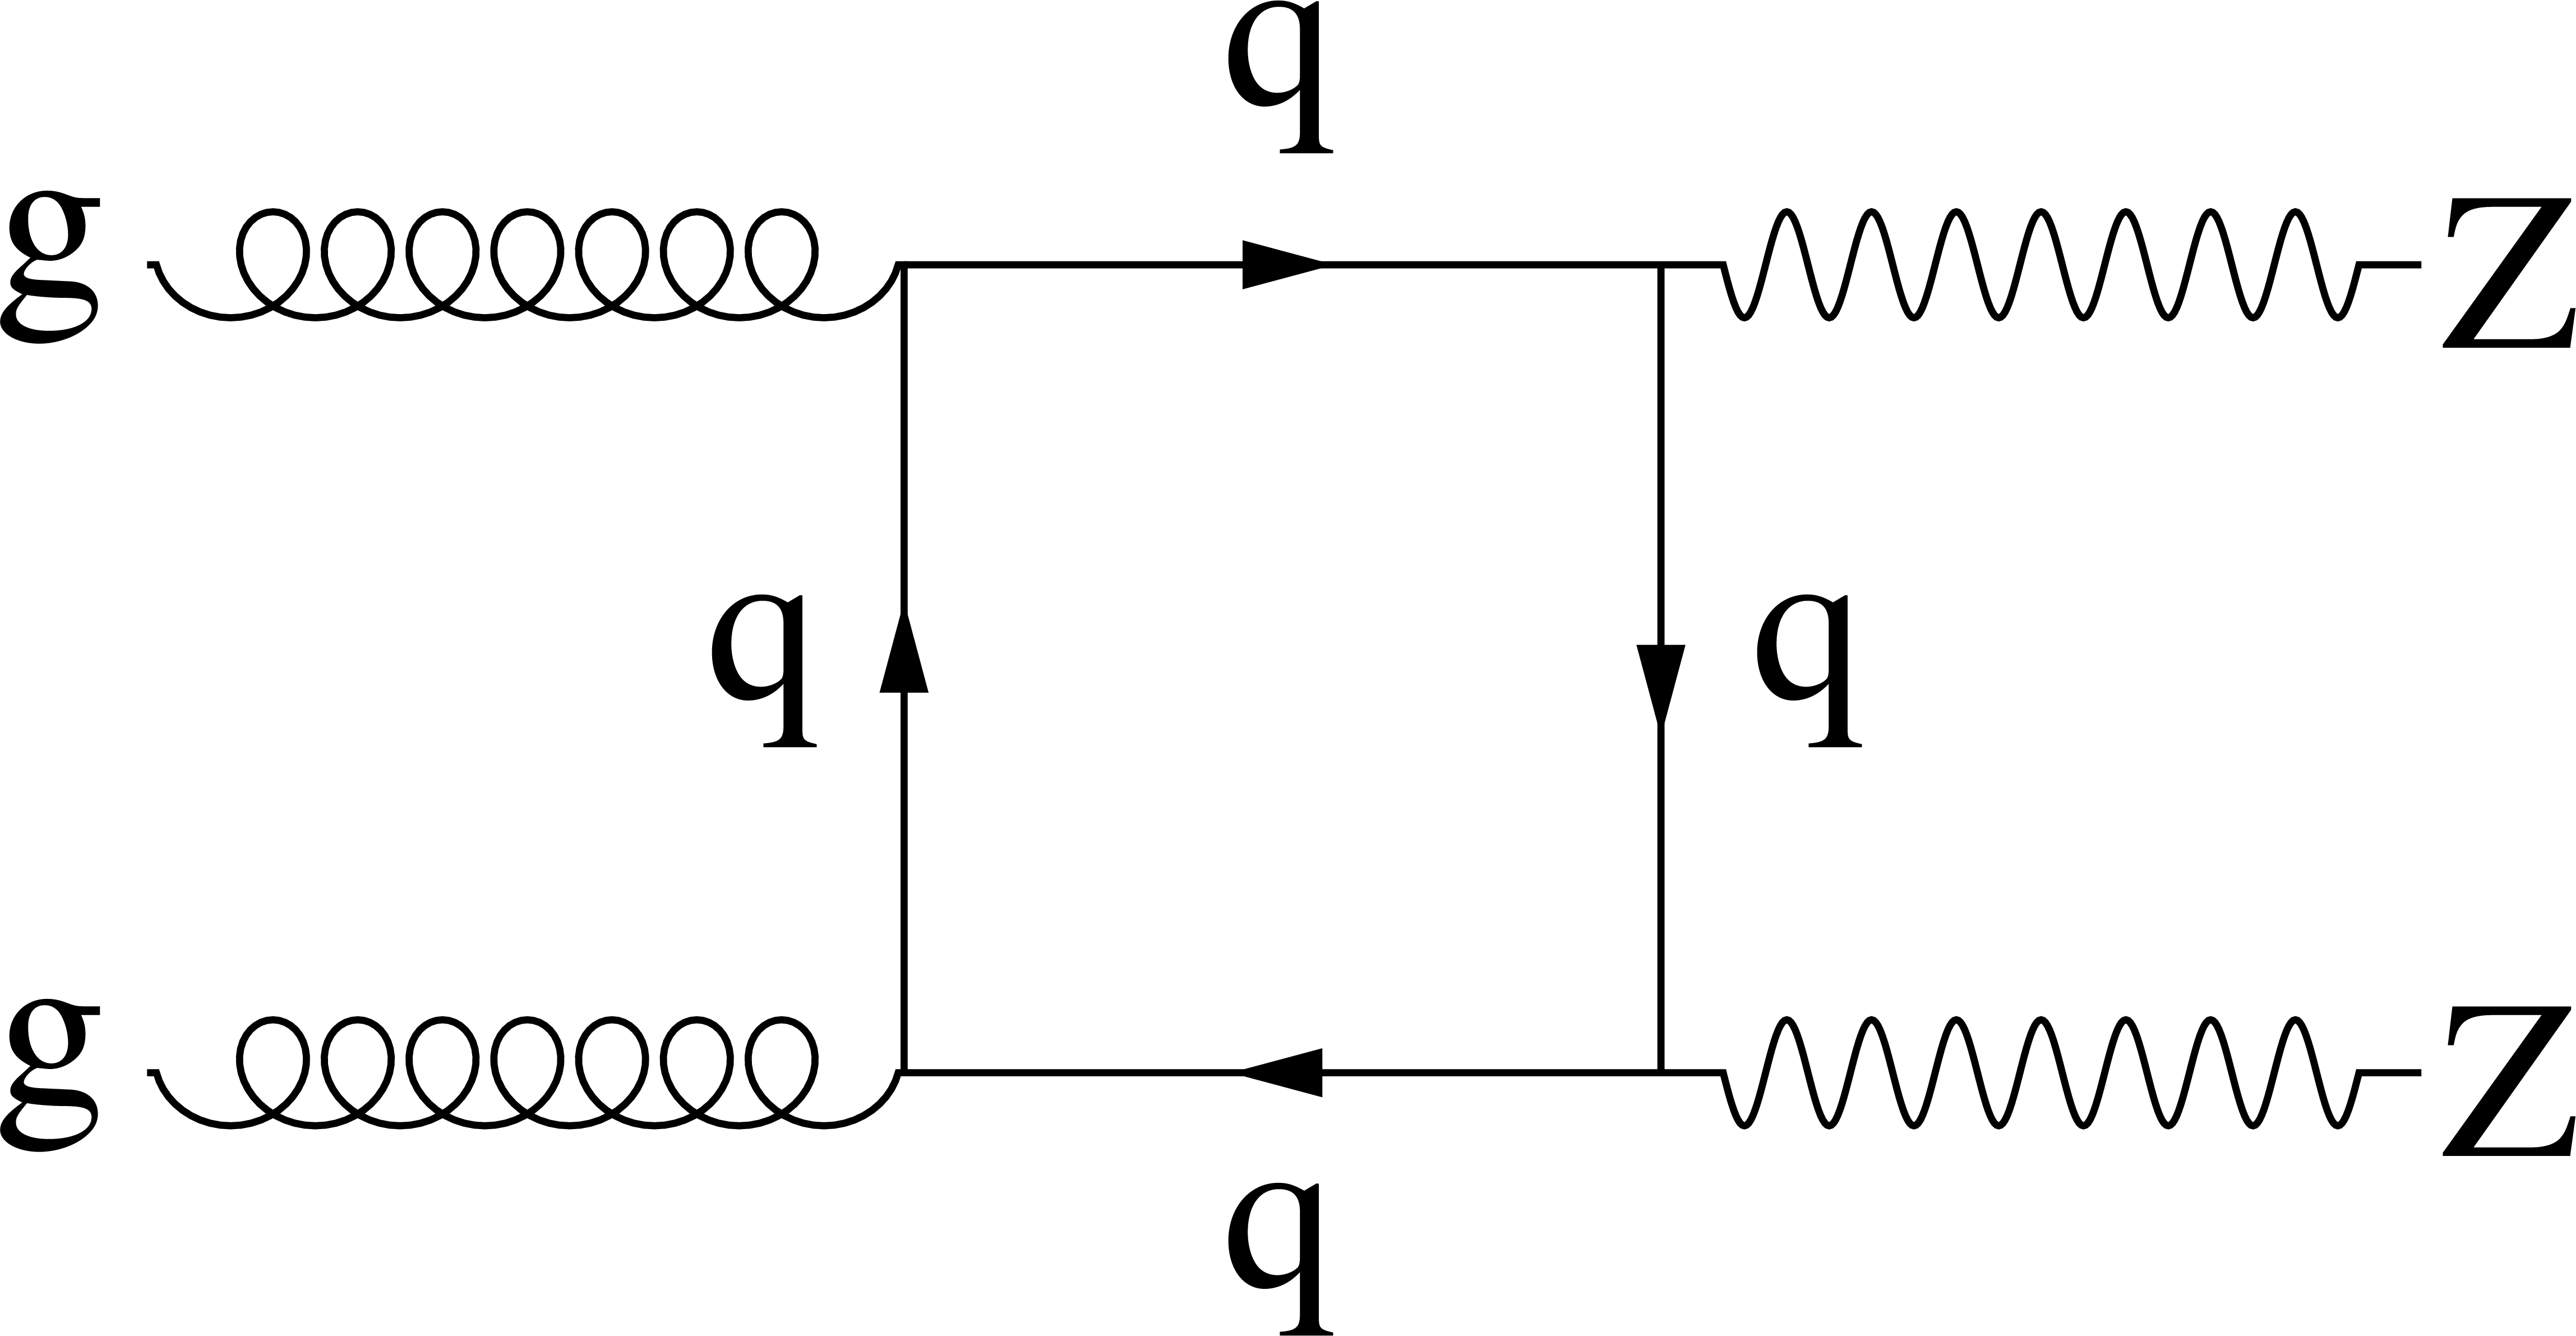
Figure 1-a:
Lowest order contributions to the main $ { {\mathrm {Z}}} { {\mathrm {Z}}}$ production processes: (a) quark-initiated production, $ {\mathrm {q}} {\mathrm {\overline {q}}}\to { {\mathrm {Z}}} { {\mathrm {Z}}}$, (b) gg continuum background production, $ {\mathrm {g}} {\mathrm {g}}\to { {\mathrm {Z}}} { {\mathrm {Z}}}$, and (c) Higgs-mediated gg production, $ {\mathrm {g}} {\mathrm {g}}\to {\mathrm {H}} \to { {\mathrm {Z}}} { {\mathrm {Z}}}$, the signal. |
png pdf |
Figure 1-b:
Lowest order contributions to the main $ { {\mathrm {Z}}} { {\mathrm {Z}}}$ production processes: (a) quark-initiated production, $ {\mathrm {q}} {\mathrm {\overline {q}}}\to { {\mathrm {Z}}} { {\mathrm {Z}}}$, (b) gg continuum background production, $ {\mathrm {g}} {\mathrm {g}}\to { {\mathrm {Z}}} { {\mathrm {Z}}}$, and (c) Higgs-mediated gg production, $ {\mathrm {g}} {\mathrm {g}}\to {\mathrm {H}} \to { {\mathrm {Z}}} { {\mathrm {Z}}}$, the signal. |
png pdf |
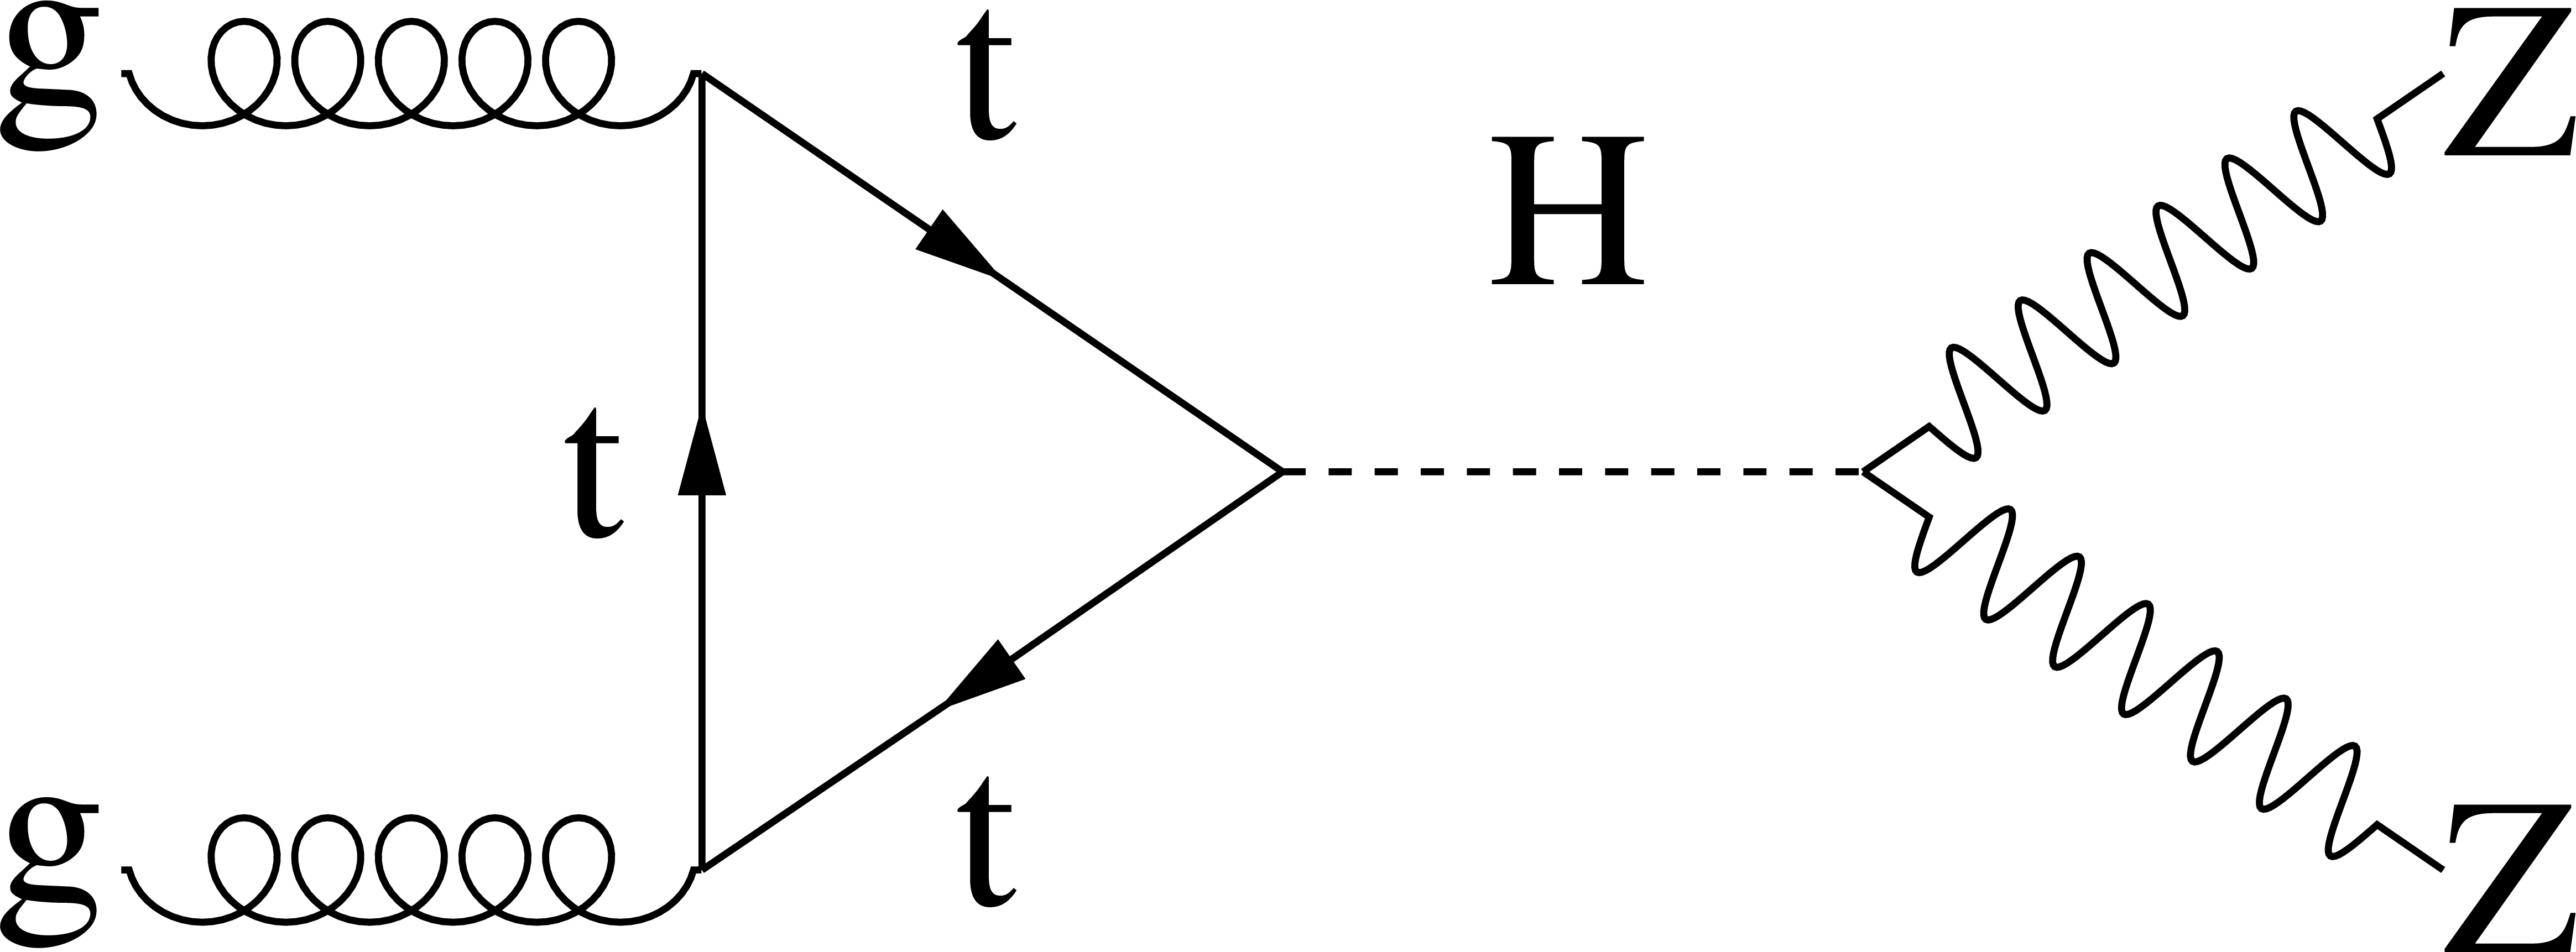
Figure 1-c:
Lowest order contributions to the main $ { {\mathrm {Z}}} { {\mathrm {Z}}}$ production processes: (a) quark-initiated production, $ {\mathrm {q}} {\mathrm {\overline {q}}}\to { {\mathrm {Z}}} { {\mathrm {Z}}}$, (b) gg continuum background production, $ {\mathrm {g}} {\mathrm {g}}\to { {\mathrm {Z}}} { {\mathrm {Z}}}$, and (c) Higgs-mediated gg production, $ {\mathrm {g}} {\mathrm {g}}\to {\mathrm {H}} \to { {\mathrm {Z}}} { {\mathrm {Z}}}$, the signal. |
png pdf |
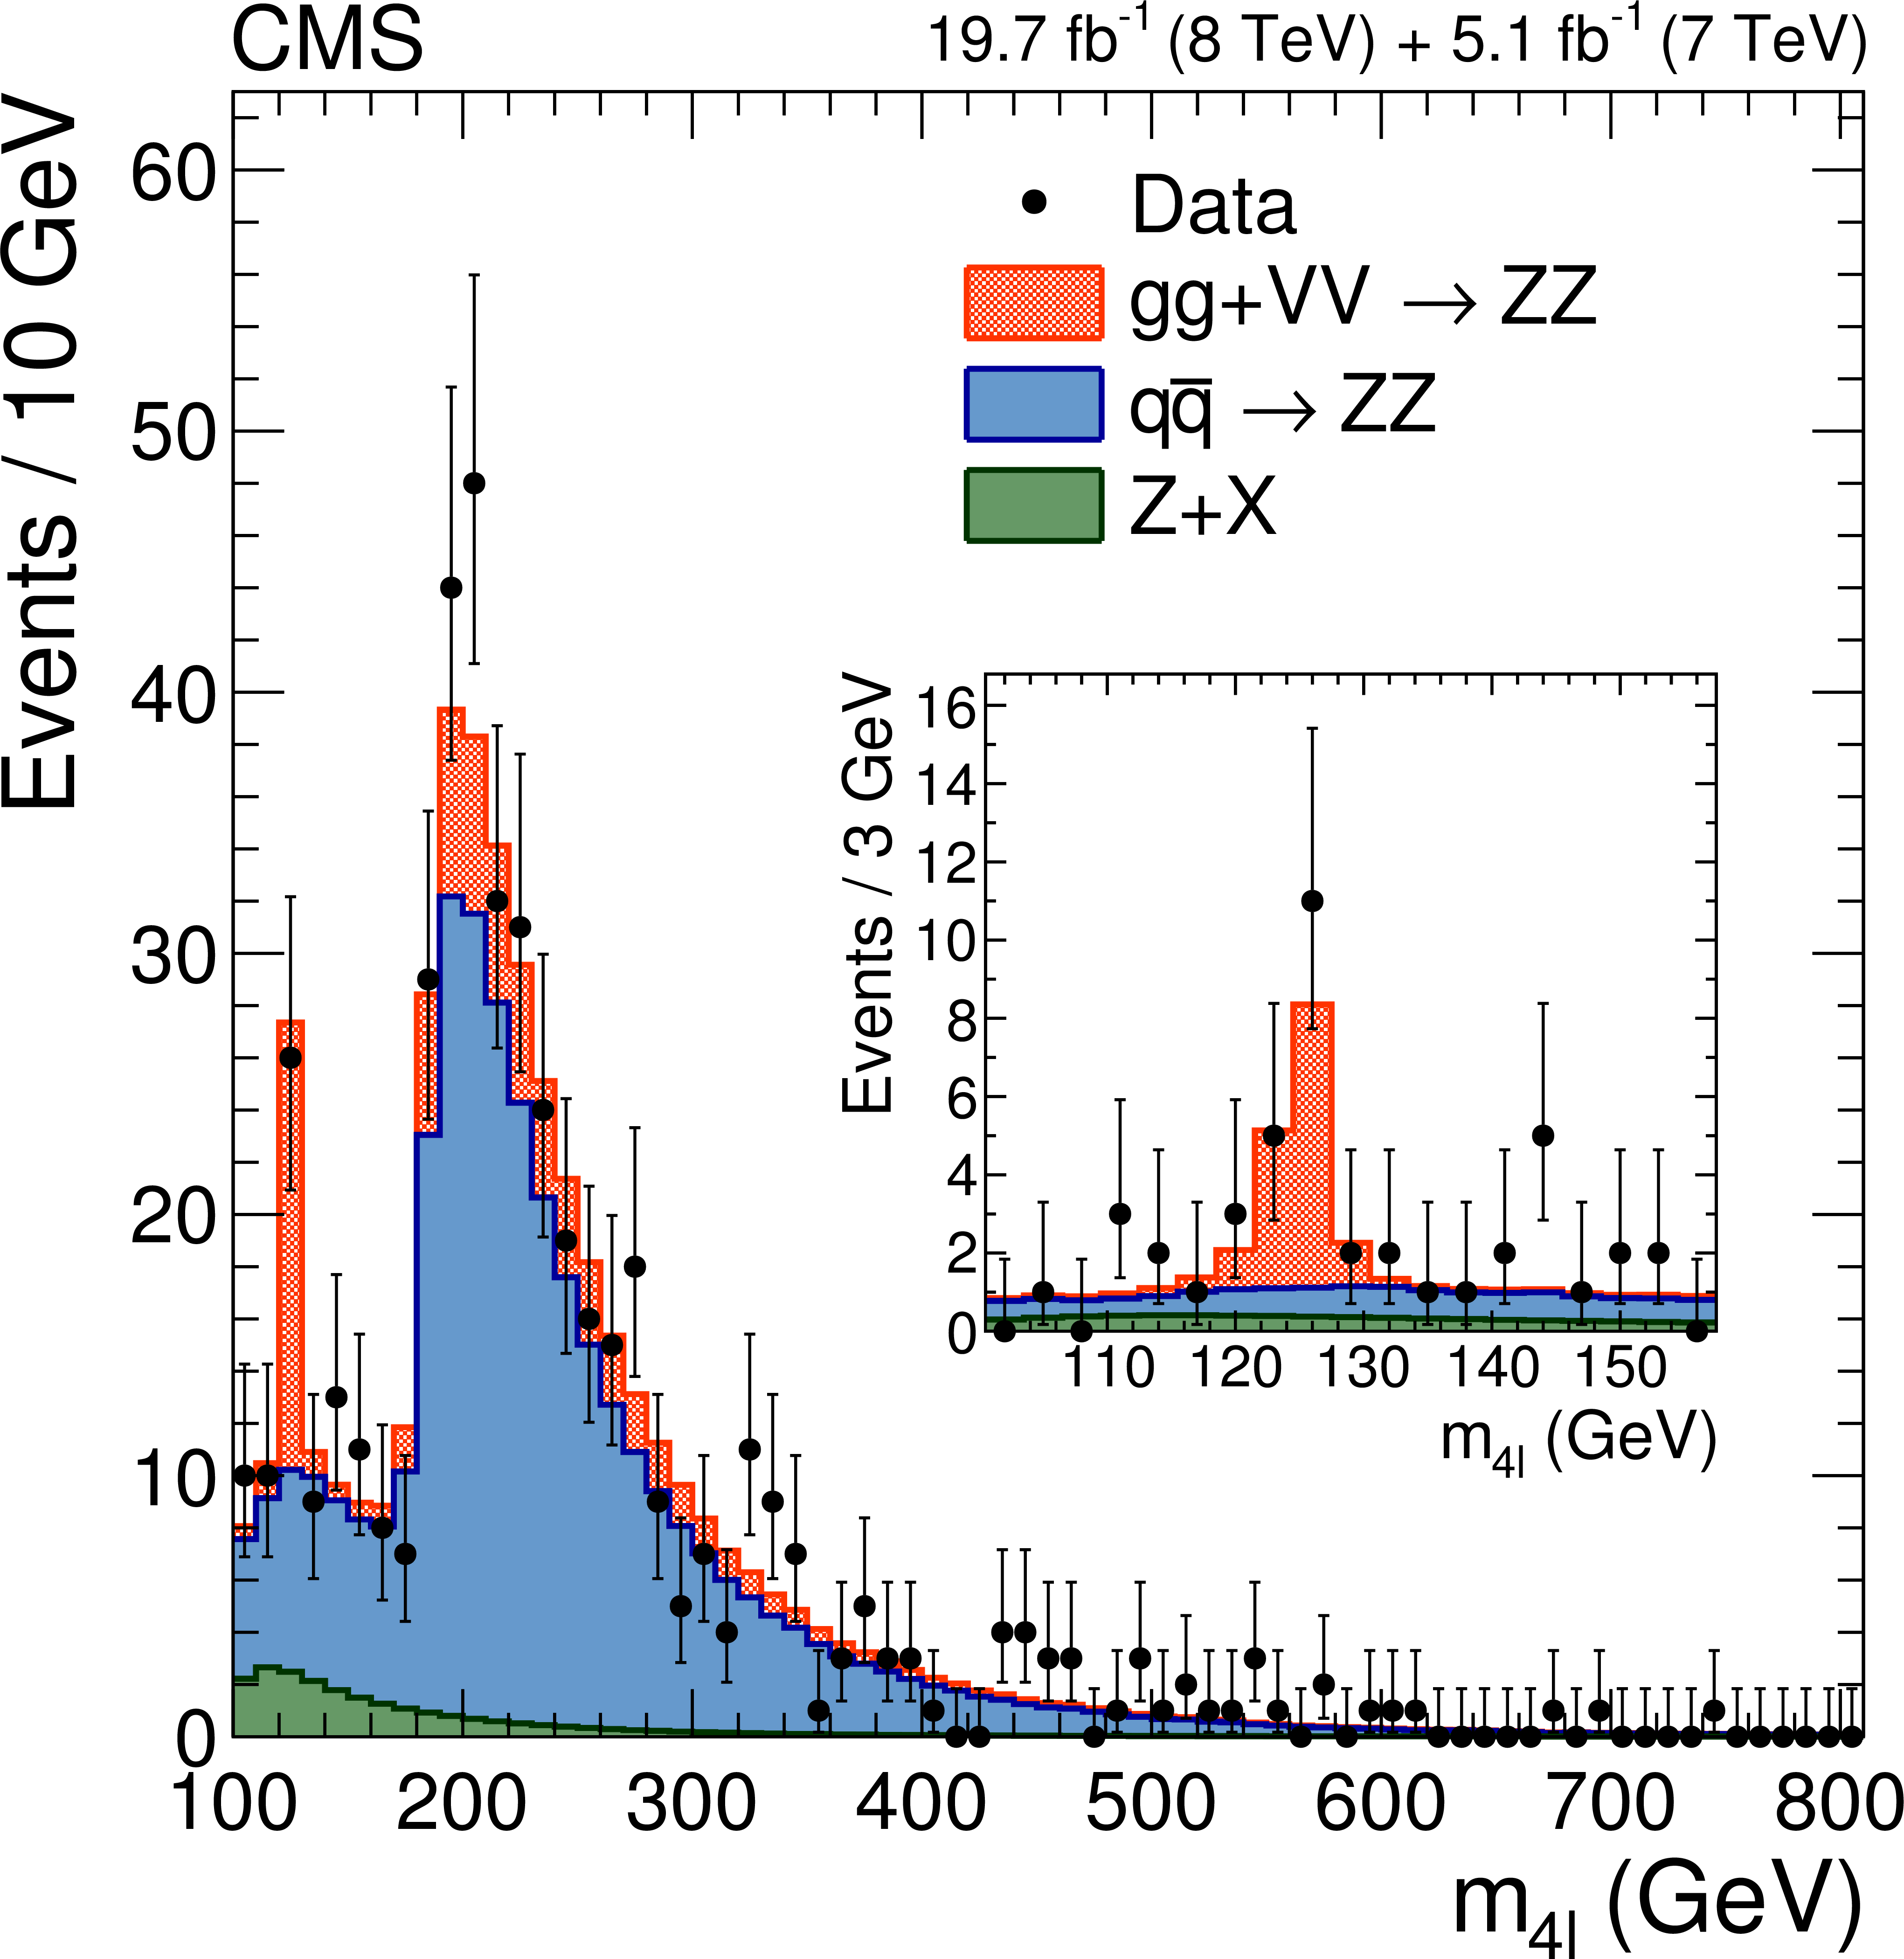
Figure 2:
Distribution of the four-lepton invariant mass in the range 100 $< m_{4\ell } <$ 800 GeV. Points represent the data, filled histograms the expected contributions from the reducible (Z+X) and $ {\mathrm {q}} {\mathrm {\overline {q}}}$ backgrounds, and from the sum of the gluon fusion (gg) and vector boson fusion (VV) processes, including the Higgs boson mediated contributions. The inset shows the distribution in the low mass region after a selection requirement on the MELA likelihood discriminant $\mathcal {D}_\text {bkg}^\text {kin} >$ 0.5. In this region, the contribution of the $ {\mathrm {t}\overline {\mathrm {t}}} $H and VH production processes is added to the dominant gluon fusion and VBF contributions. |
png pdf |
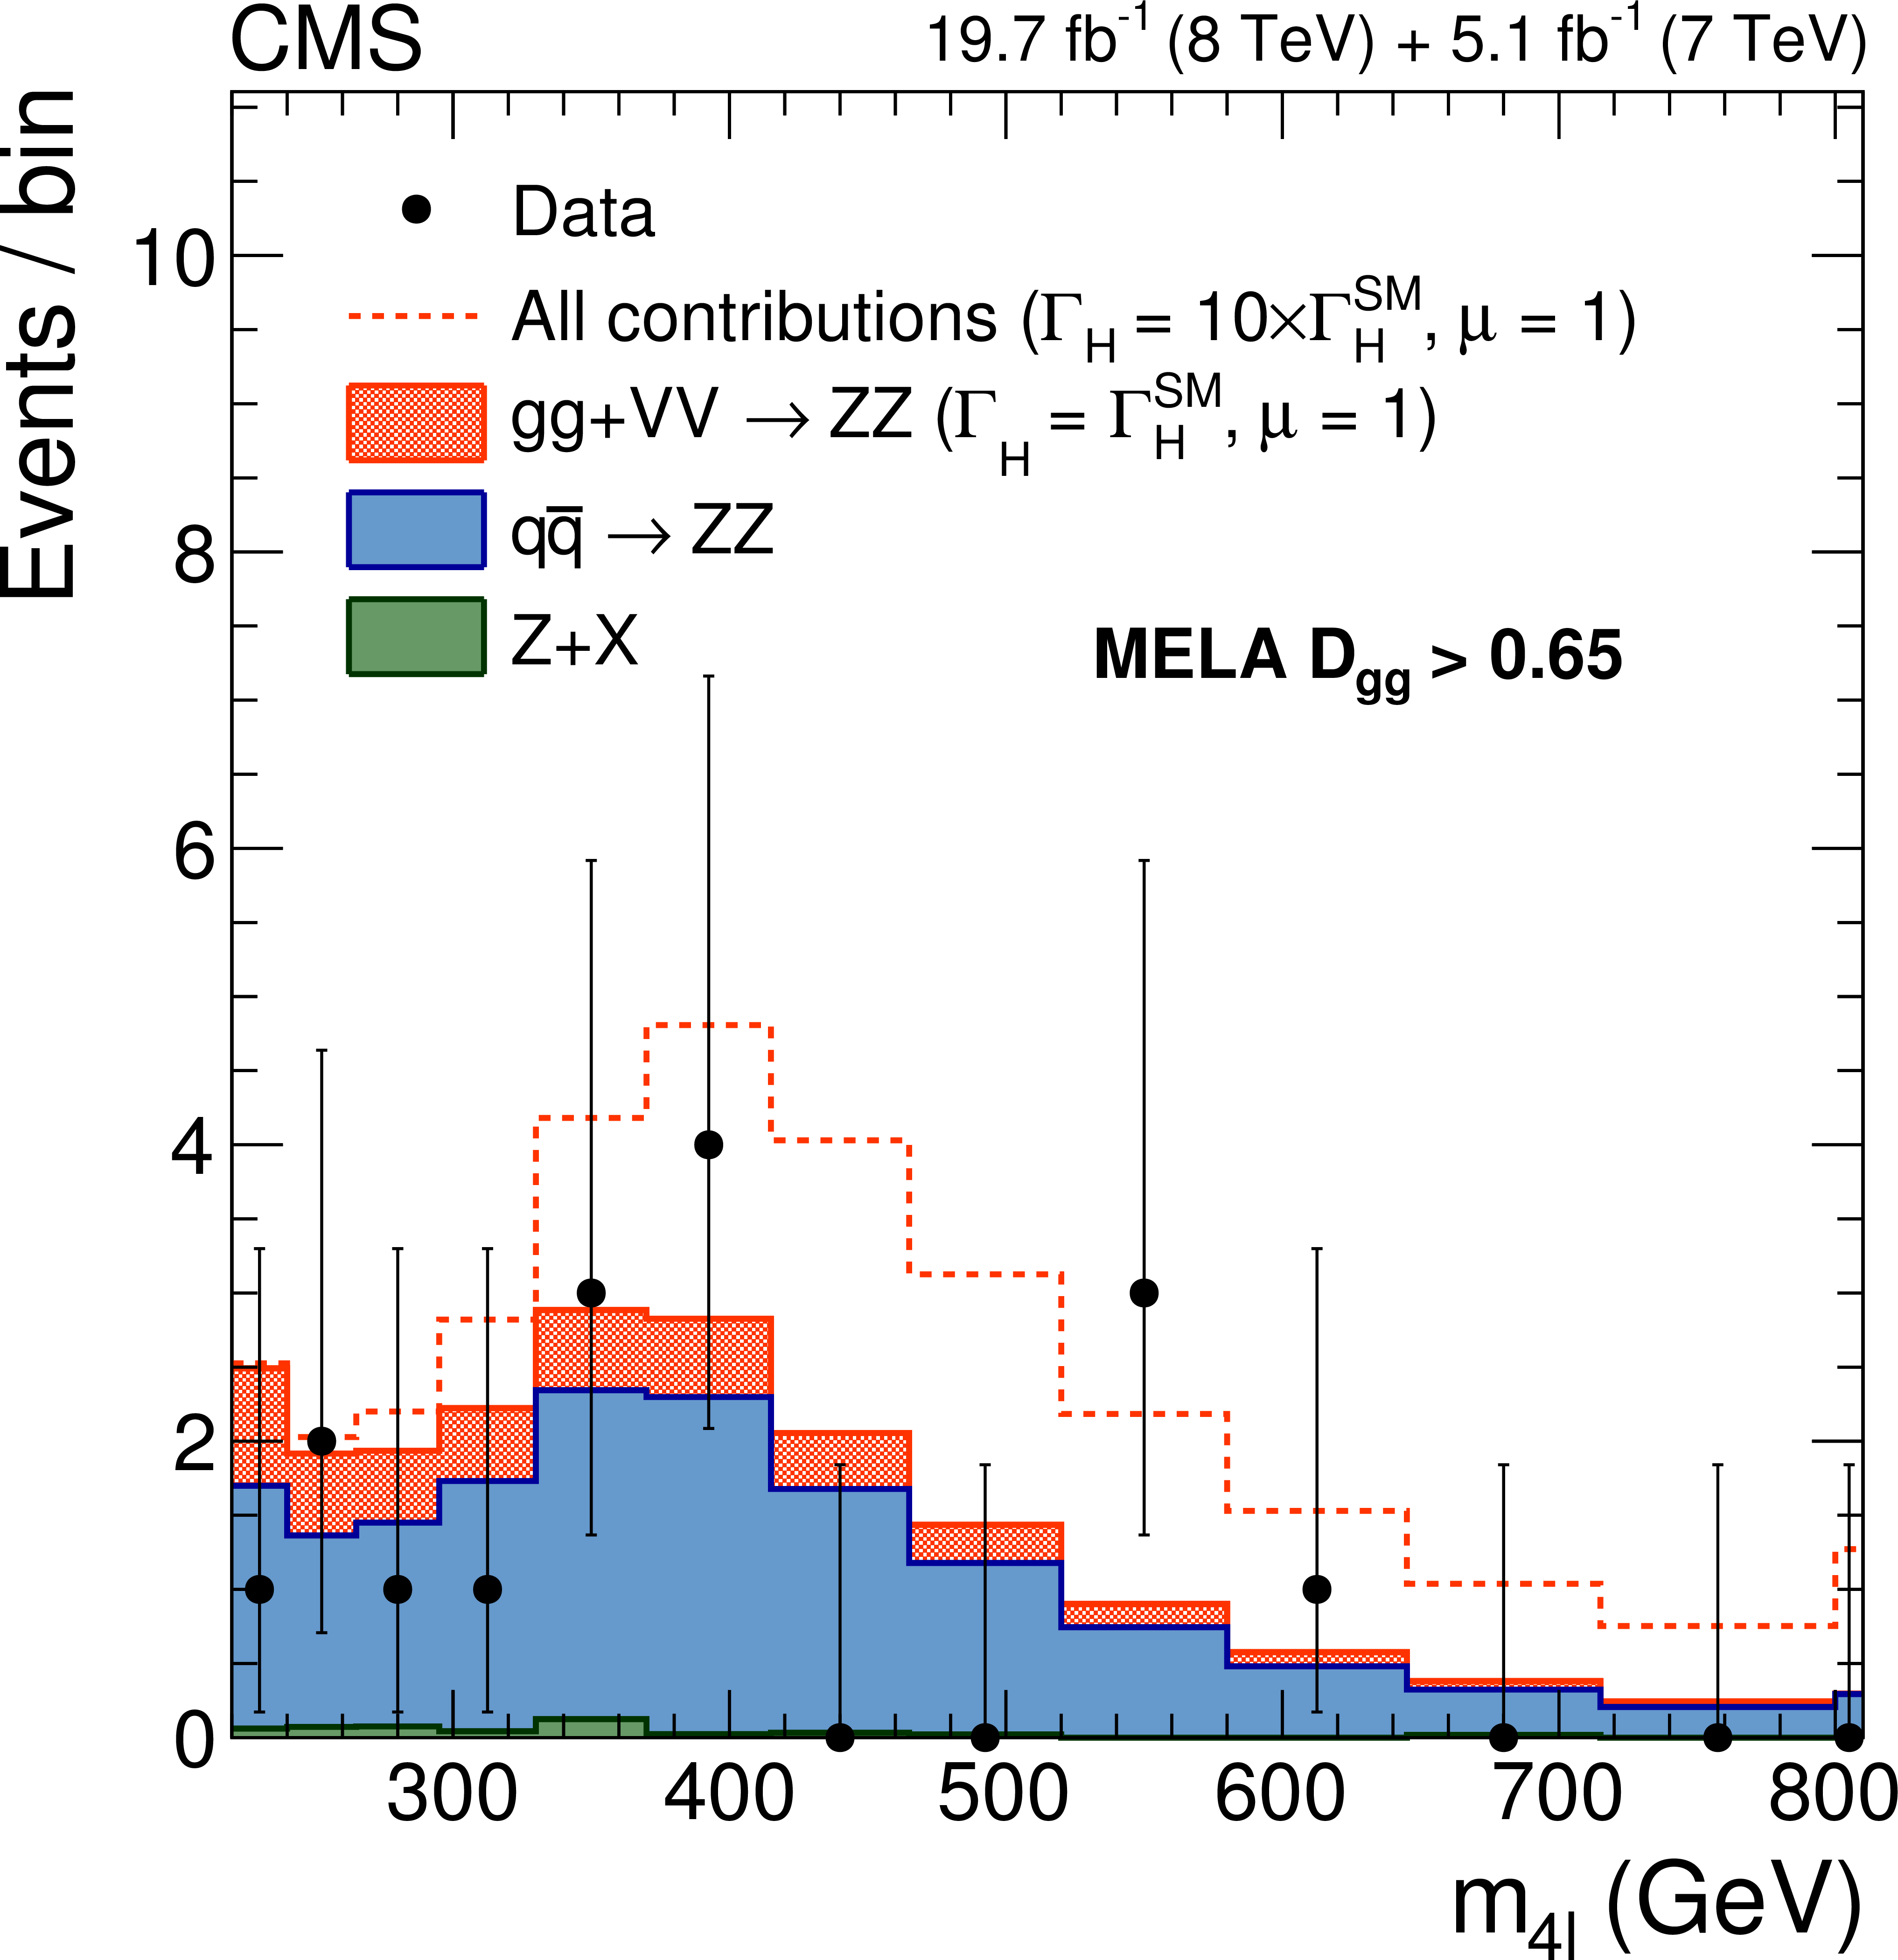
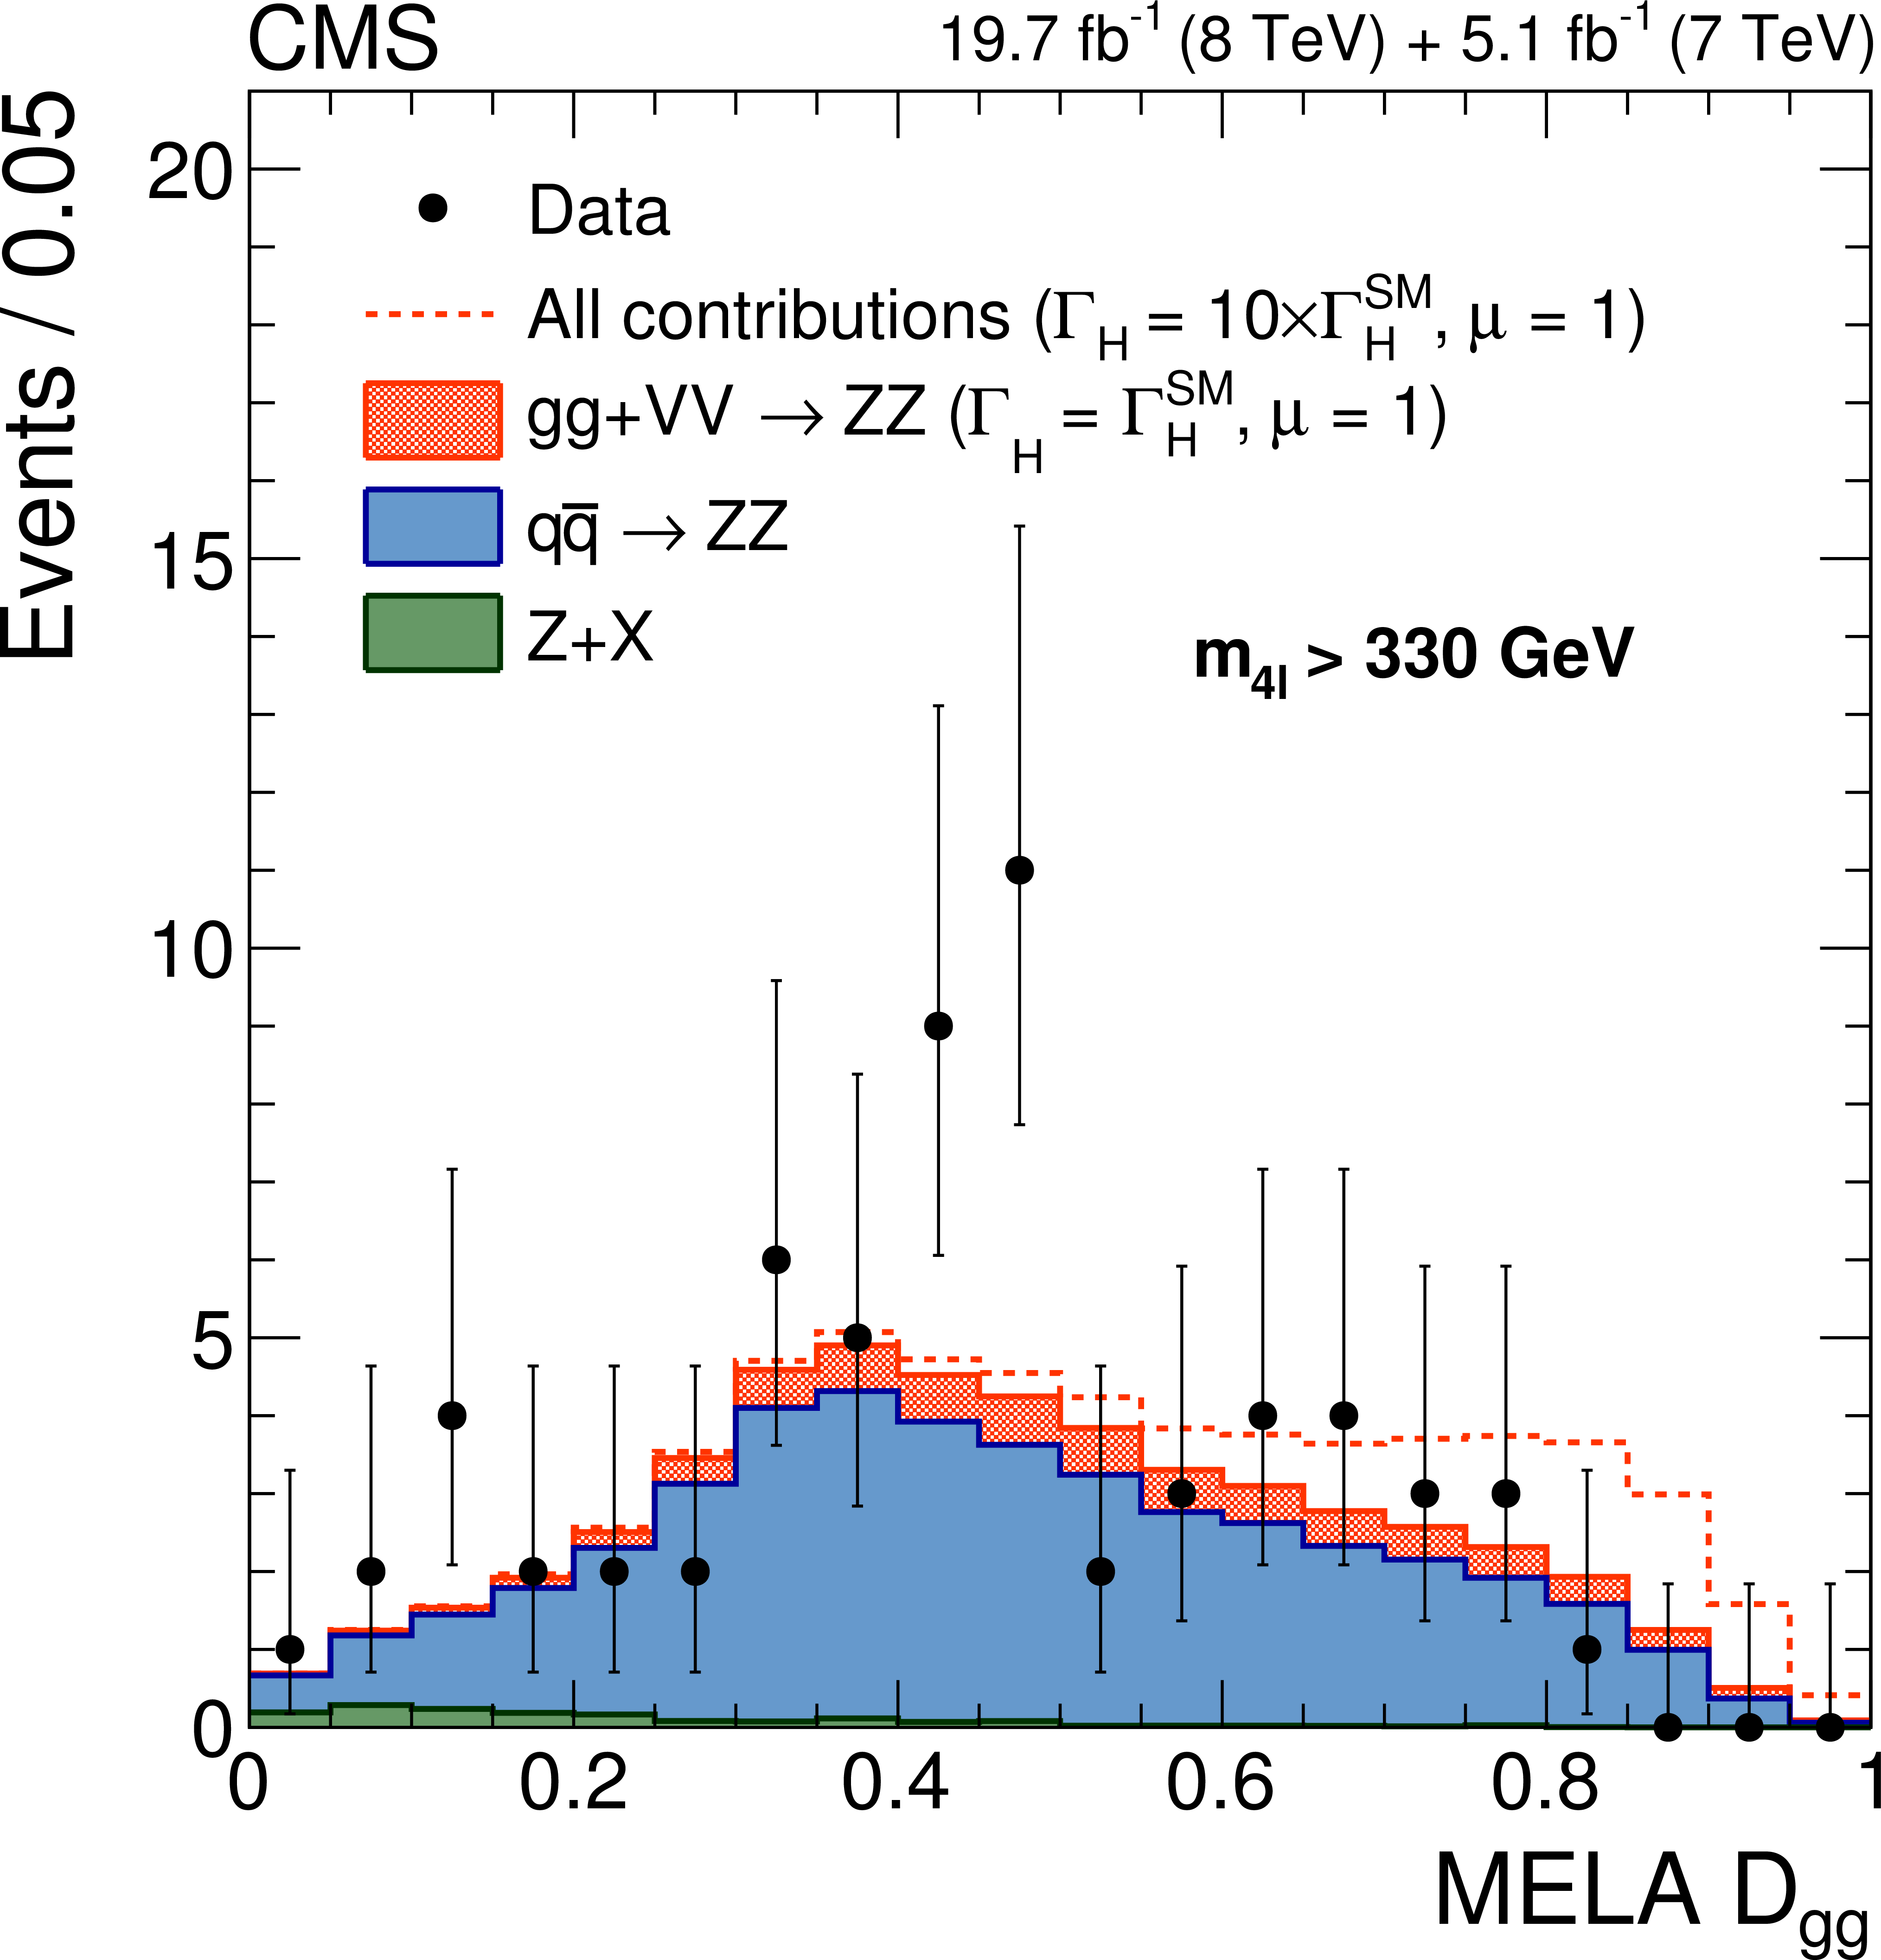
Figure 3-a:
Distributions of (a) the four-lepton invariant mass after a selection requirement on the MELA likelihood discriminant $\mathcal {D}_{ {\mathrm {g}} {\mathrm {g}}} >$ 0.65, and (b) the $\mathcal {D}_{ {\mathrm {g}} {\mathrm {g}}}$ likelihood discriminant for $m_{4\ell } > $ 330 GeV in the $4\ell $ channel. Points represent the data, filled histograms the expected contributions from the reducible (Z+X) and $ {\mathrm {q}} {\mathrm {\overline {q}}}$ backgrounds, and from the gluon fusion (gg) and vector boson fusion (VV) SM processes (including the Higgs boson mediated contributions). The dashed line corresponds to the total expected yield for a Higgs boson width and a squared product of the couplings scaled by a factor 10 with respect to their SM values. In the top plot, the bin size varies from 20 to 85 GeV and the last bin includes all entries with masses above 800 GeV . |
png pdf |
Figure 3-b:
Distributions of (a) the four-lepton invariant mass after a selection requirement on the MELA likelihood discriminant $\mathcal {D}_{ {\mathrm {g}} {\mathrm {g}}} >$ 0.65, and (b) the $\mathcal {D}_{ {\mathrm {g}} {\mathrm {g}}}$ likelihood discriminant for $m_{4\ell } > $ 330 GeV in the $4\ell $ channel. Points represent the data, filled histograms the expected contributions from the reducible (Z+X) and $ {\mathrm {q}} {\mathrm {\overline {q}}}$ backgrounds, and from the gluon fusion (gg) and vector boson fusion (VV) SM processes (including the Higgs boson mediated contributions). The dashed line corresponds to the total expected yield for a Higgs boson width and a squared product of the couplings scaled by a factor 10 with respect to their SM values. In the top plot, the bin size varies from 20 to 85 GeV and the last bin includes all entries with masses above 800 GeV . |
png pdf |
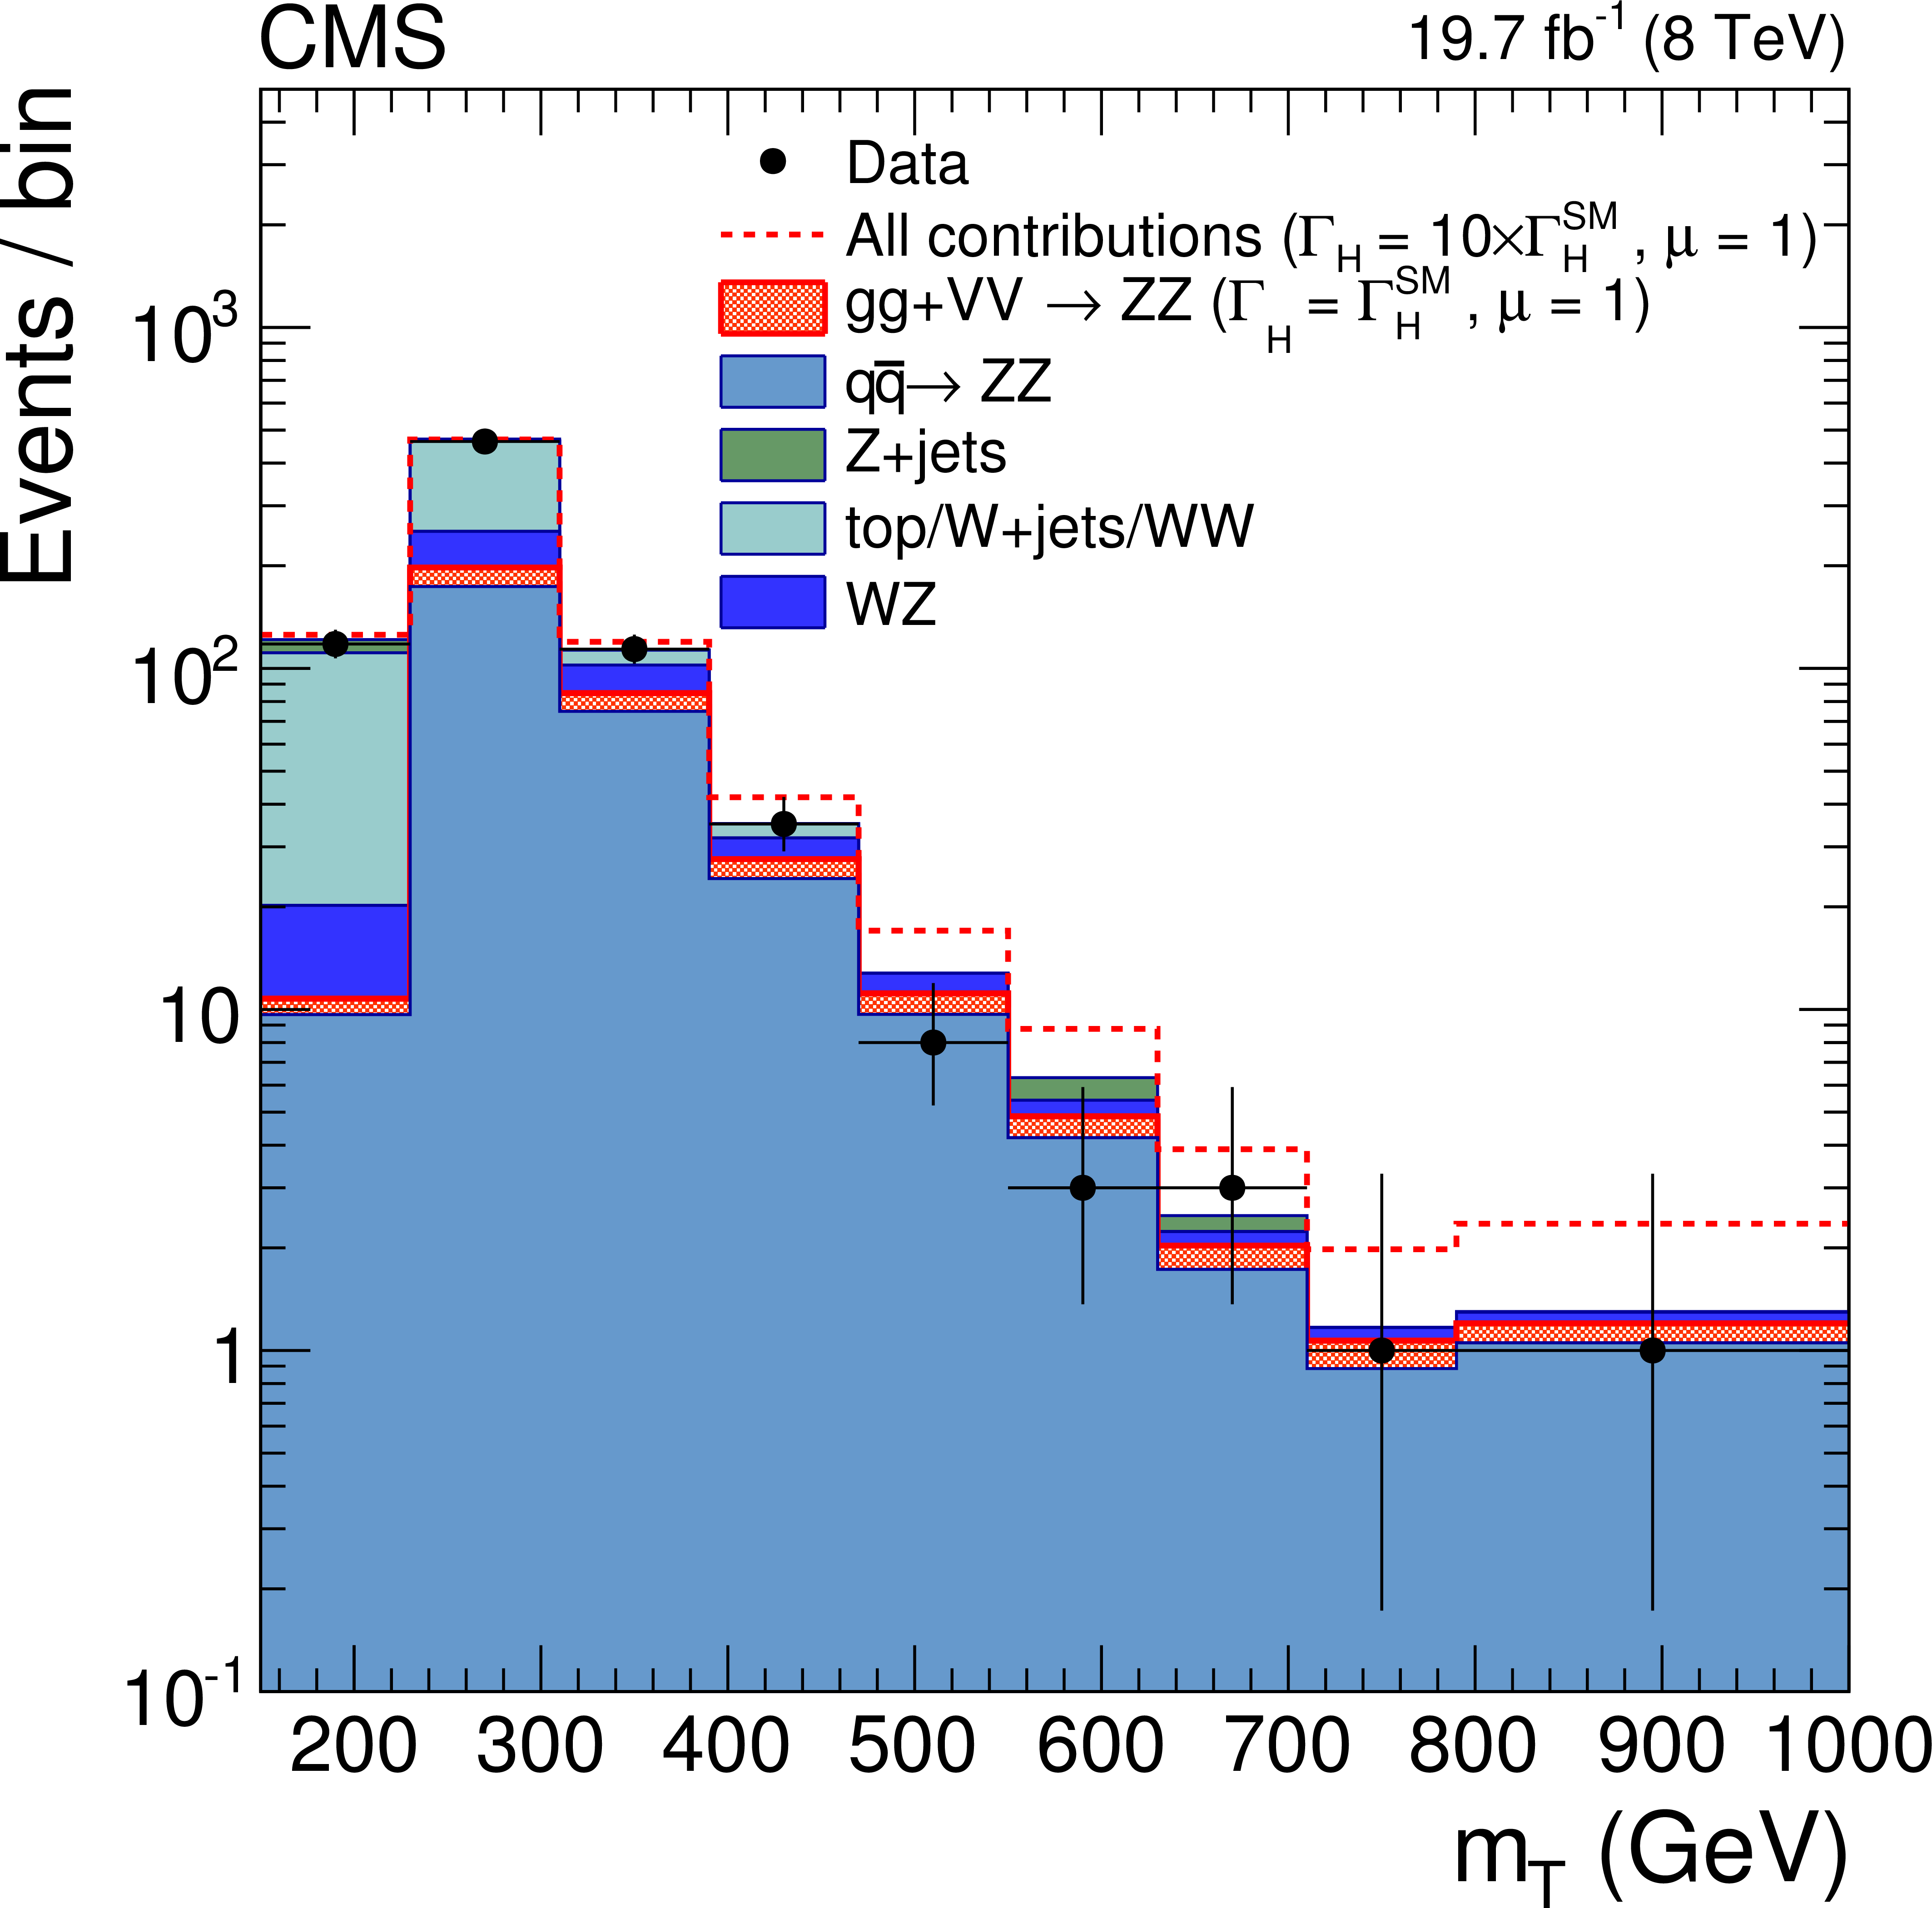
Figure 4:
Distribution of the transverse mass in the $2\ell 2\nu $ channel. Points represent the data, filled histograms the expected contributions from the backgrounds, and from the gluon fusion (gg) and vector boson fusion (VV) SM processes (including the Higgs-mediated contributions). The dashed line corresponds to the total expected yield for a Higgs boson width and a squared product of the couplings scaled by a factor 10 with respect to their SM values. The bin size varies from 80 to 210 GeV and the last bin includes all entries with transverse masses above 1 TeV. |

png pdf |
Figure 5:
Scan of the negative log-likelihood, $-2 \Delta \ln\mathcal {L}$, as a function of $\Gamma _{ {\mathrm {H}} }$ for the combined fit of the $4\ell $ and $2\ell 2\nu $ channels (blue thick lines), for the $4\ell $ channel alone in the off-shell and on-shell regions (dark red lines), and for the $2\ell 2\nu $ channel in the off-shell region and $4\ell $ channel in the on-shell region (light red lines). The solid lines represent the observed values, the dotted lines the expected values. |
|
|
Compact Muon Solenoid LHC, CERN |
|

|

|

|

|

|