

Compact Muon Solenoid
LHC, CERN
| CMS-HIG-14-006 ; CERN-PH-EP-2015-113 | ||
| Search for diphoton resonances in the mass range from 150 to 850 GeV in pp collisions at $\sqrt{s} = $ 8 TeV | ||
| CMS Collaboration | ||
| 7 June 2015 | ||
| Phys. Lett. B 750 (2015) 494 | ||
| Abstract: Results are presented of a search for heavy particles decaying into two photons. The analysis is based on a 19.7 fb$^{-1}$ sample of proton-proton collisions at $\sqrt{s }= $ 8 TeV collected with the CMS detector at the CERN LHC. The diphoton mass spectrum from 150 to 850 GeV is used to search for an excess of events over the background. The search is extended to new resonances with natural widths of up to 10% of the mass value. No evidence for new particle production is observed and limits at 95% confidence level on the production cross section times branching fraction to diphotons are determined. These limits are interpreted in terms of two-Higgs-doublet model parameters. | ||
| Links: e-print arXiv:1506.02301 [hep-ex] (PDF) ; CDS record ; inSPIRE record ; CADI line (restricted) ; | ||
| Figures | |
png pdf |
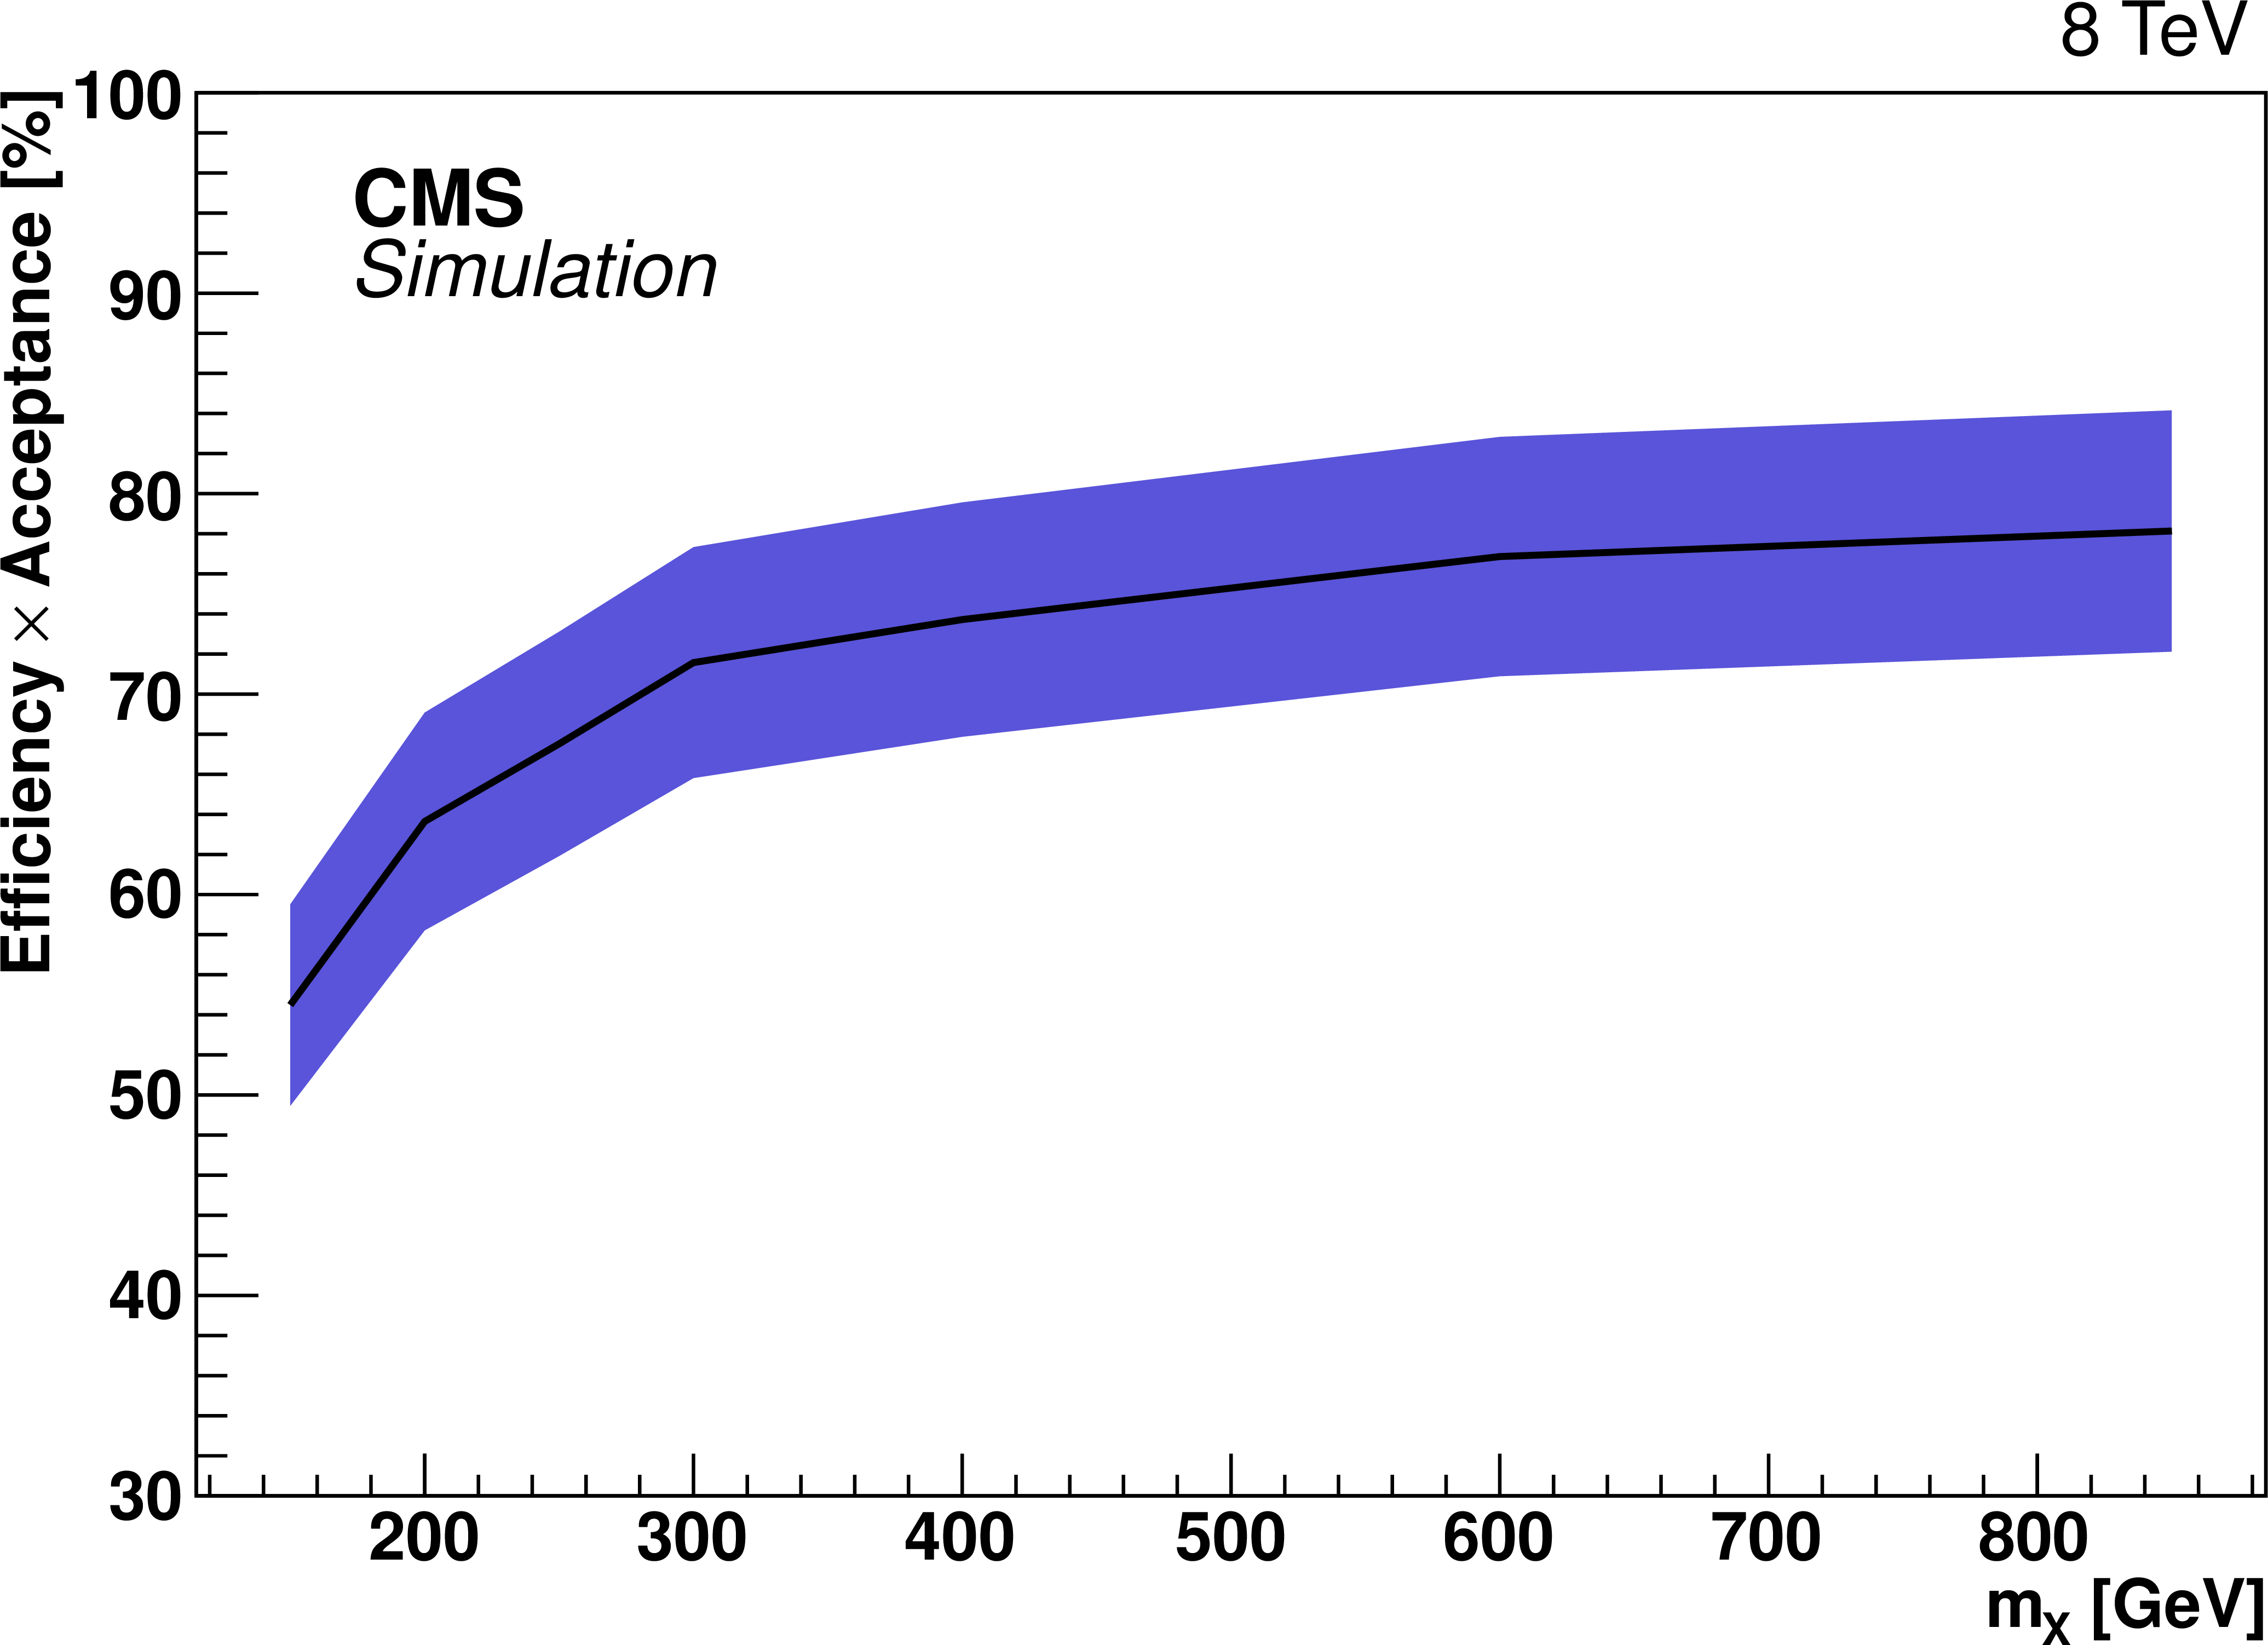
Figure 1:
Signal efficiency times acceptance as a function of the mass for a spin-0 scalar resonance, produced via gluon-gluon fusion, with natural width equal to 0.1 GeV. The shaded region indicates the systematic uncertainty. |
png pdf |
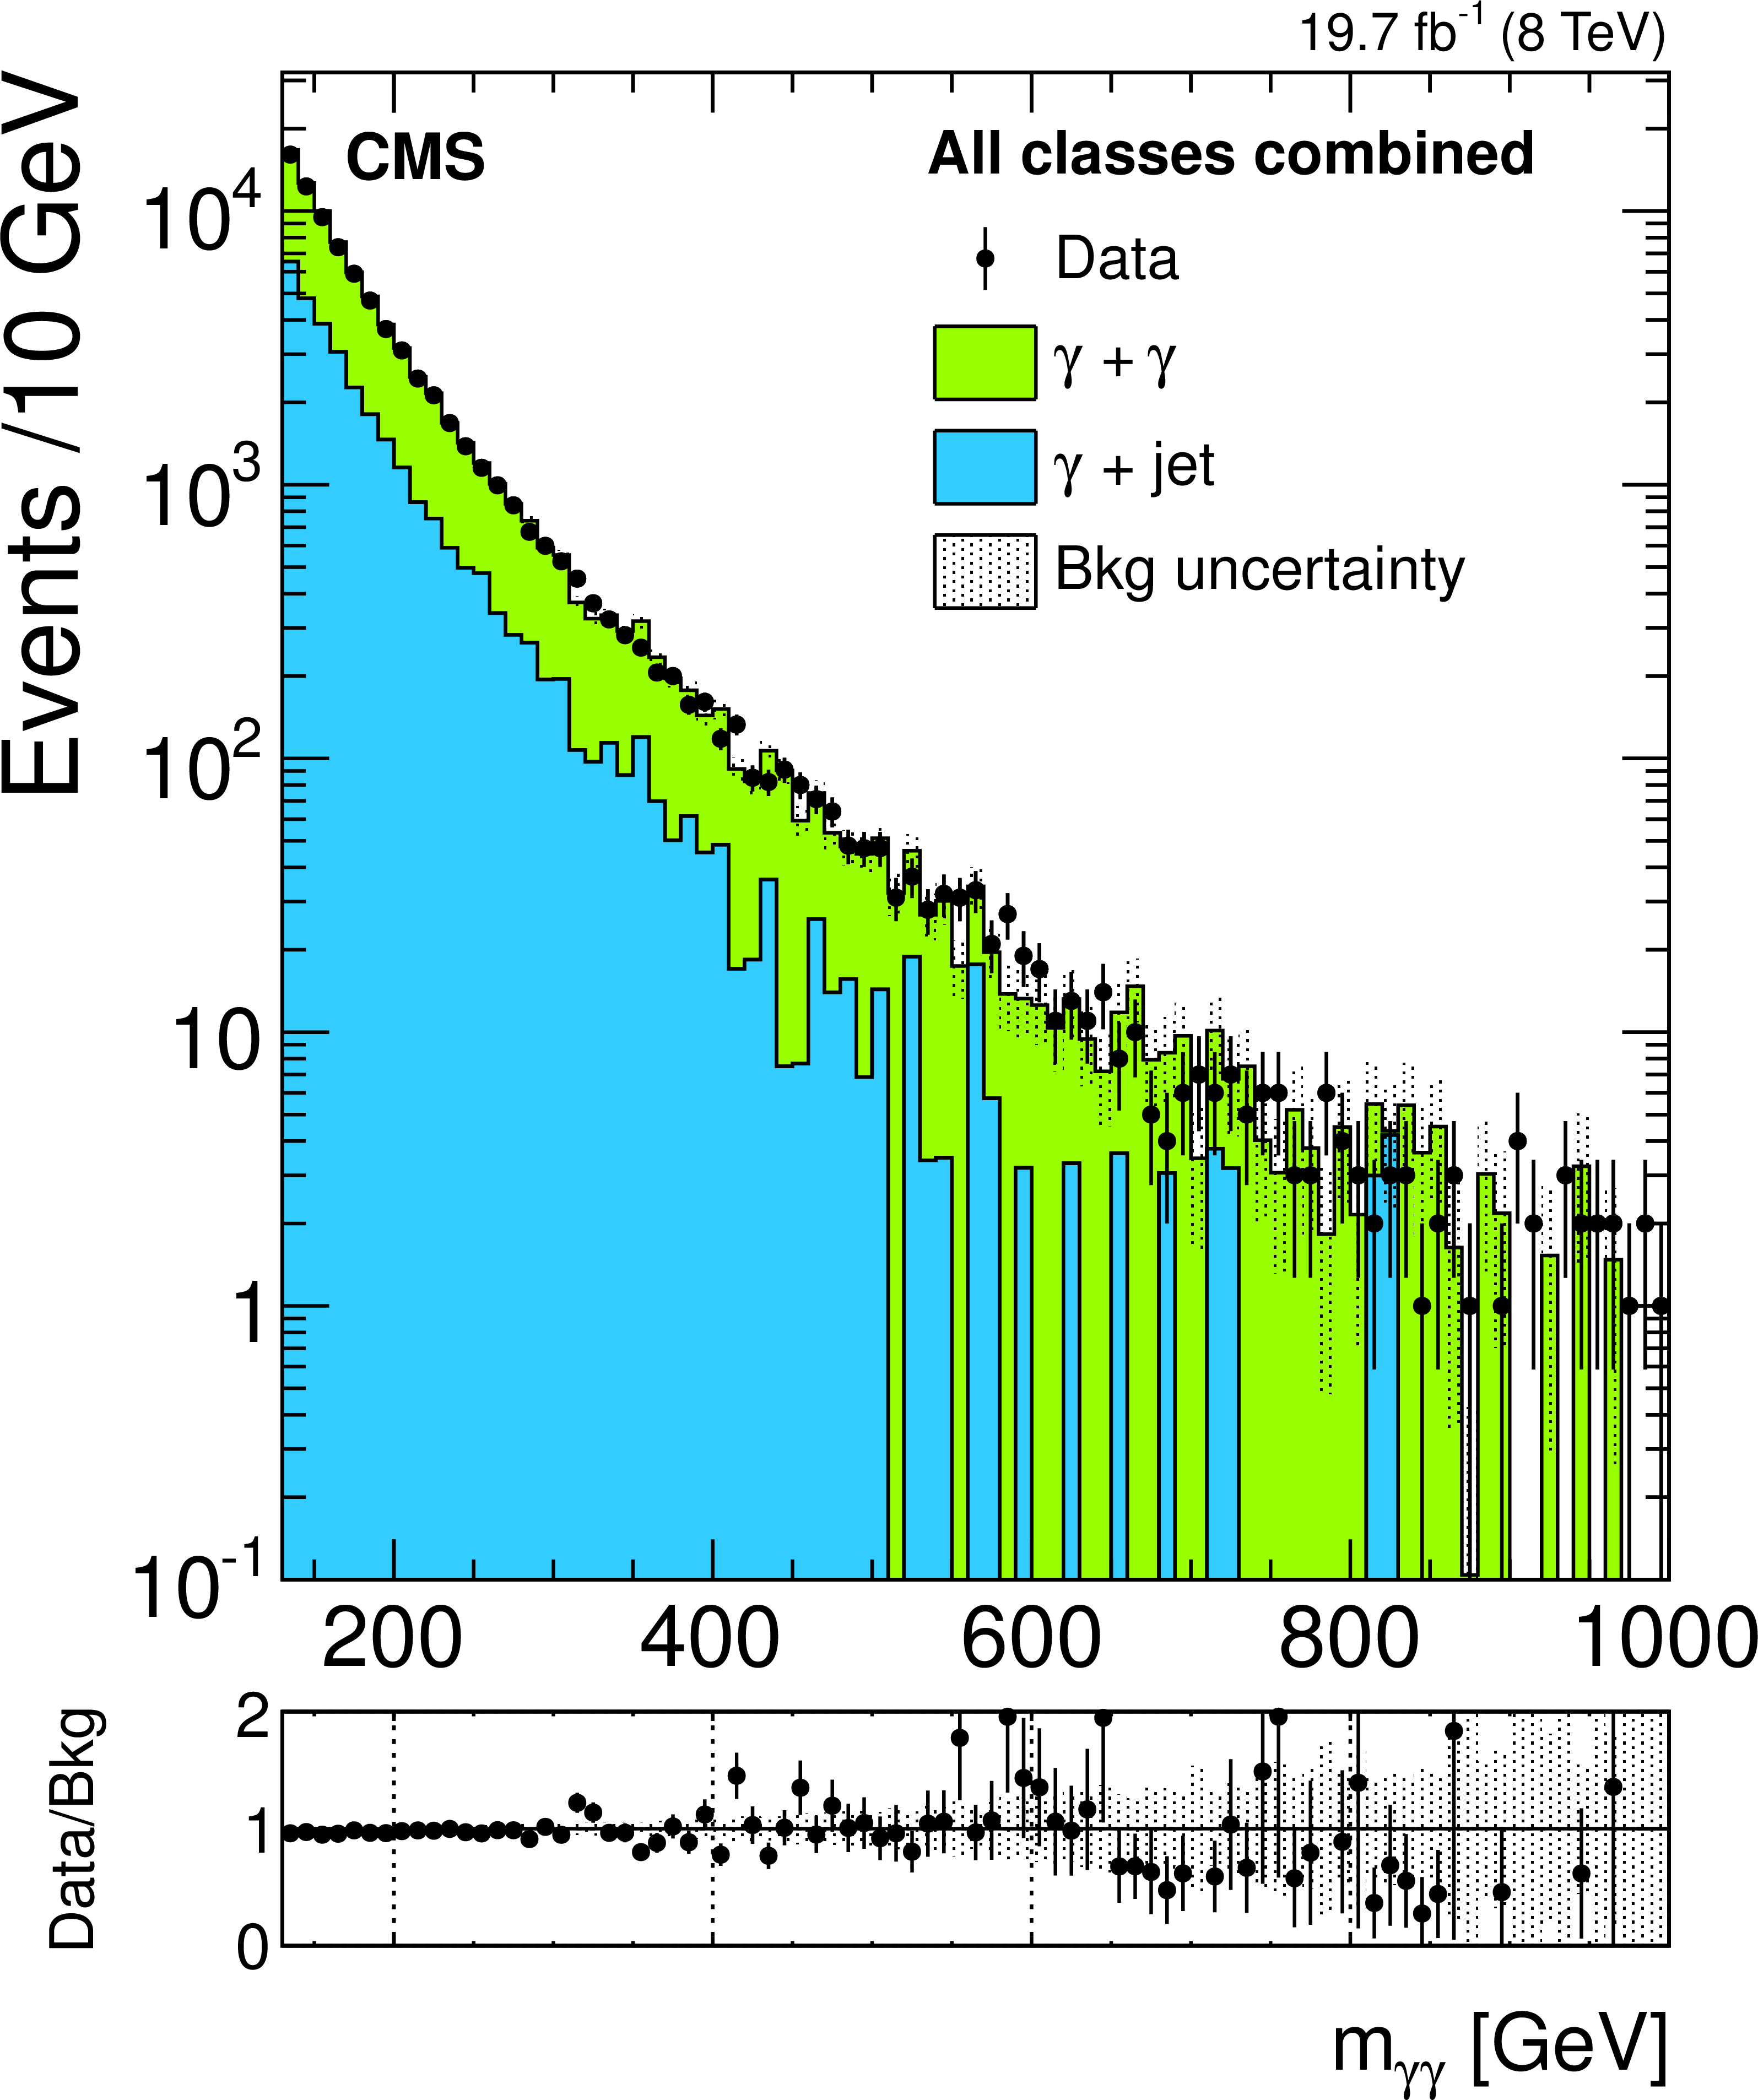
Figure 2:
Diphoton invariant mass distribution for the selected events in data and simulation. Background processes are represented by the filled histograms. The shaded band represents the Poisson uncertainty in the MC prediction. The prompt diphoton events and the photon plus jets events are shown separately. The ratio between data and MC is displayed bin by bin in the bottom plot. |
png pdf |
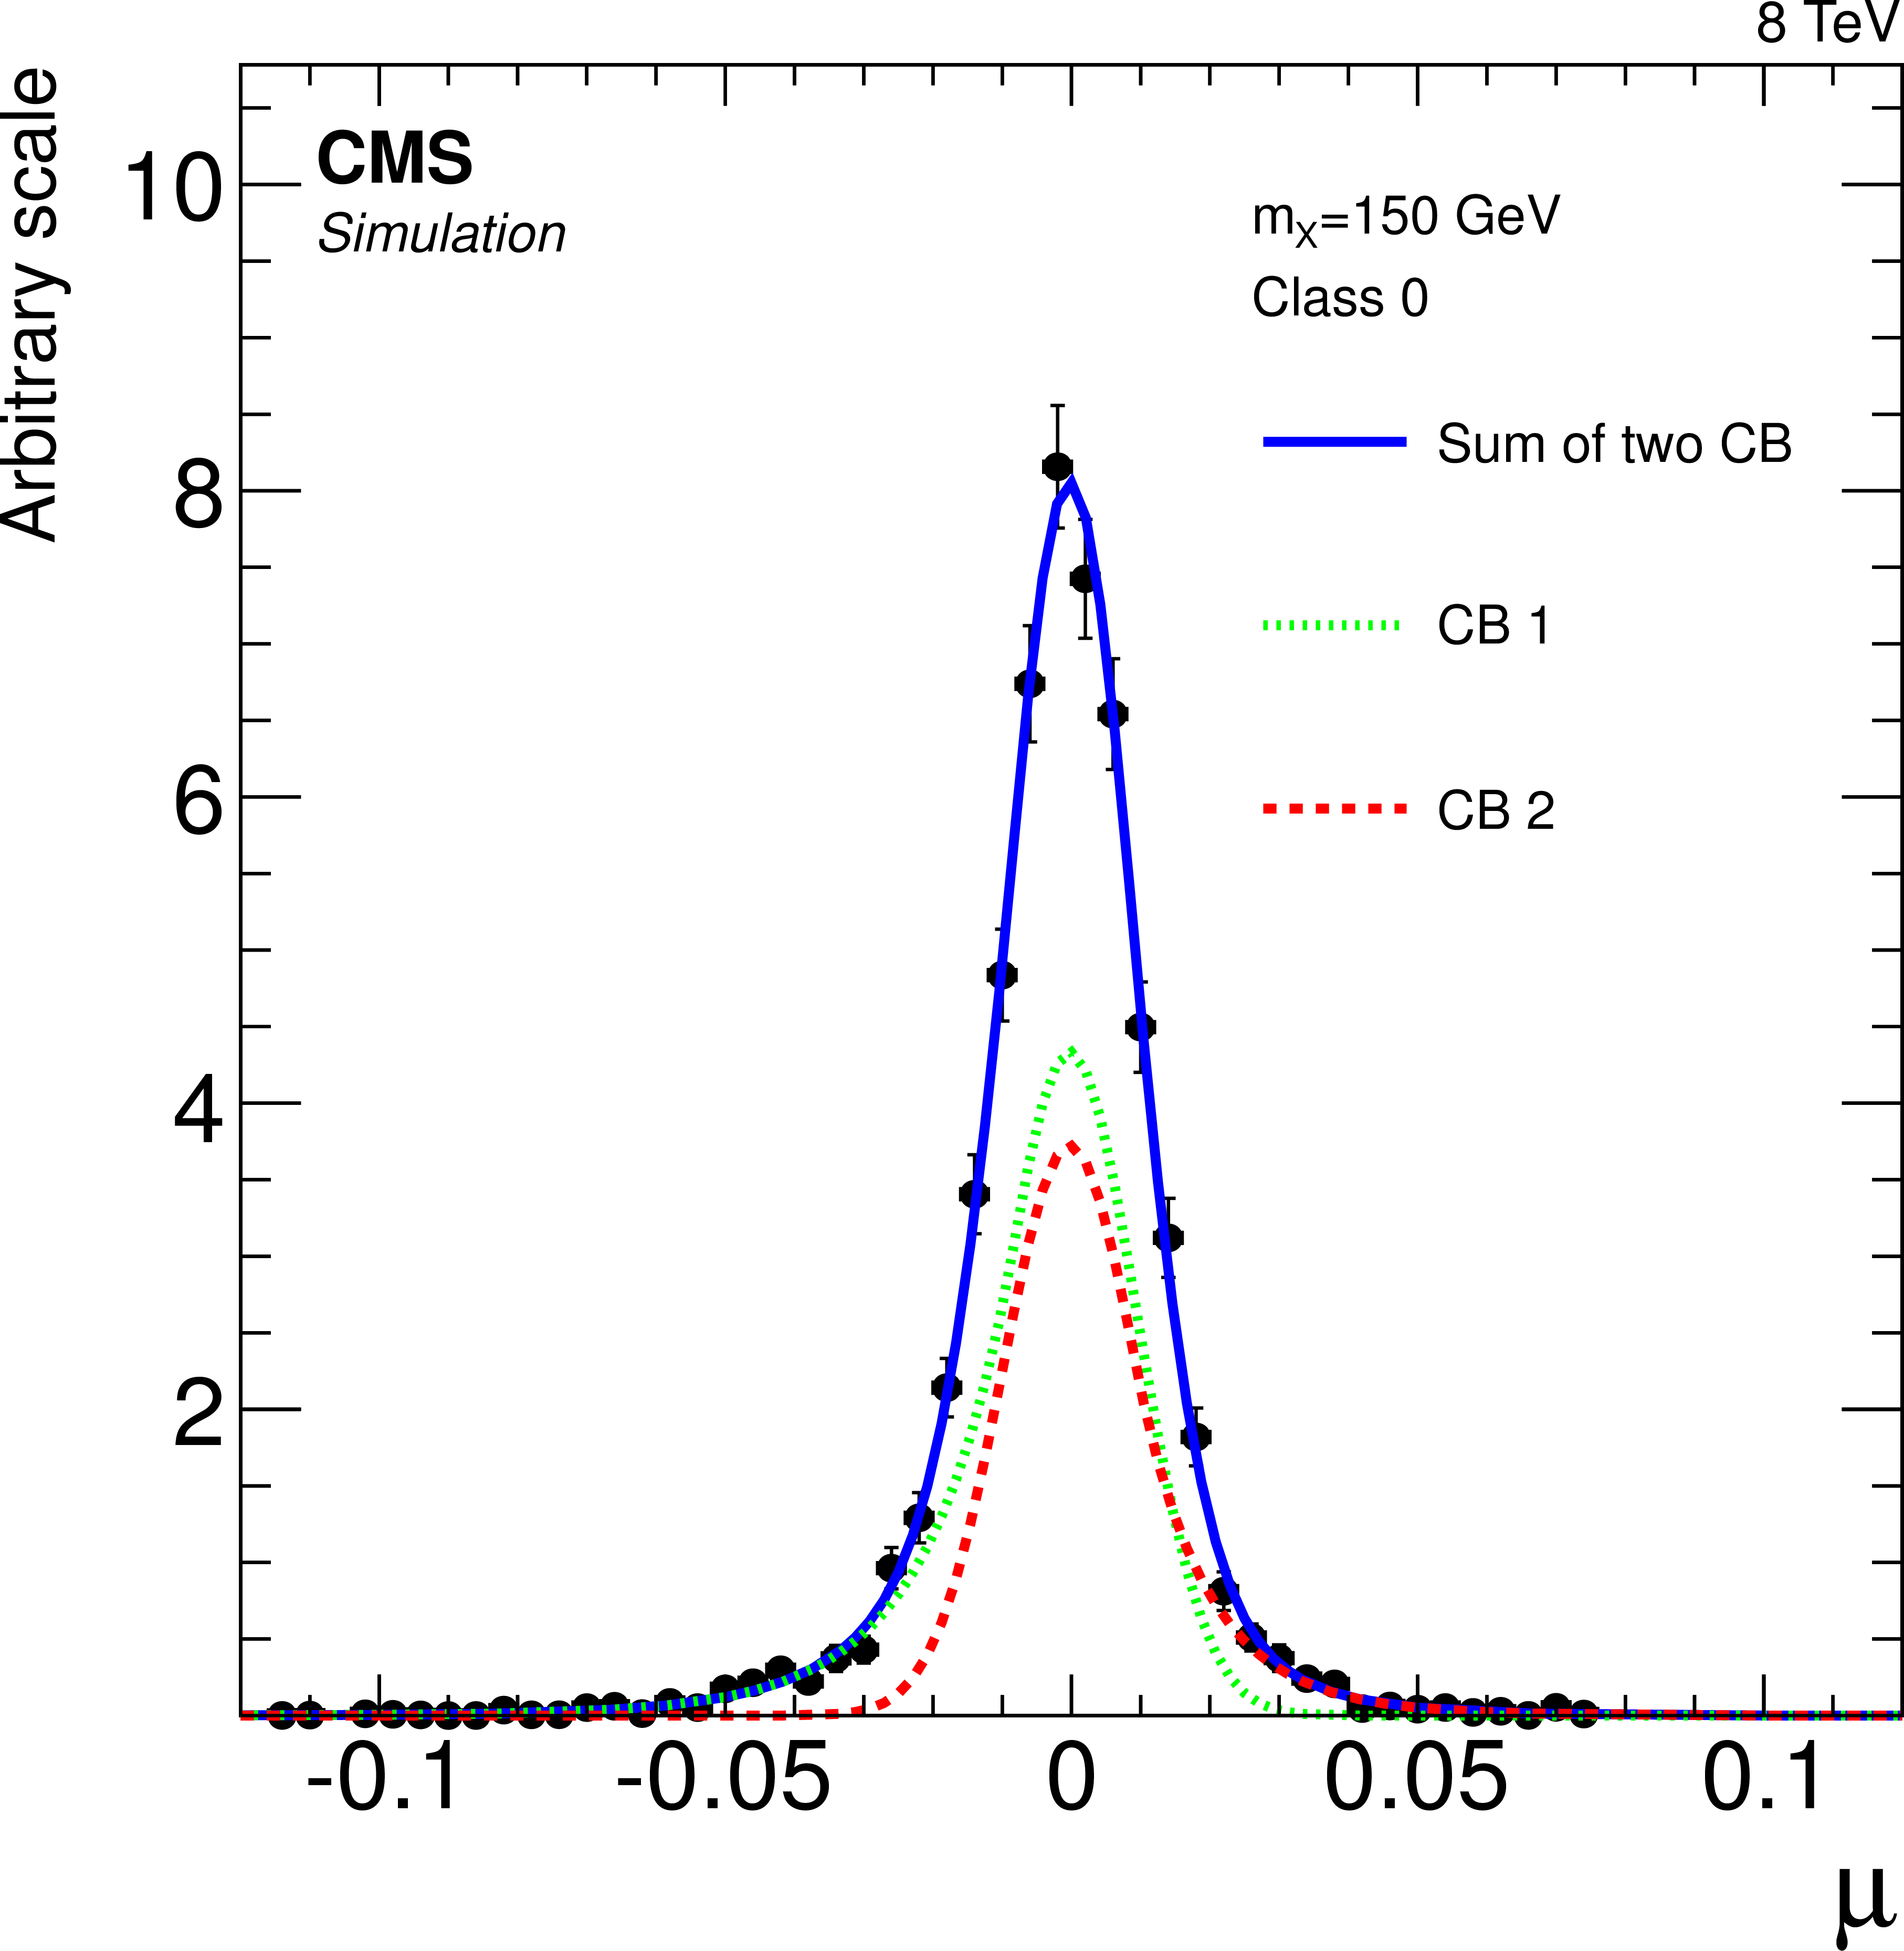
Figure 3-a:
Fit to the detector response distribution for $m_ {\mathrm {X}} =$ 150 GeV with two single-sided Crystal Ball functions (solid curve), displayed with linear (a) and logarithmic (b) scales. The dashed and dotted curves show the individual Crystal Ball components. |
png pdf |
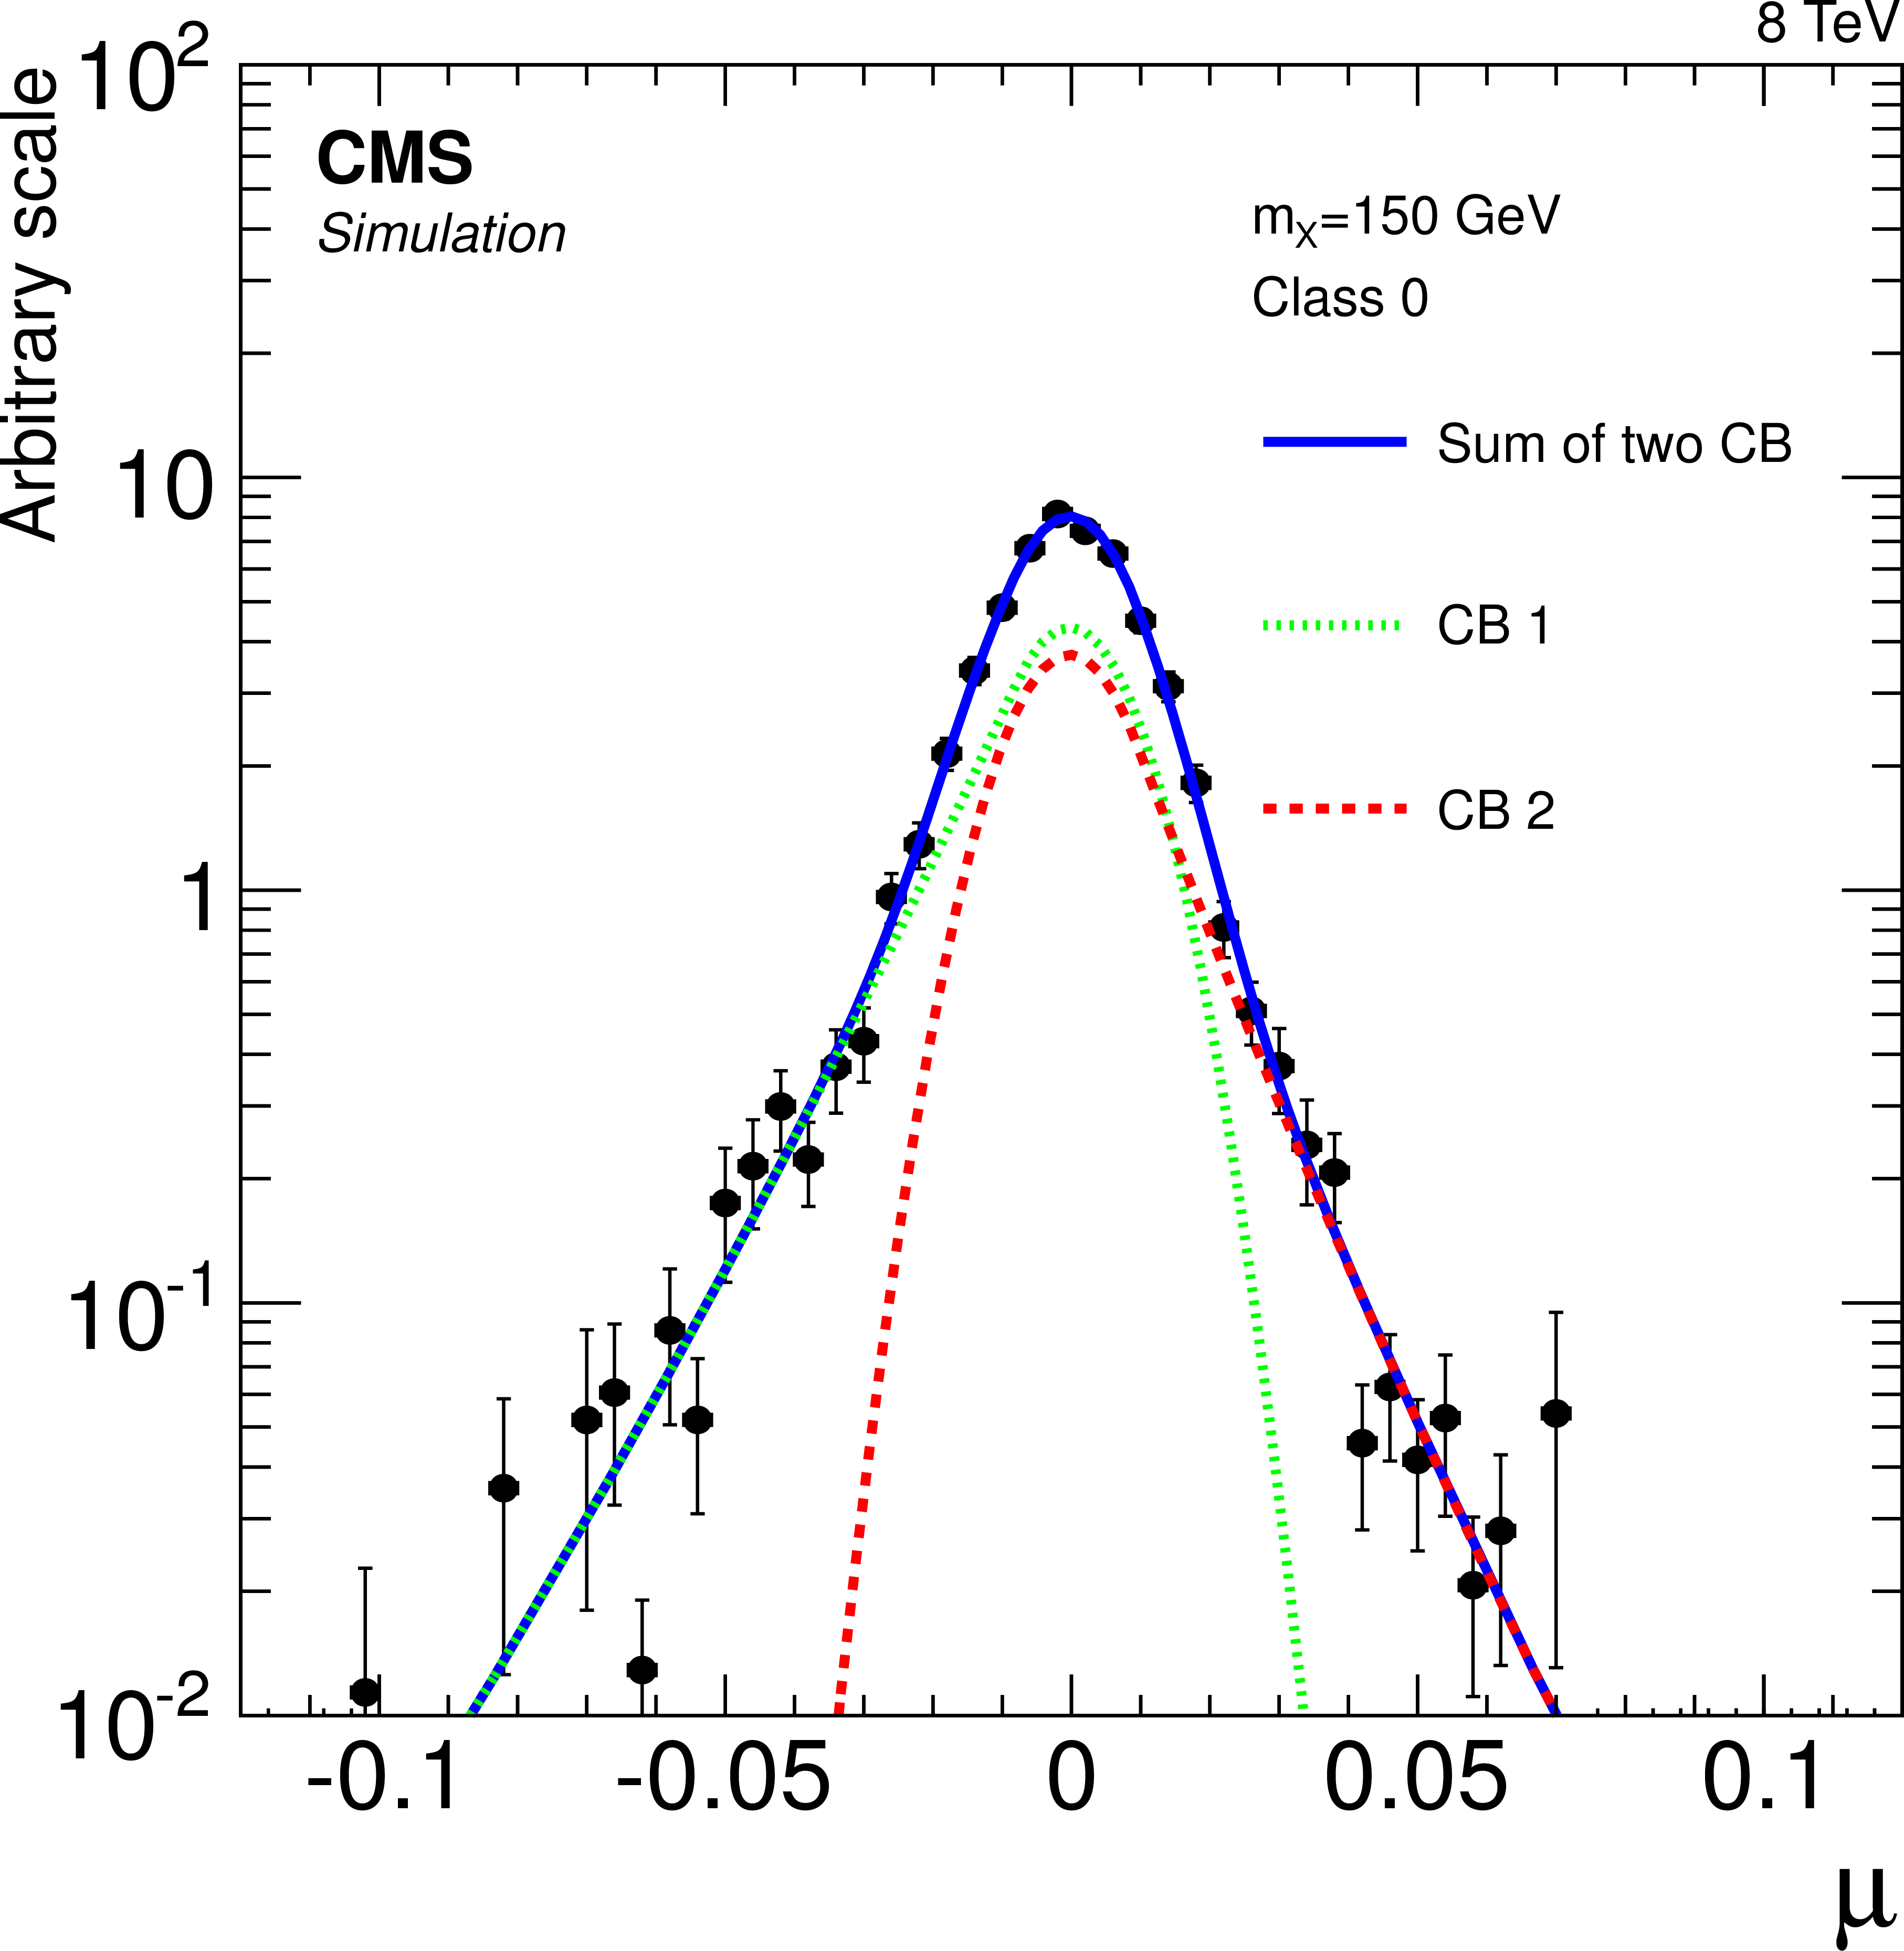
Figure 3-b:
Fit to the detector response distribution for $m_ {\mathrm {X}} =$ 150 GeV with two single-sided Crystal Ball functions (solid curve), displayed with linear (a) and logarithmic (b) scales. The dashed and dotted curves show the individual Crystal Ball components. |

png pdf |
Figure 4-a:
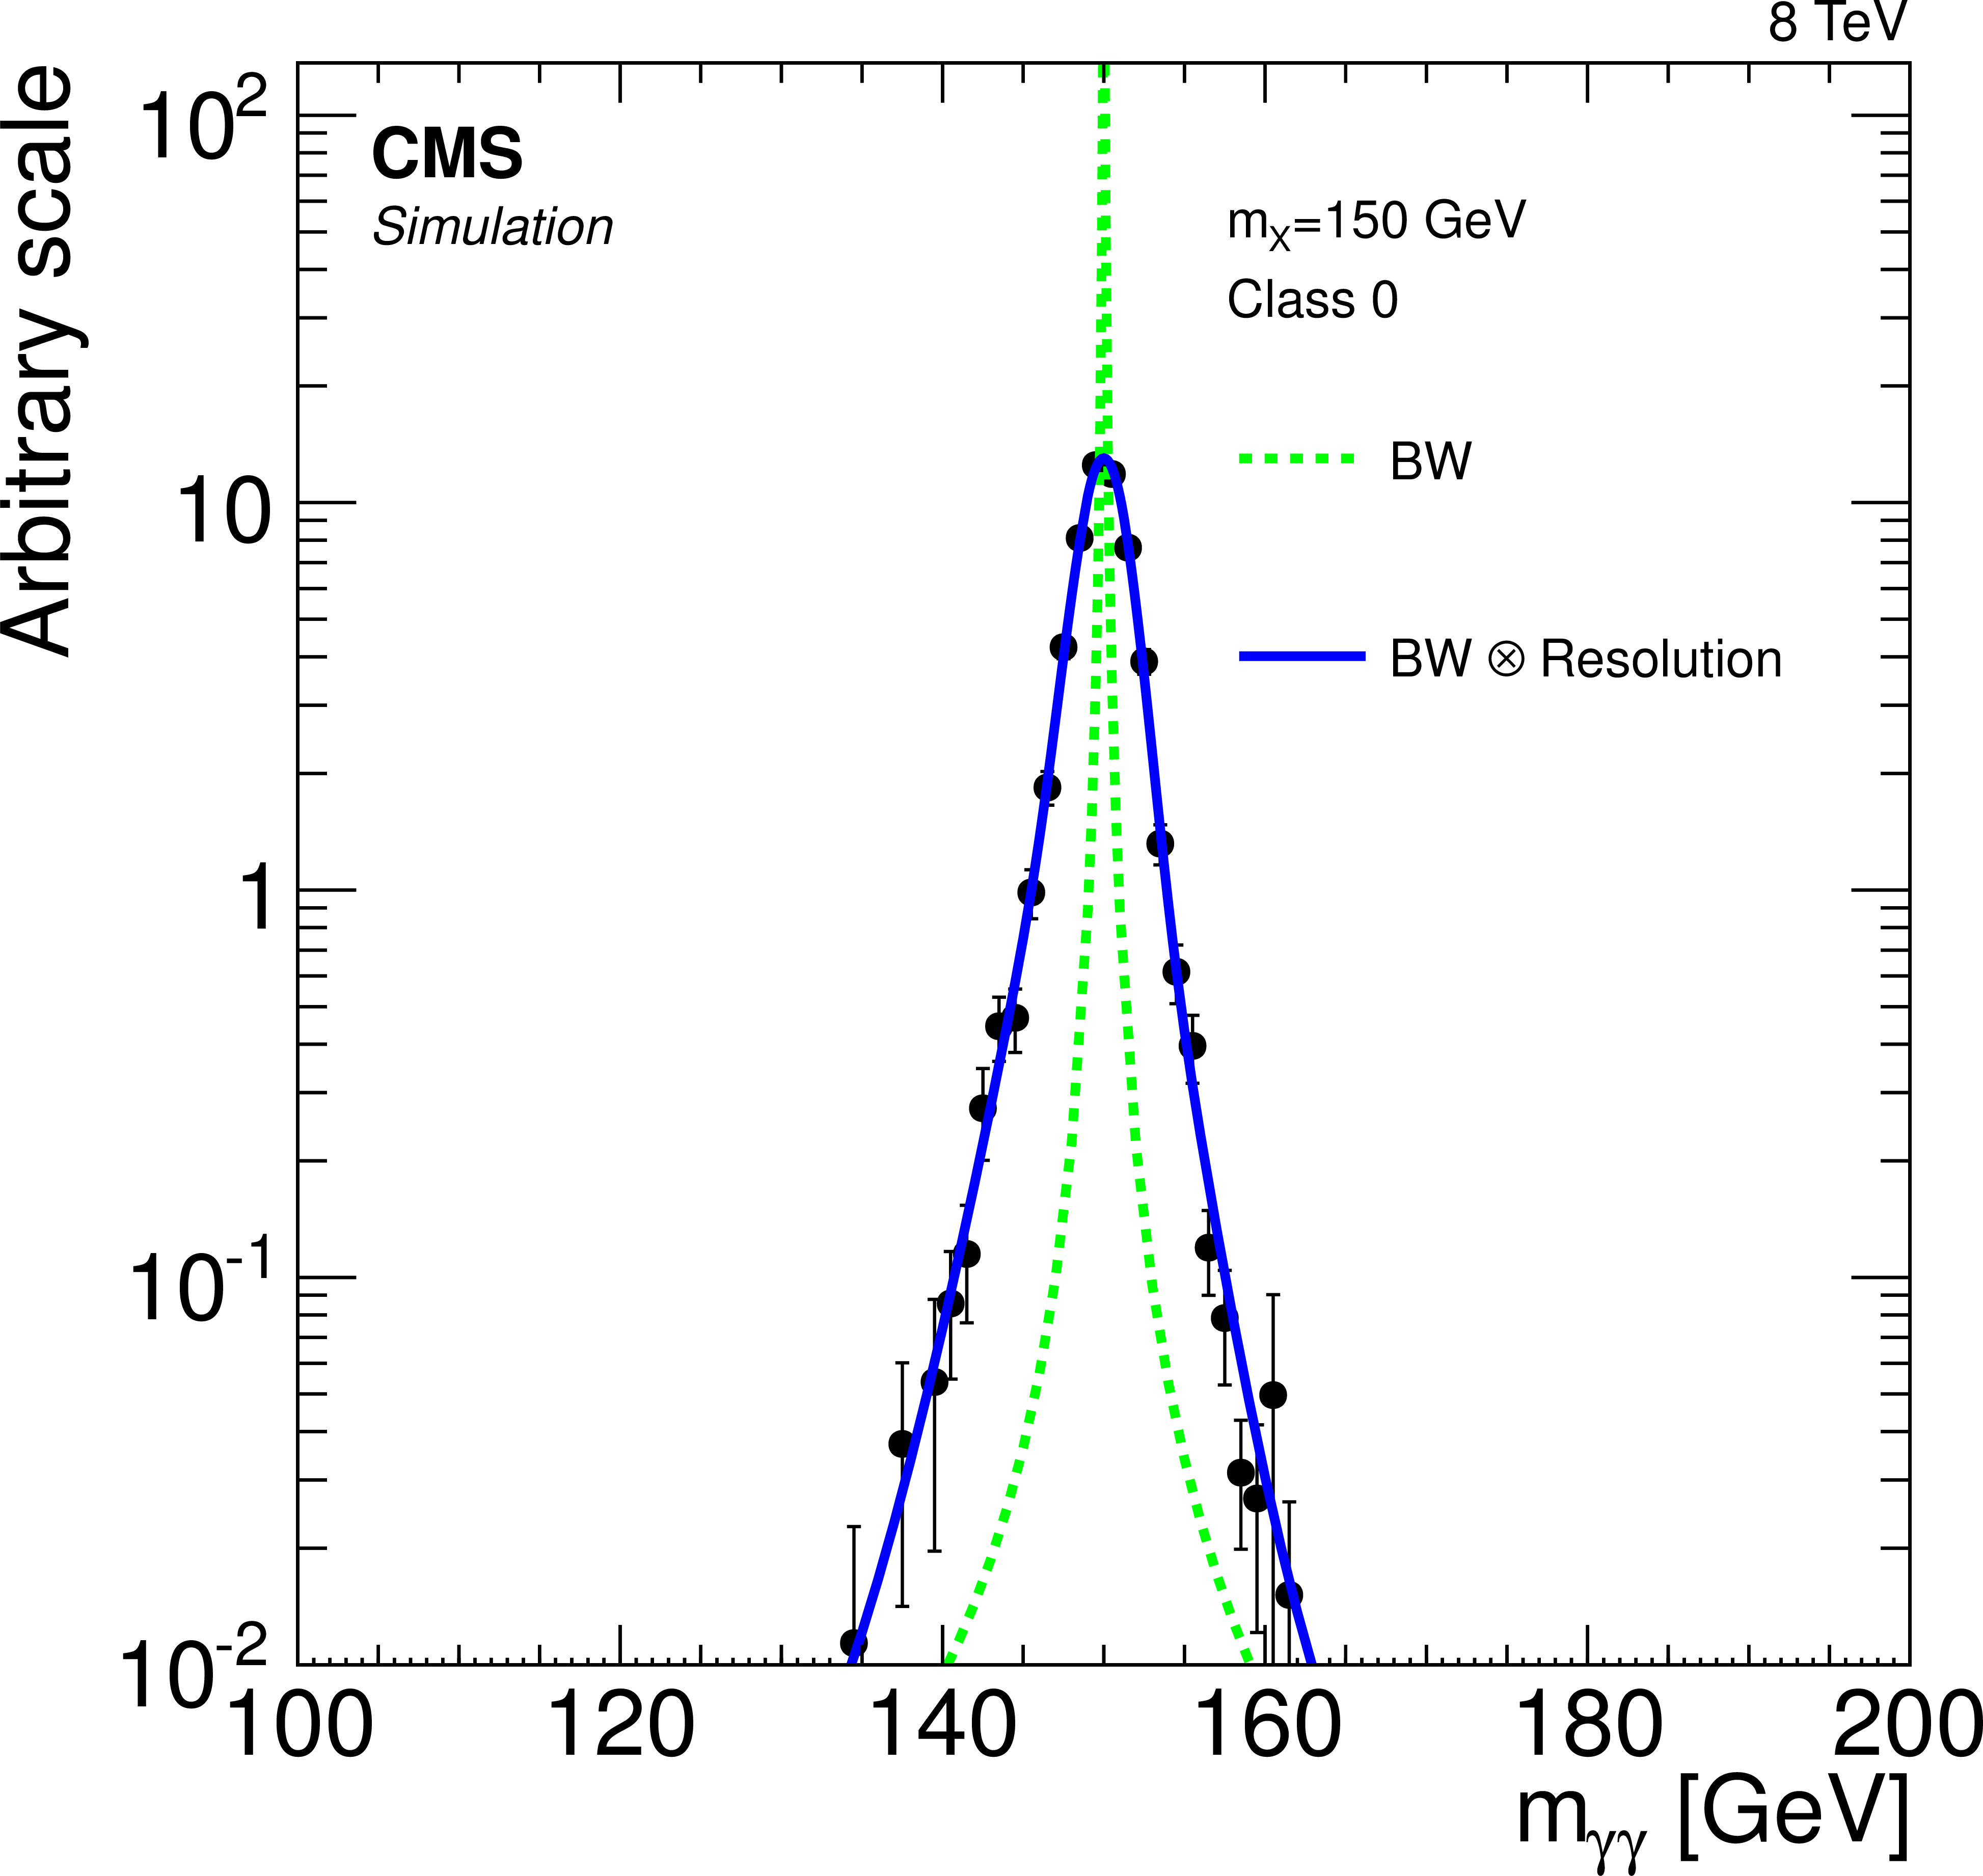
Parametrized signal shape for a signal with $m_ {\mathrm {X}} =$ 150 GeV and $\Gamma _{\mathrm {X}} =$ 0.1 GeV, displayed with linear (a) and logarithmic (b) scales. The solid curve shows the result of a fit to the simulated events (points with error bars); the dashed curve represents the Breit--Wigner component of the model. |
png pdf |
Figure 4-b:
Parametrized signal shape for a signal with $m_ {\mathrm {X}} =$ 150 GeV and $\Gamma _{\mathrm {X}} =$ 0.1 GeV, displayed with linear (a) and logarithmic (b) scales. The solid curve shows the result of a fit to the simulated events (points with error bars); the dashed curve represents the Breit--Wigner component of the model. |
png pdf |
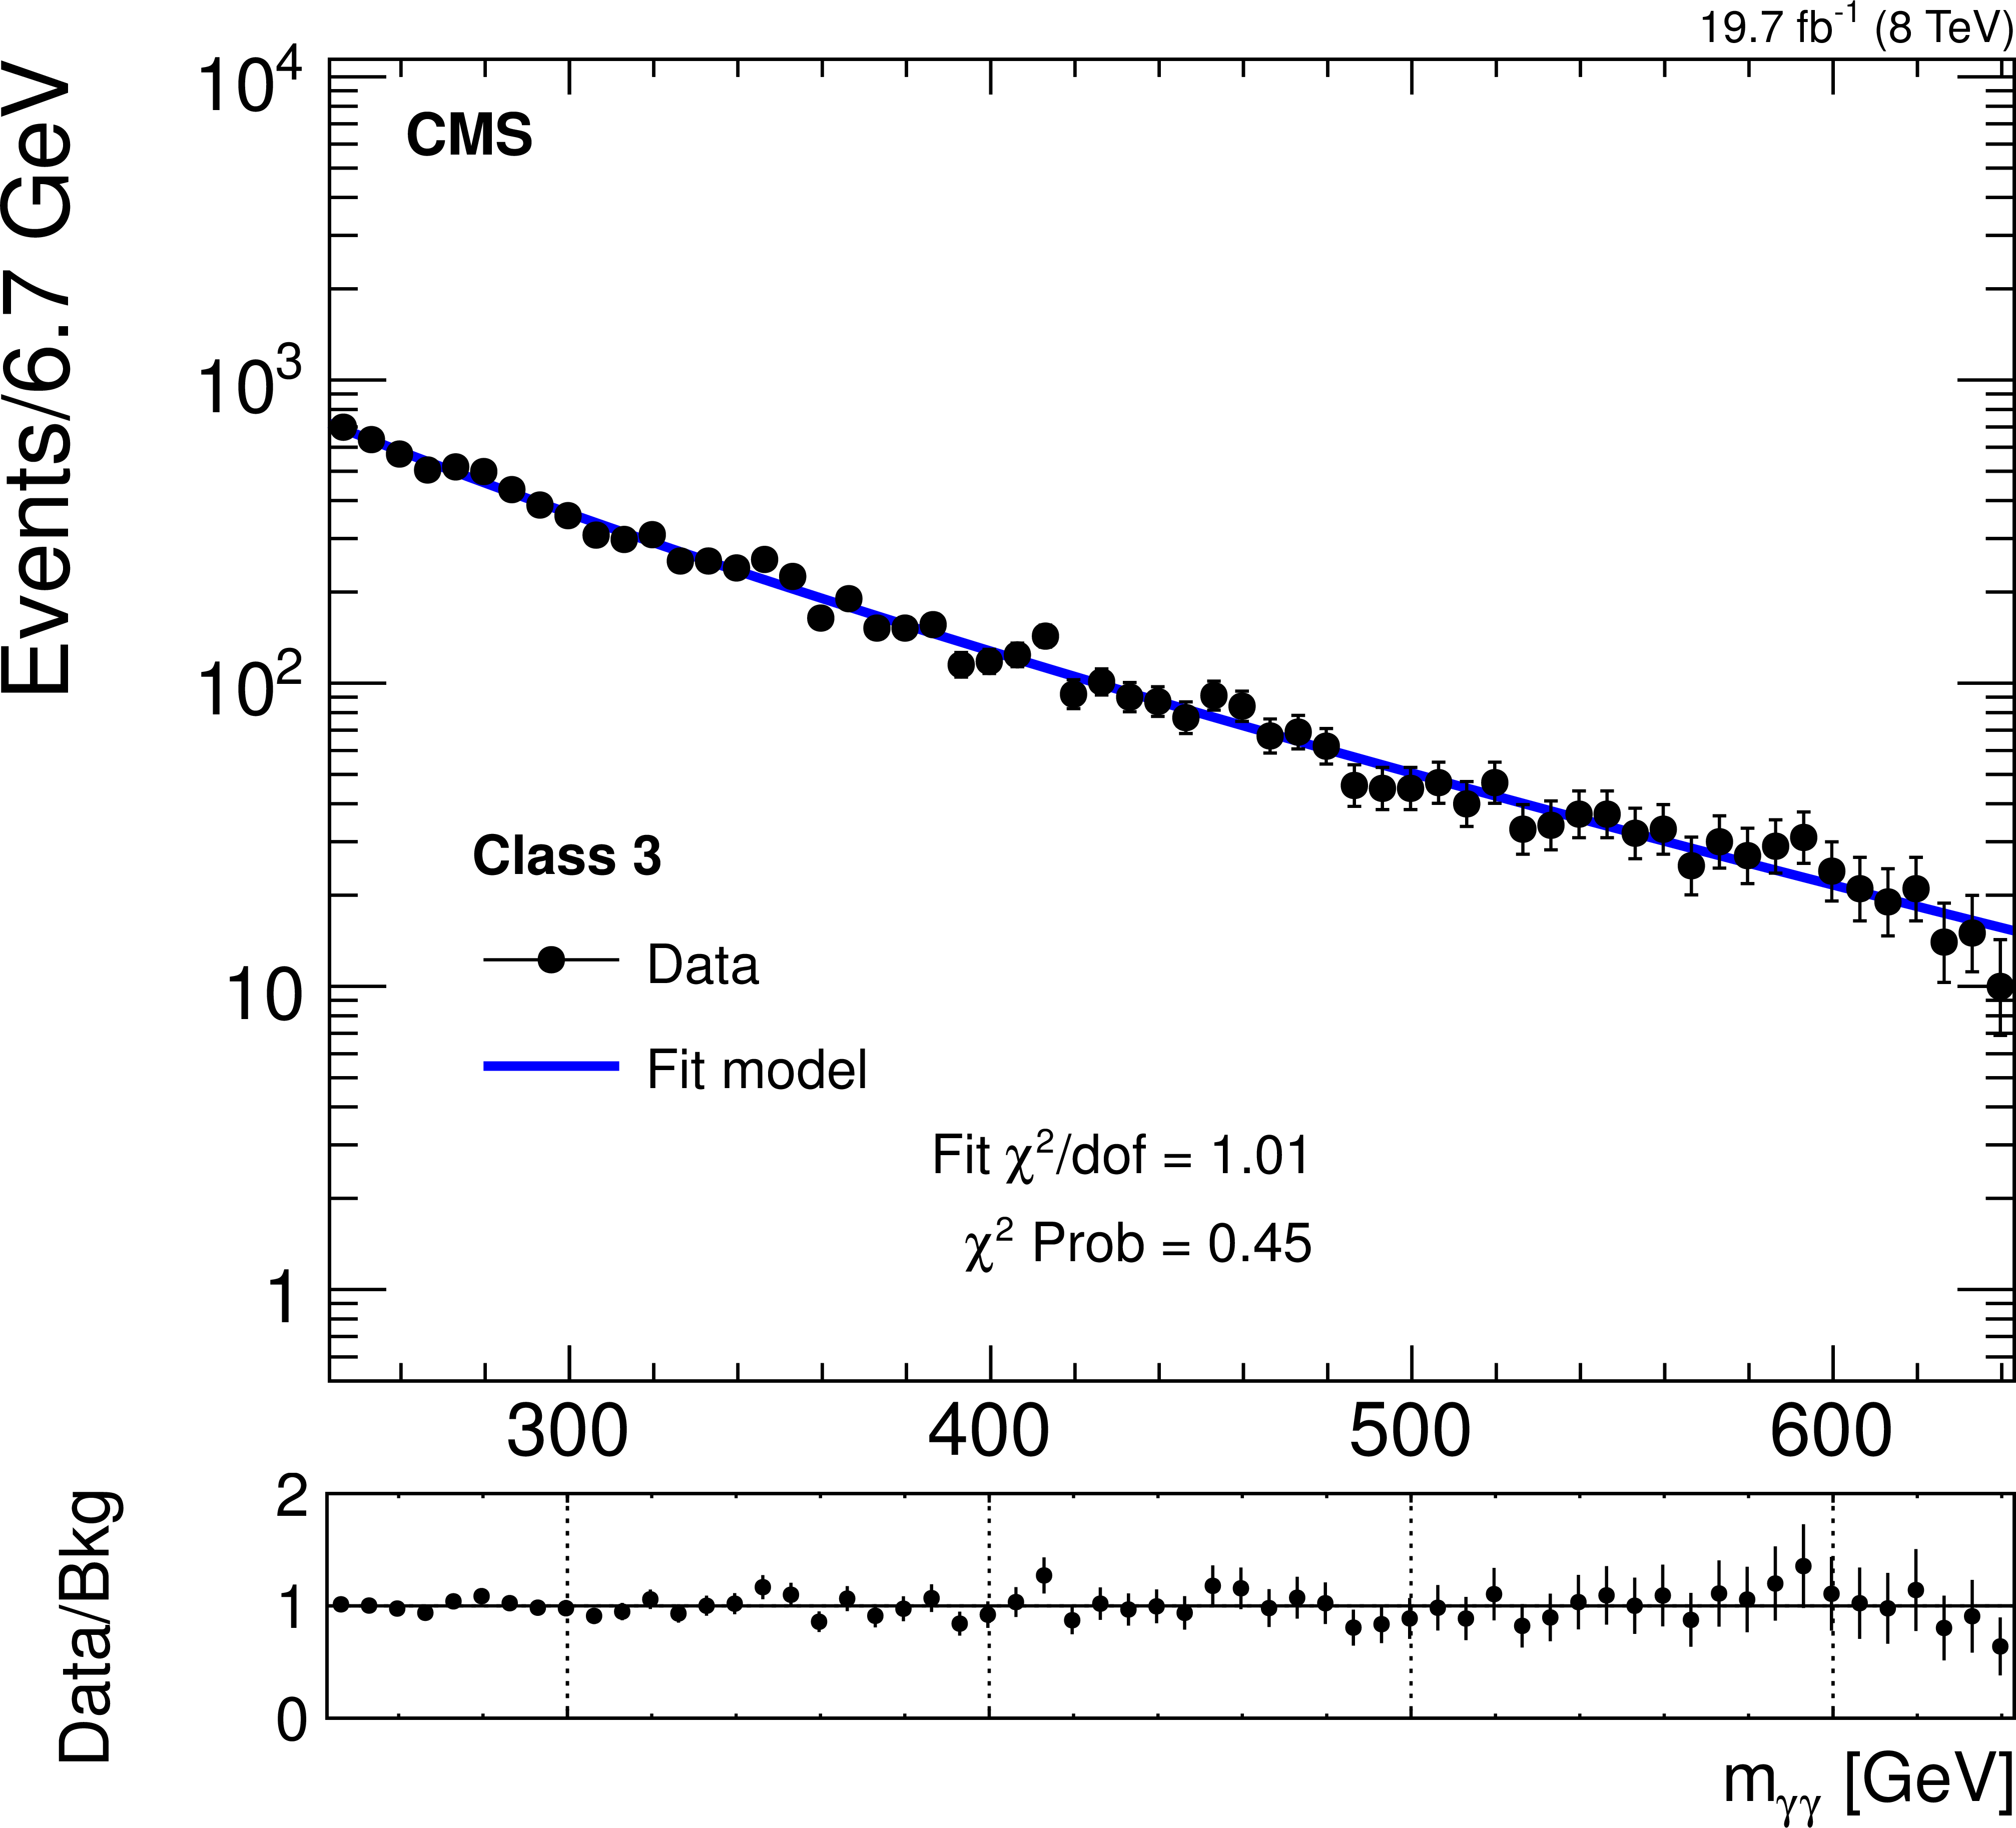
Figure 5-a:
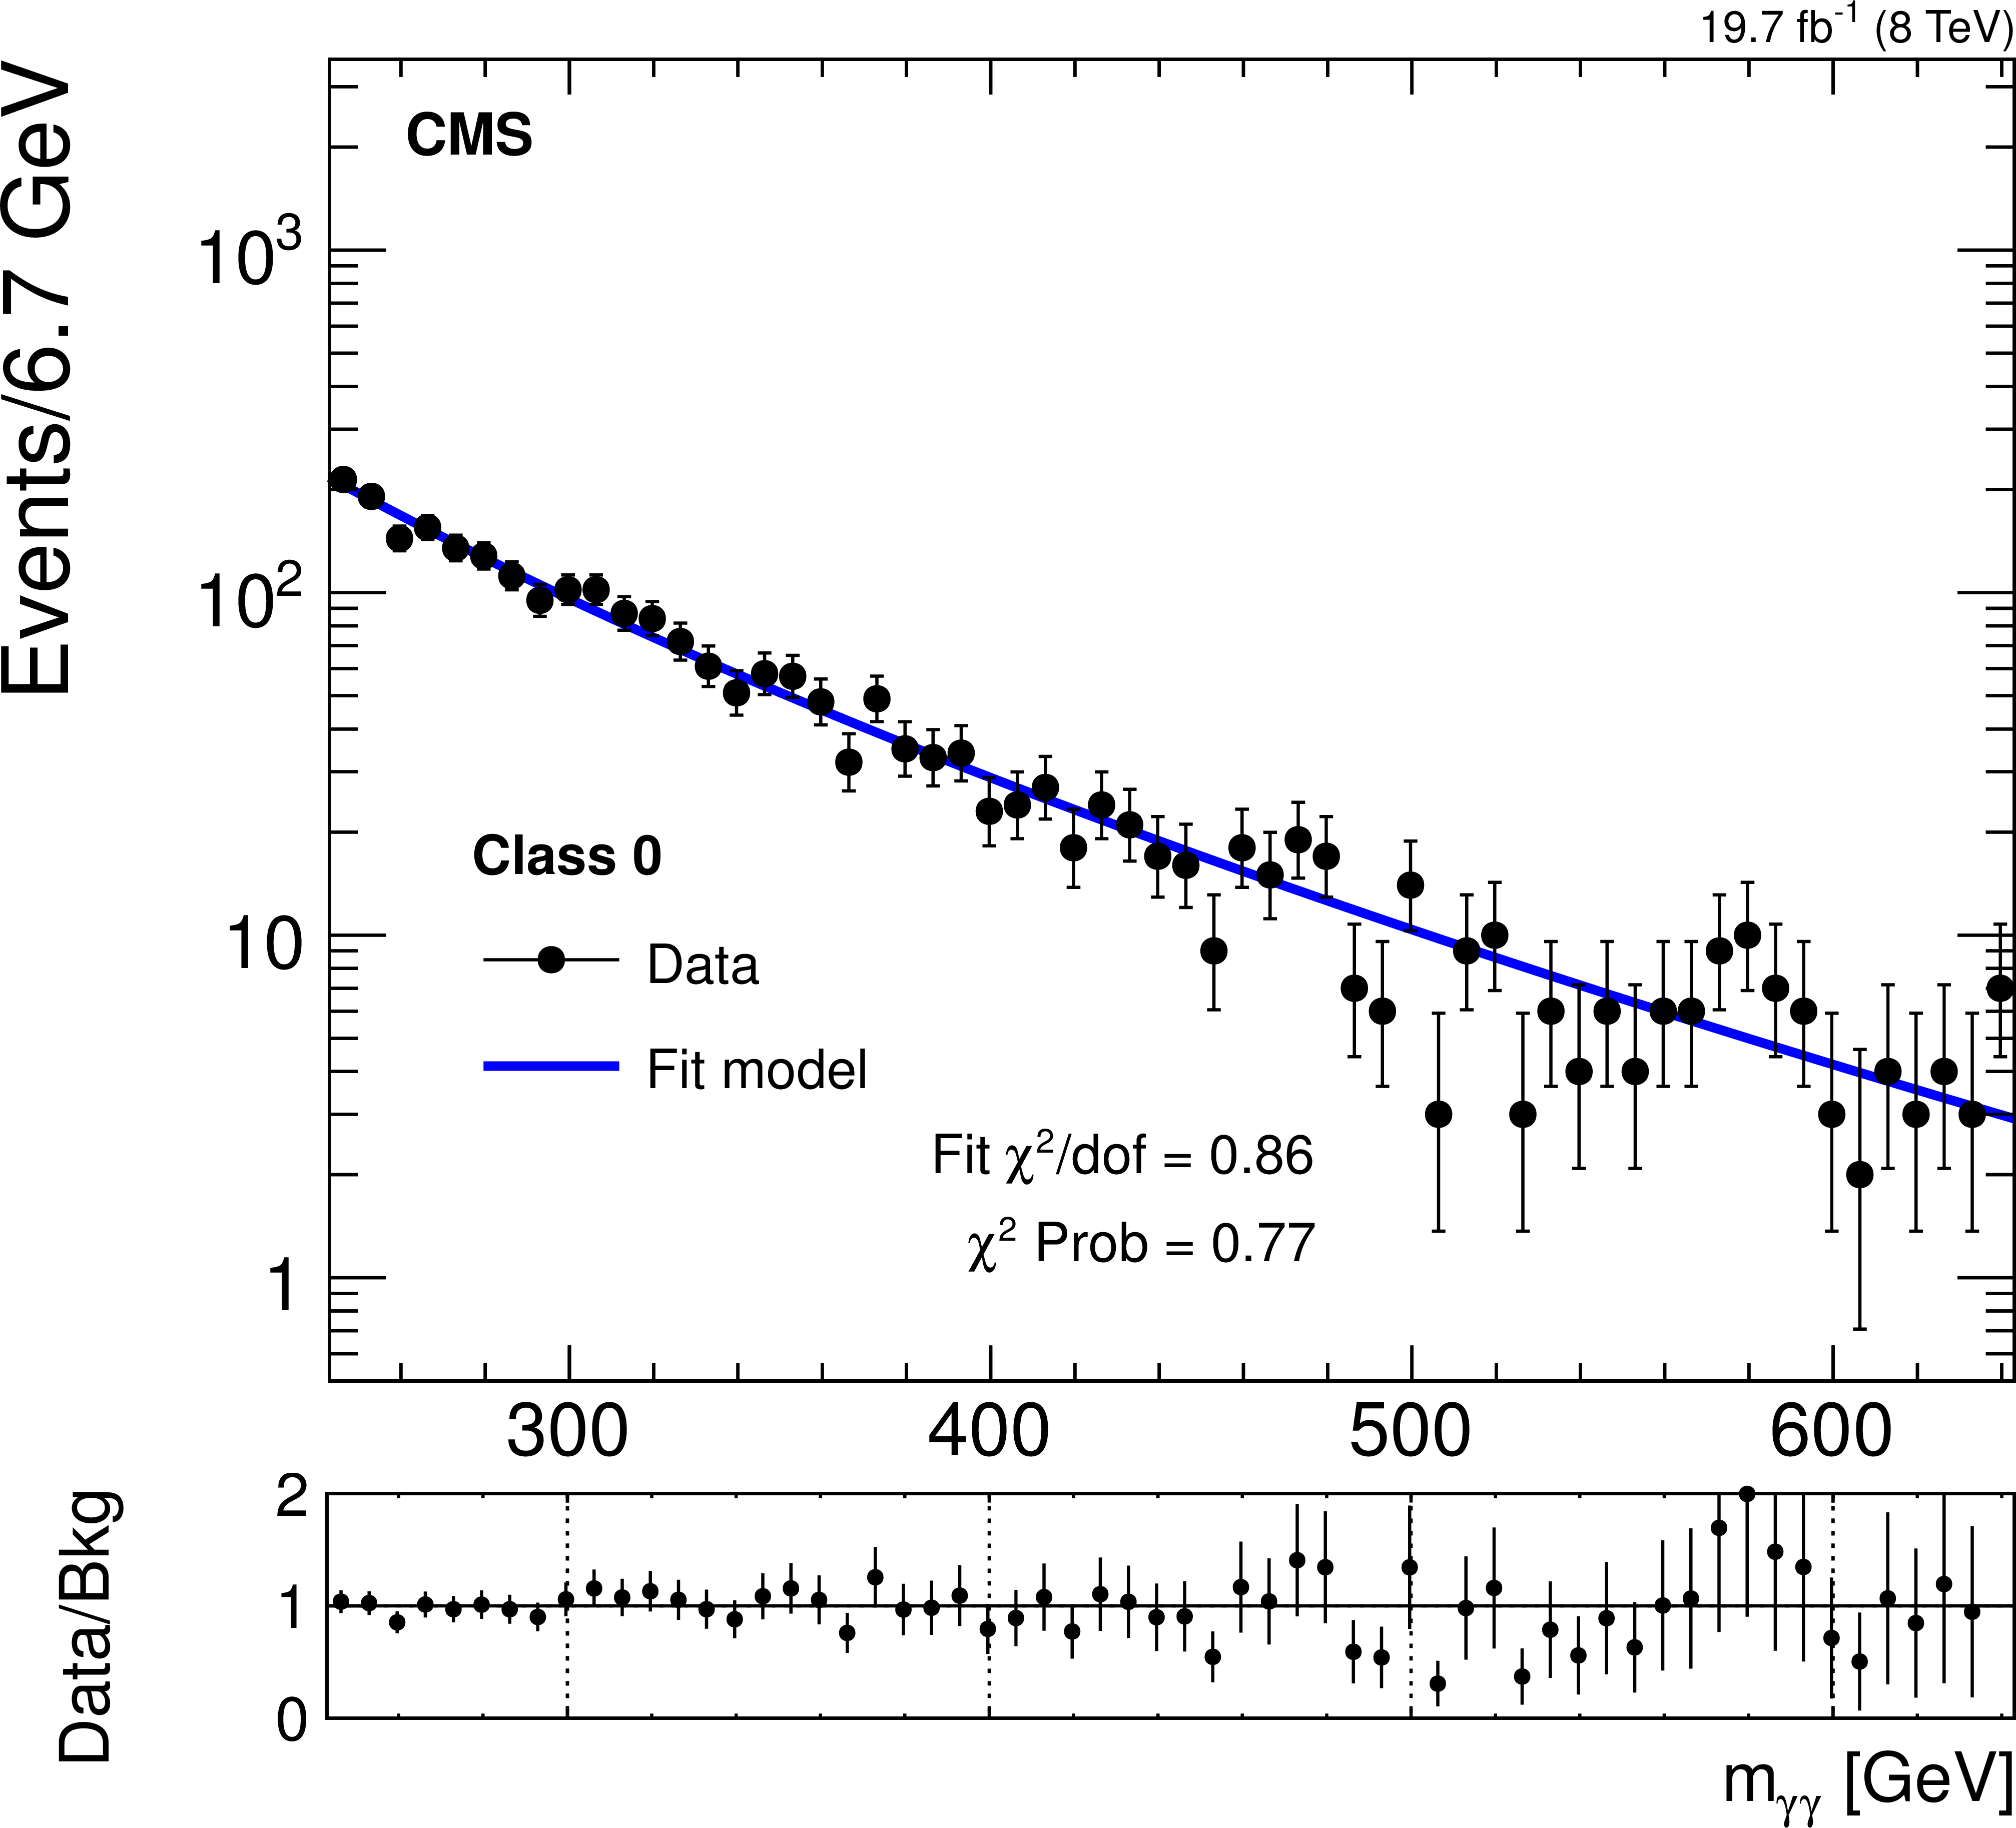
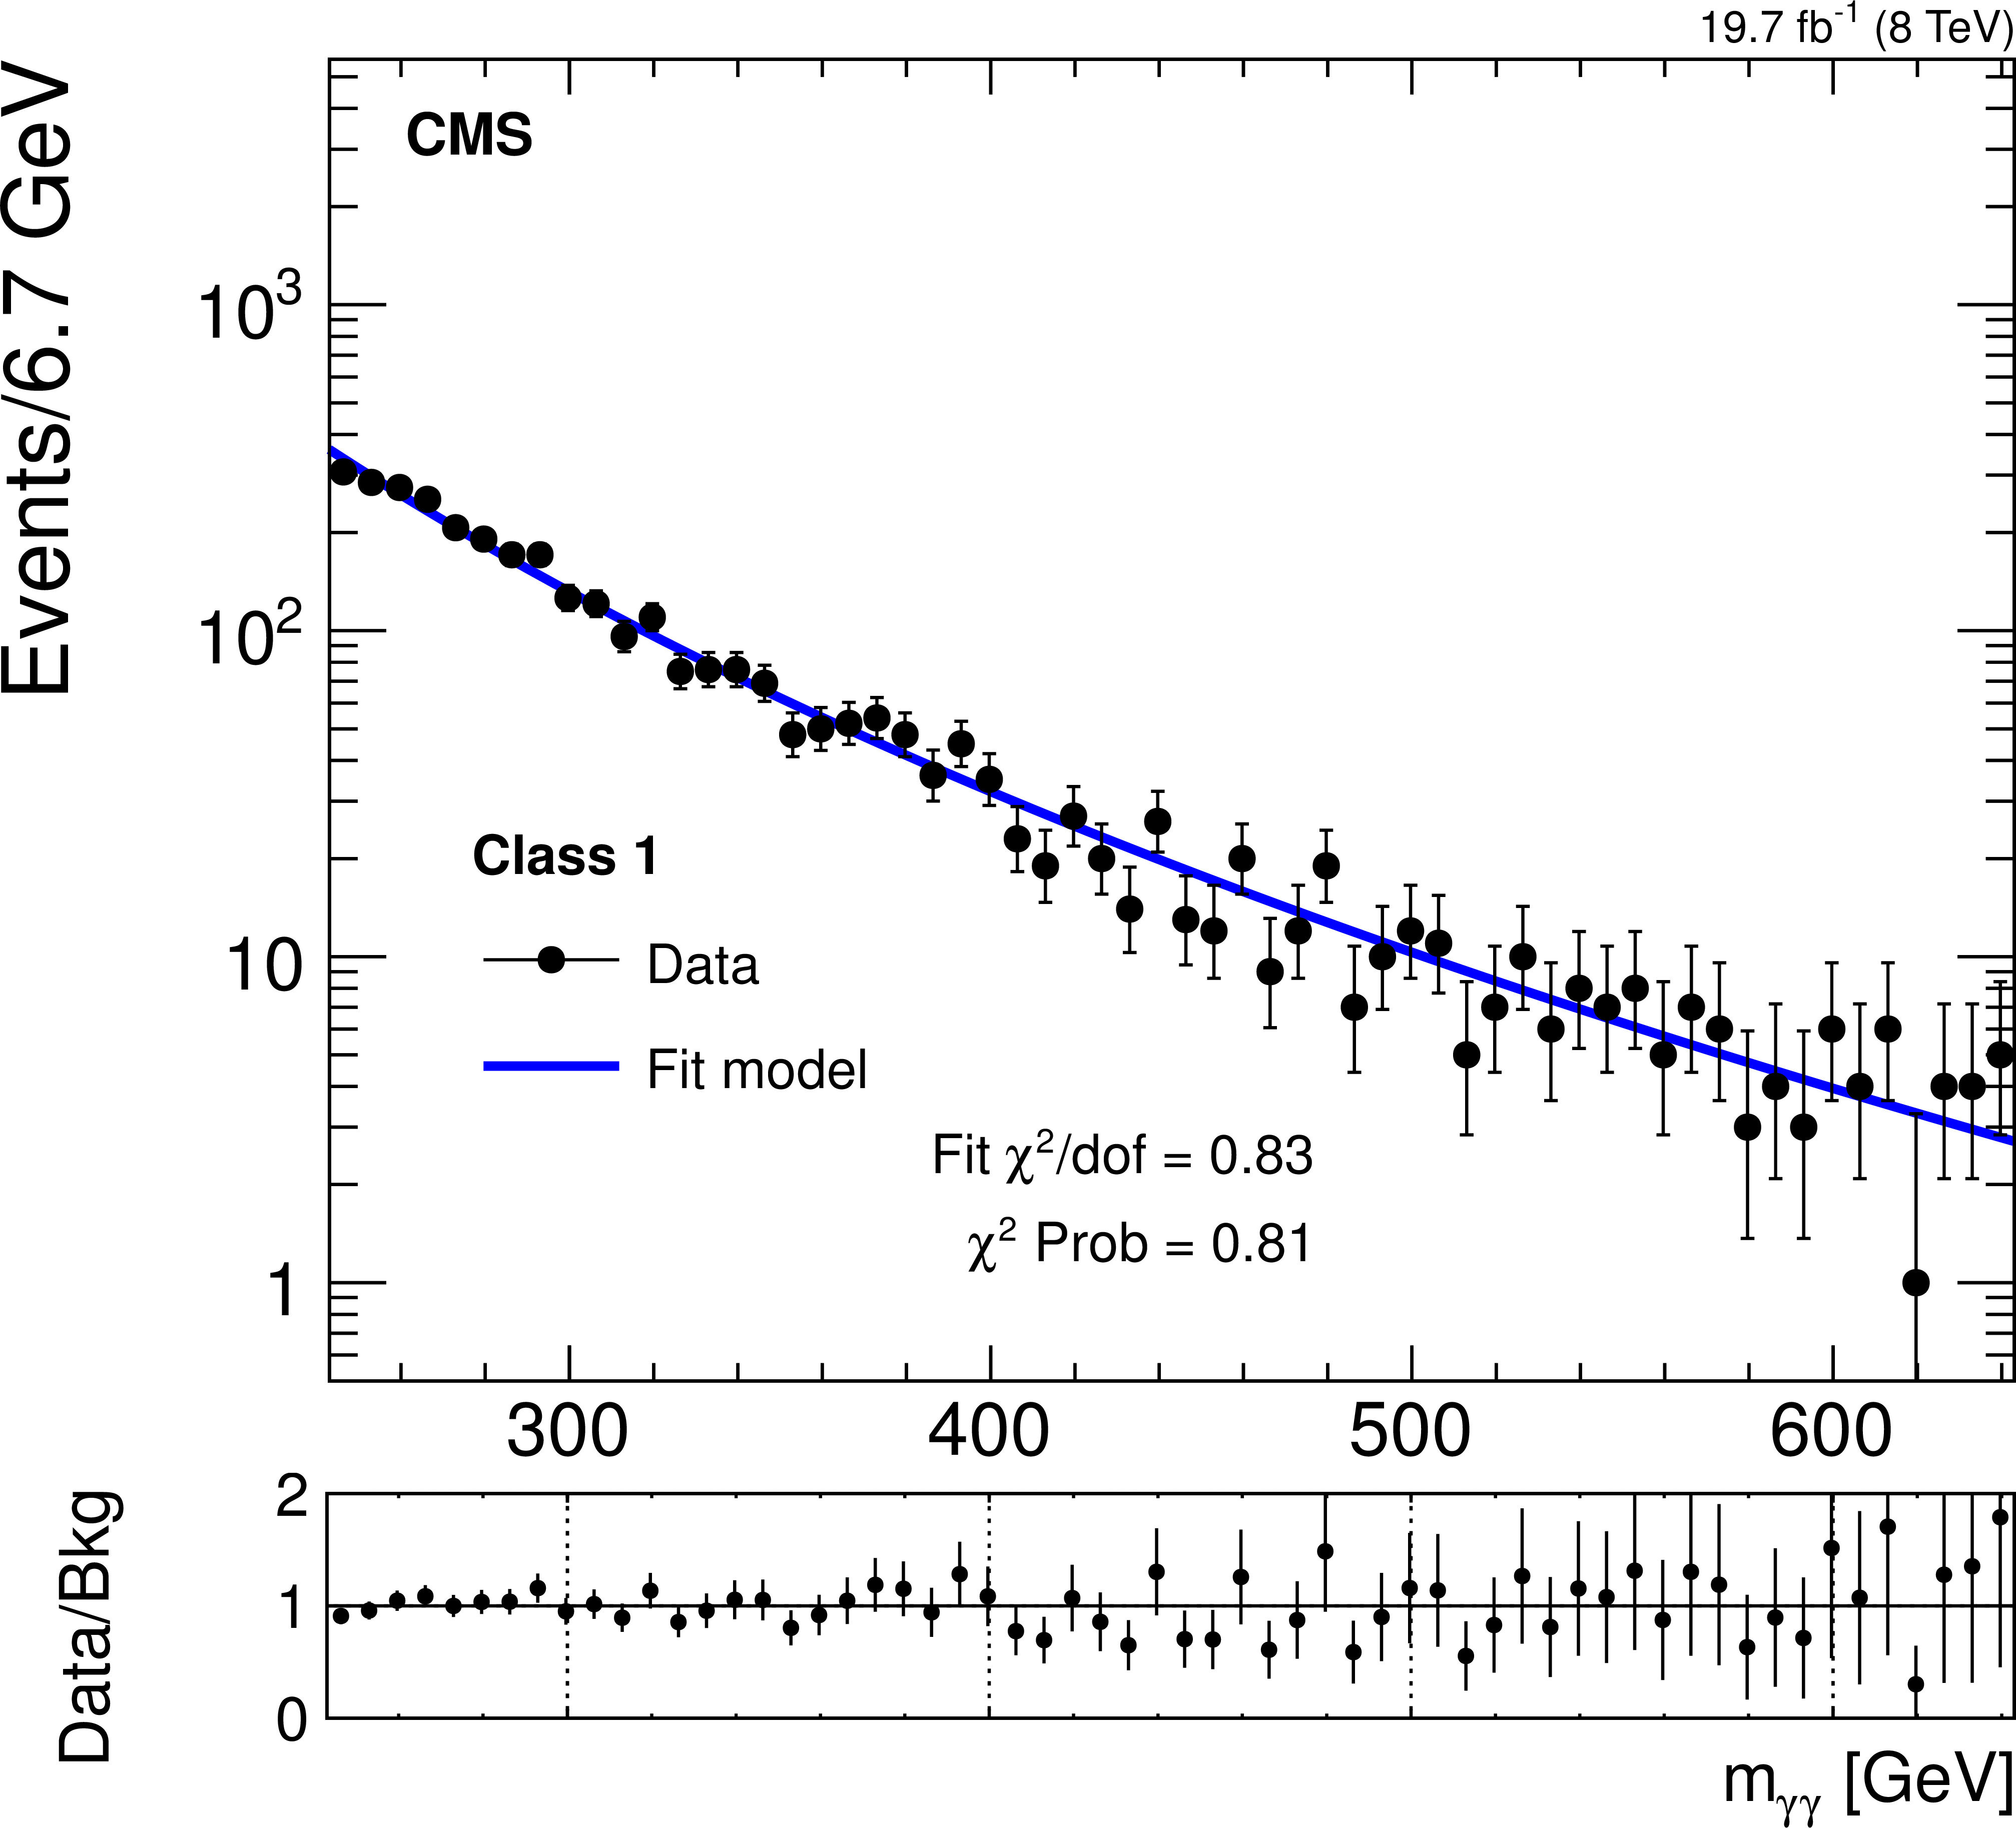
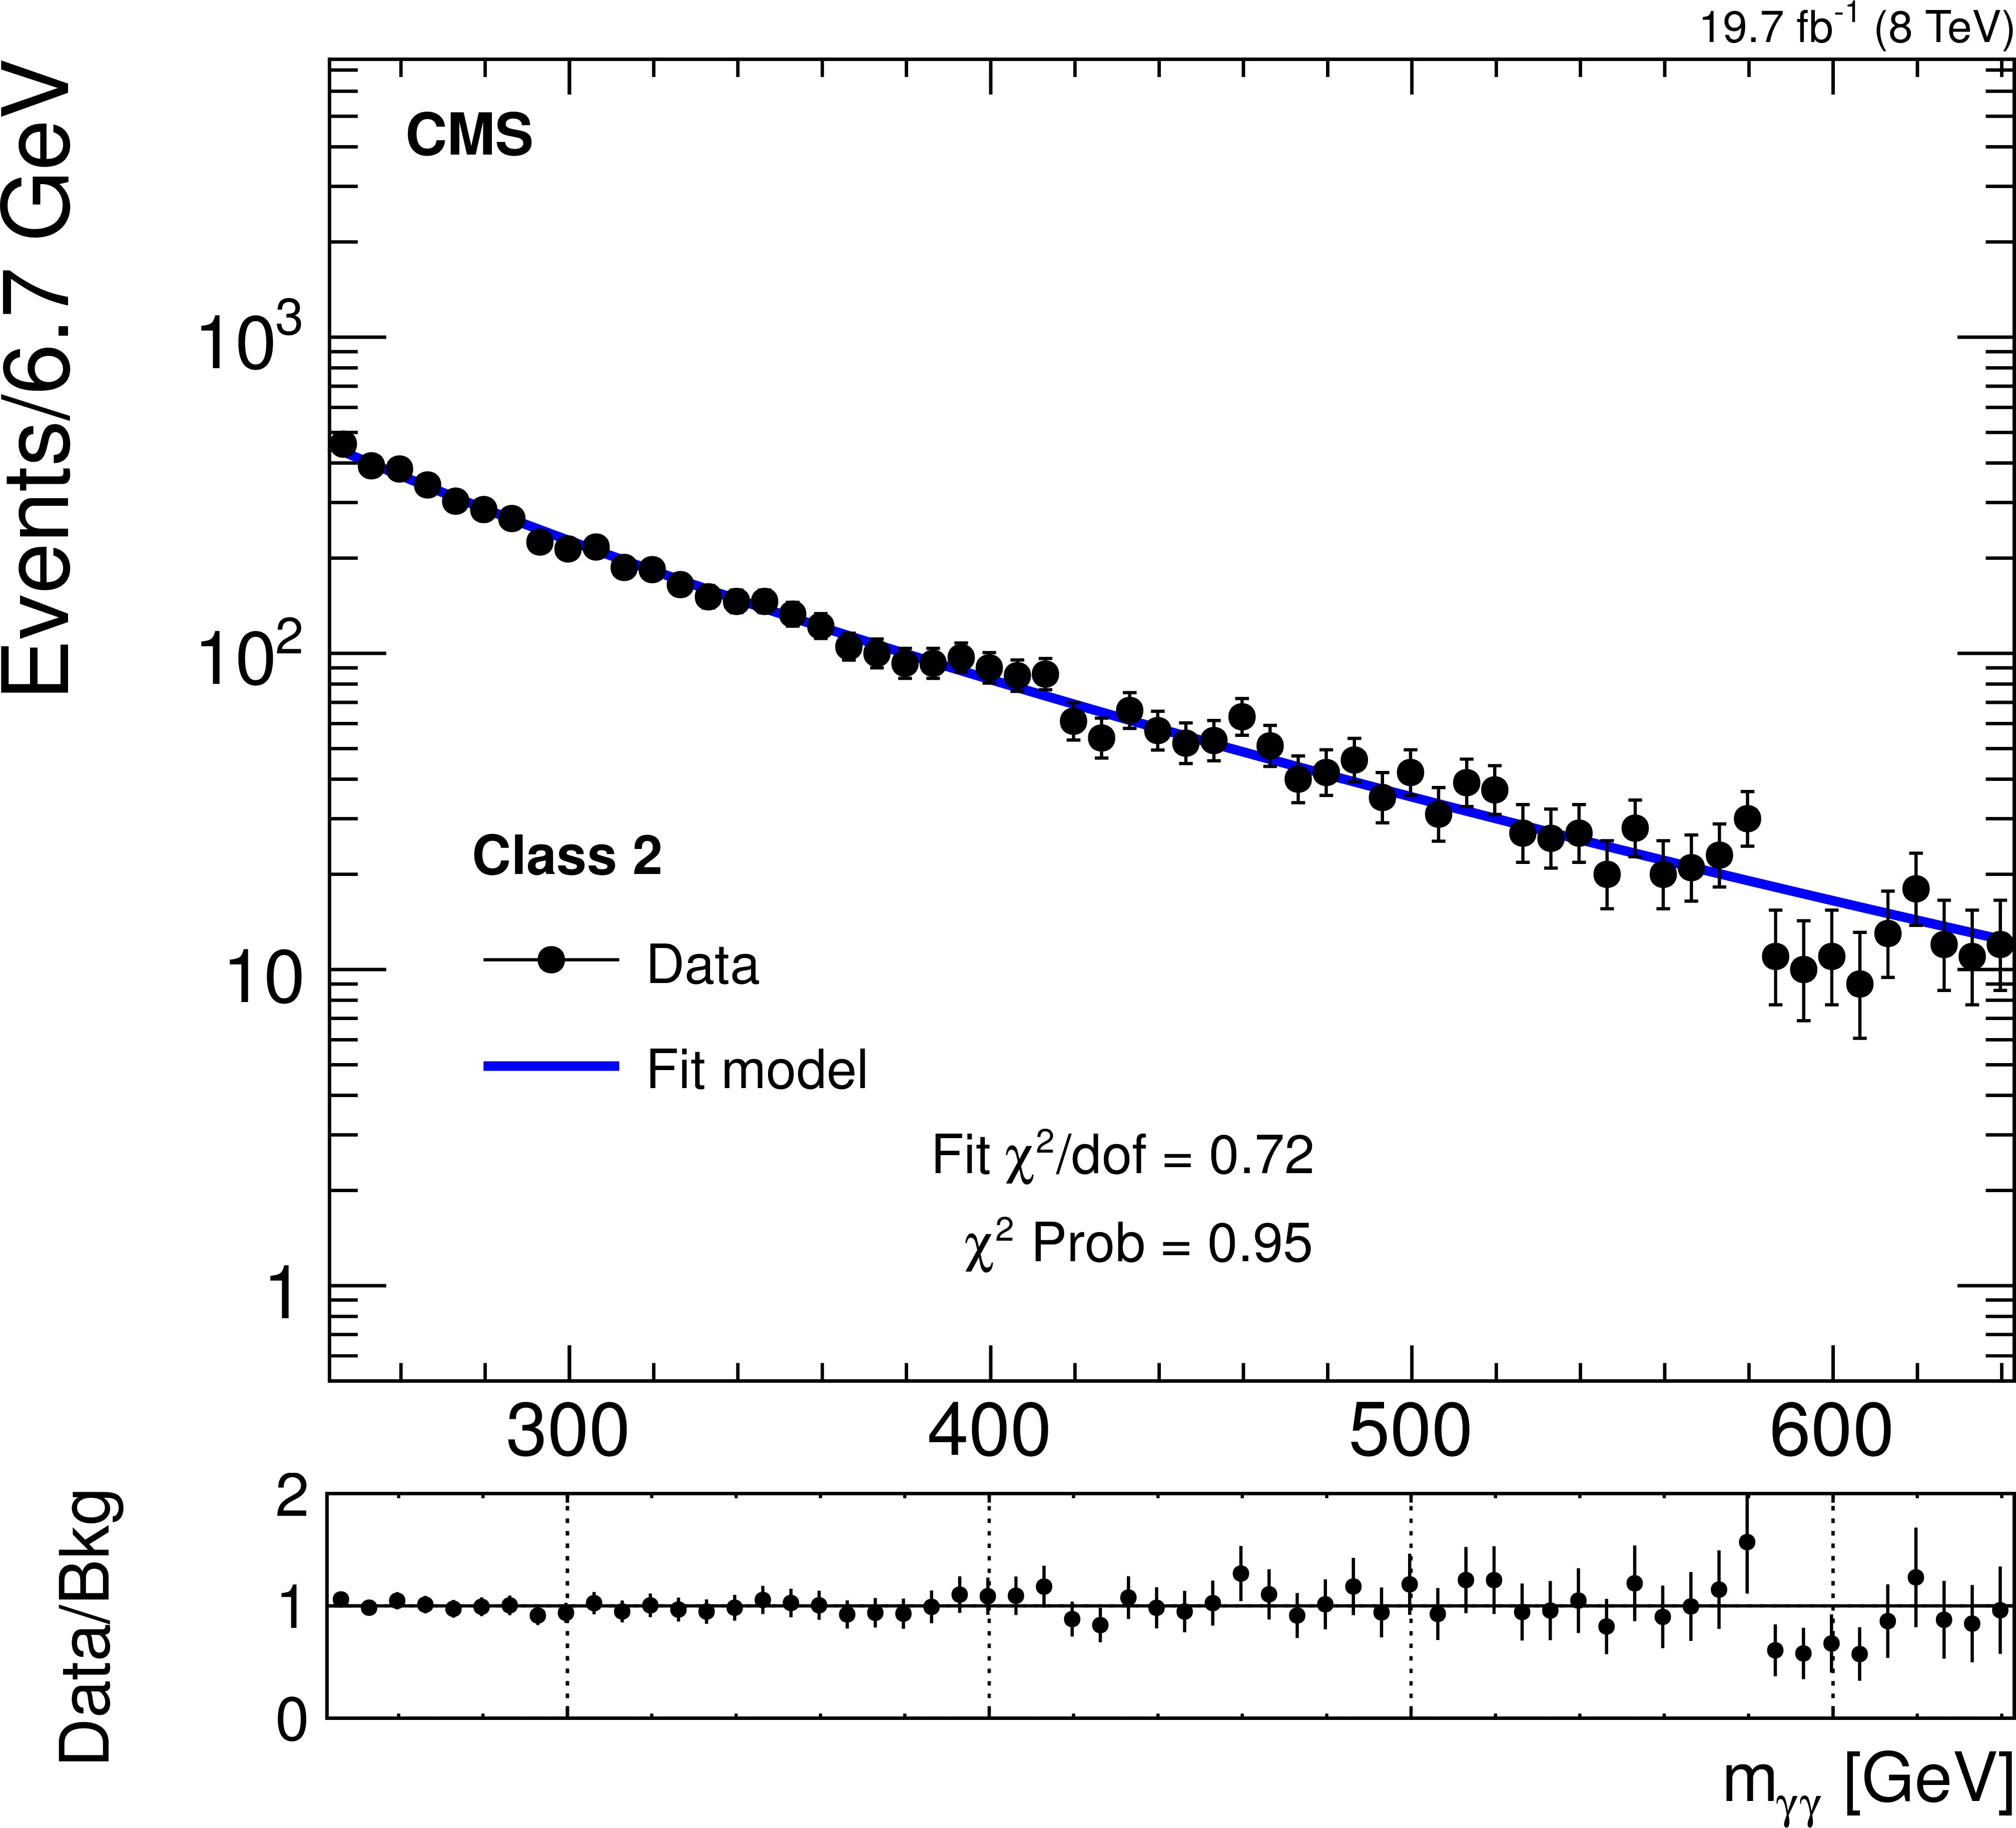
Fits to the diphoton mass distributions in the four classes of events in the window [240, 640] GeV chosen for searching for a peak near 350 GeV using the $f_0$ model and assuming no signal. The ratio between data and $f_0$ is displayed bin by bin in the bottom plot. |
png pdf |
Figure 5-b:
Fits to the diphoton mass distributions in the four classes of events in the window [240, 640] GeV chosen for searching for a peak near 350 GeV using the $f_0$ model and assuming no signal. The ratio between data and $f_0$ is displayed bin by bin in the bottom plot. |
png pdf |
Figure 5-c:
Fits to the diphoton mass distributions in the four classes of events in the window [240, 640] GeV chosen for searching for a peak near 350 GeV using the $f_0$ model and assuming no signal. The ratio between data and $f_0$ is displayed bin by bin in the bottom plot. |
png pdf |
Figure 5-d:
Fits to the diphoton mass distributions in the four classes of events in the window [240, 640] GeV chosen for searching for a peak near 350 GeV using the $f_0$ model and assuming no signal. The ratio between data and $f_0$ is displayed bin by bin in the bottom plot. |
png pdf |
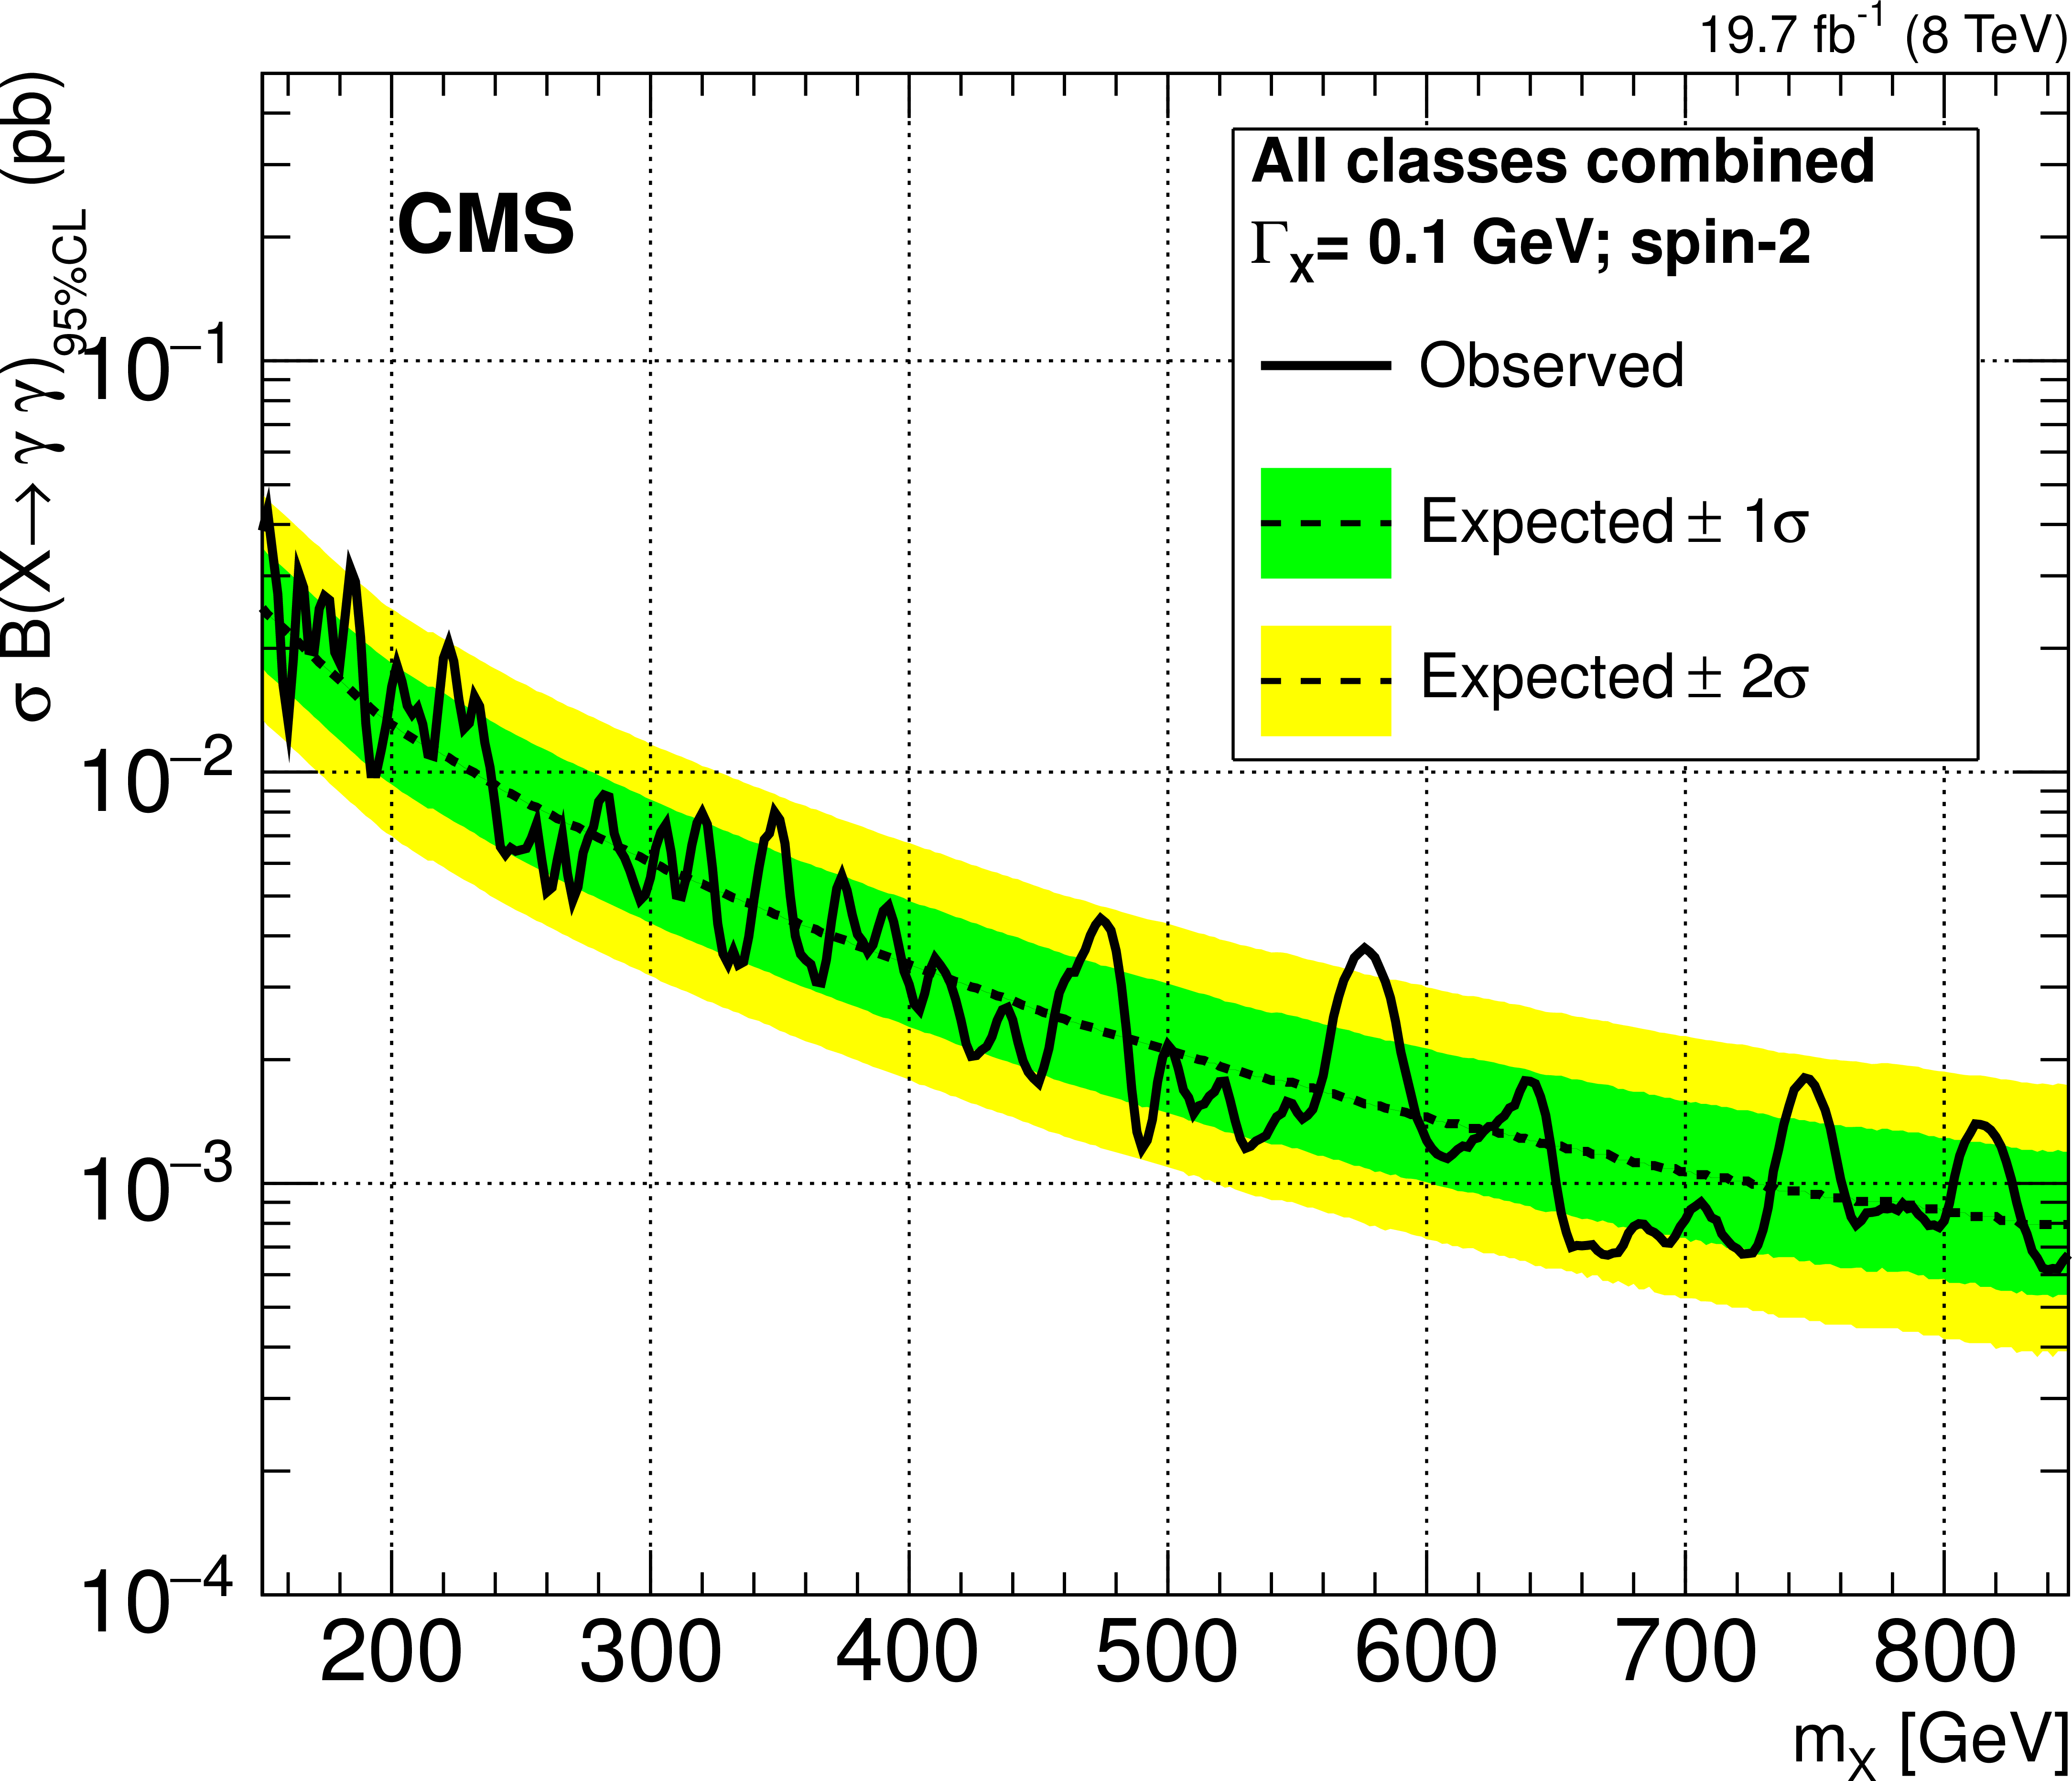
Figure 6:
Exclusion limit at 95% CL on the cross section times branching fraction of a new, narrow, spin-2 resonance decaying into two photons as a function of the resonance mass hypothesis, combining the four classes of events. |

png pdf |
Figure 7-a:
Exclusion limit at 95% CL on the cross section times branching fraction of a new, spin-0 resonance decaying into two photons as a function of the resonance mass hypothesis, combining the four classes of events. The results for a narrow resonance hypothesis ($\Gamma _ {\mathrm {X}} = 0.1 GeV $) are shown (left) and for a wide resonance hypothesis ($\Gamma _ {\mathrm {X}} = 0.1 m_ {\mathrm {X}} $) (right). |
png pdf |
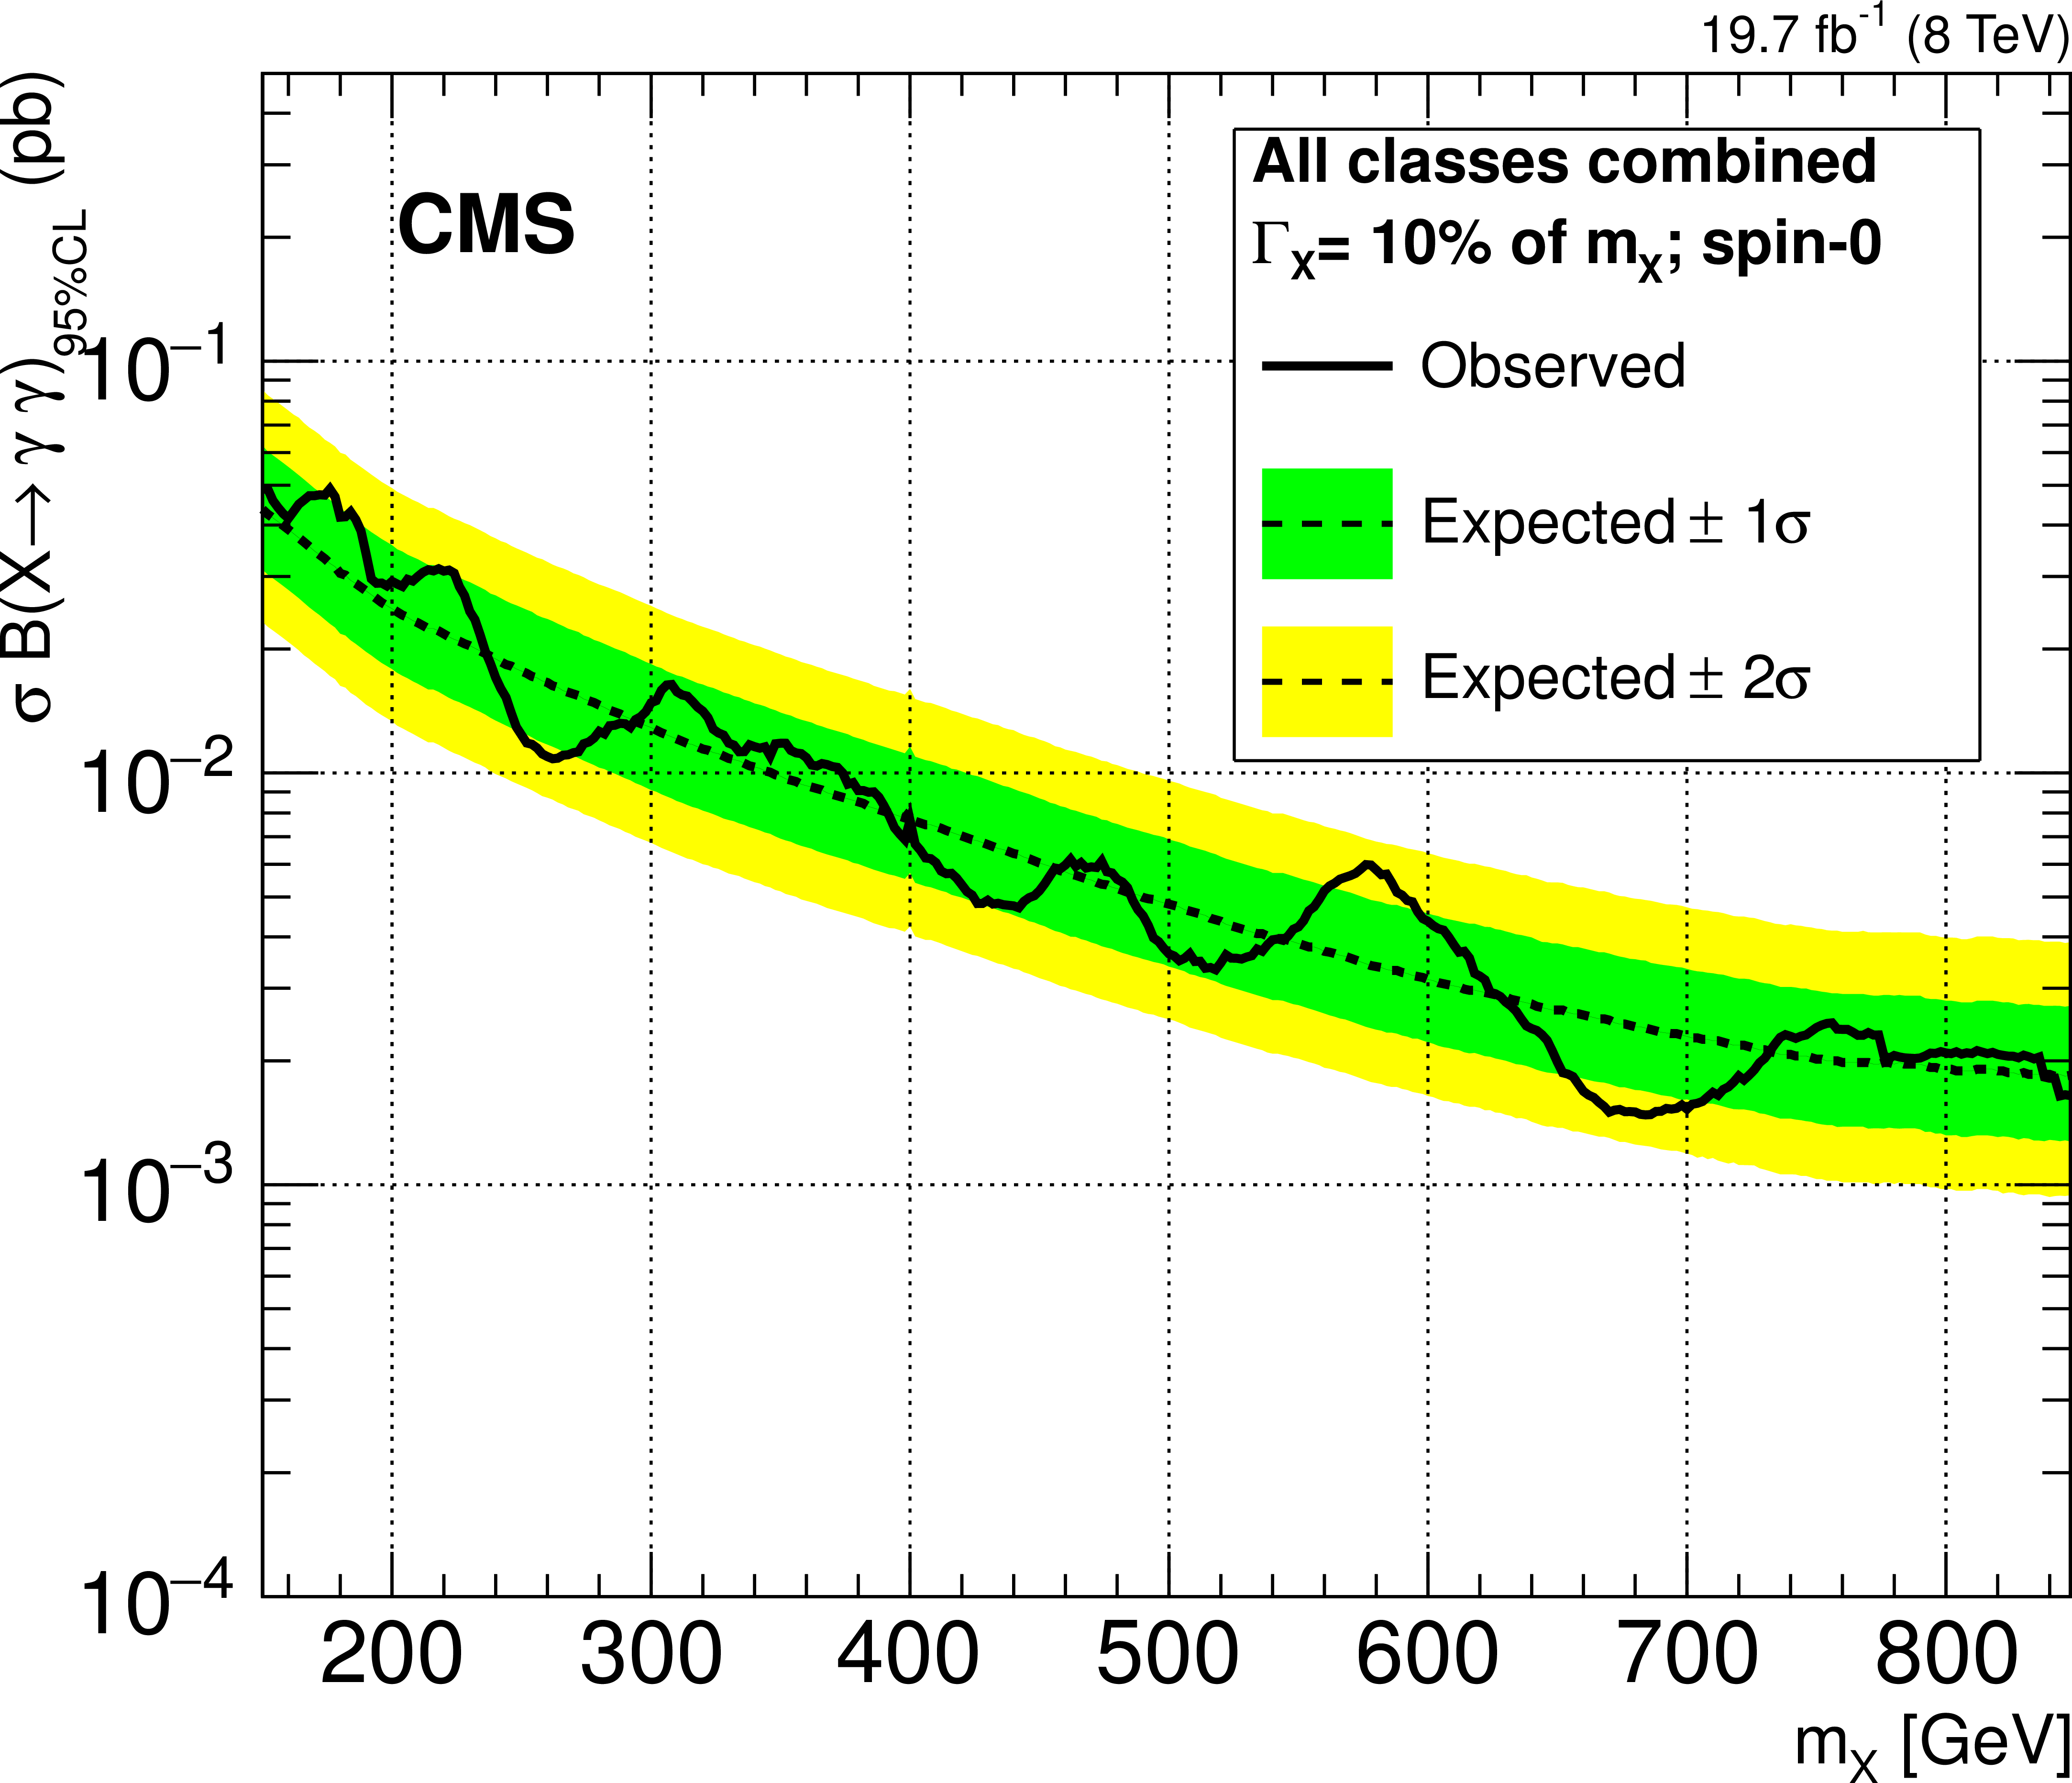
Figure 7-b:
Exclusion limit at 95% CL on the cross section times branching fraction of a new, spin-0 resonance decaying into two photons as a function of the resonance mass hypothesis, combining the four classes of events. The results for a narrow resonance hypothesis ($\Gamma _ {\mathrm {X}} = 0.1 GeV $) are shown (left) and for a wide resonance hypothesis ($\Gamma _ {\mathrm {X}} = 0.1 m_ {\mathrm {X}} $) (right). |

png pdf |
Figure 8-a:
Exclusion limit at 95% CL on the cross section times branching fraction of a new, spin-0 resonance decaying into two photons as a function of the resonance width hypothesis, combining the four classes of events. The results for $m_ {\mathrm {X}} $ = 150 (840) GeV are shown on a (b). |
png pdf |
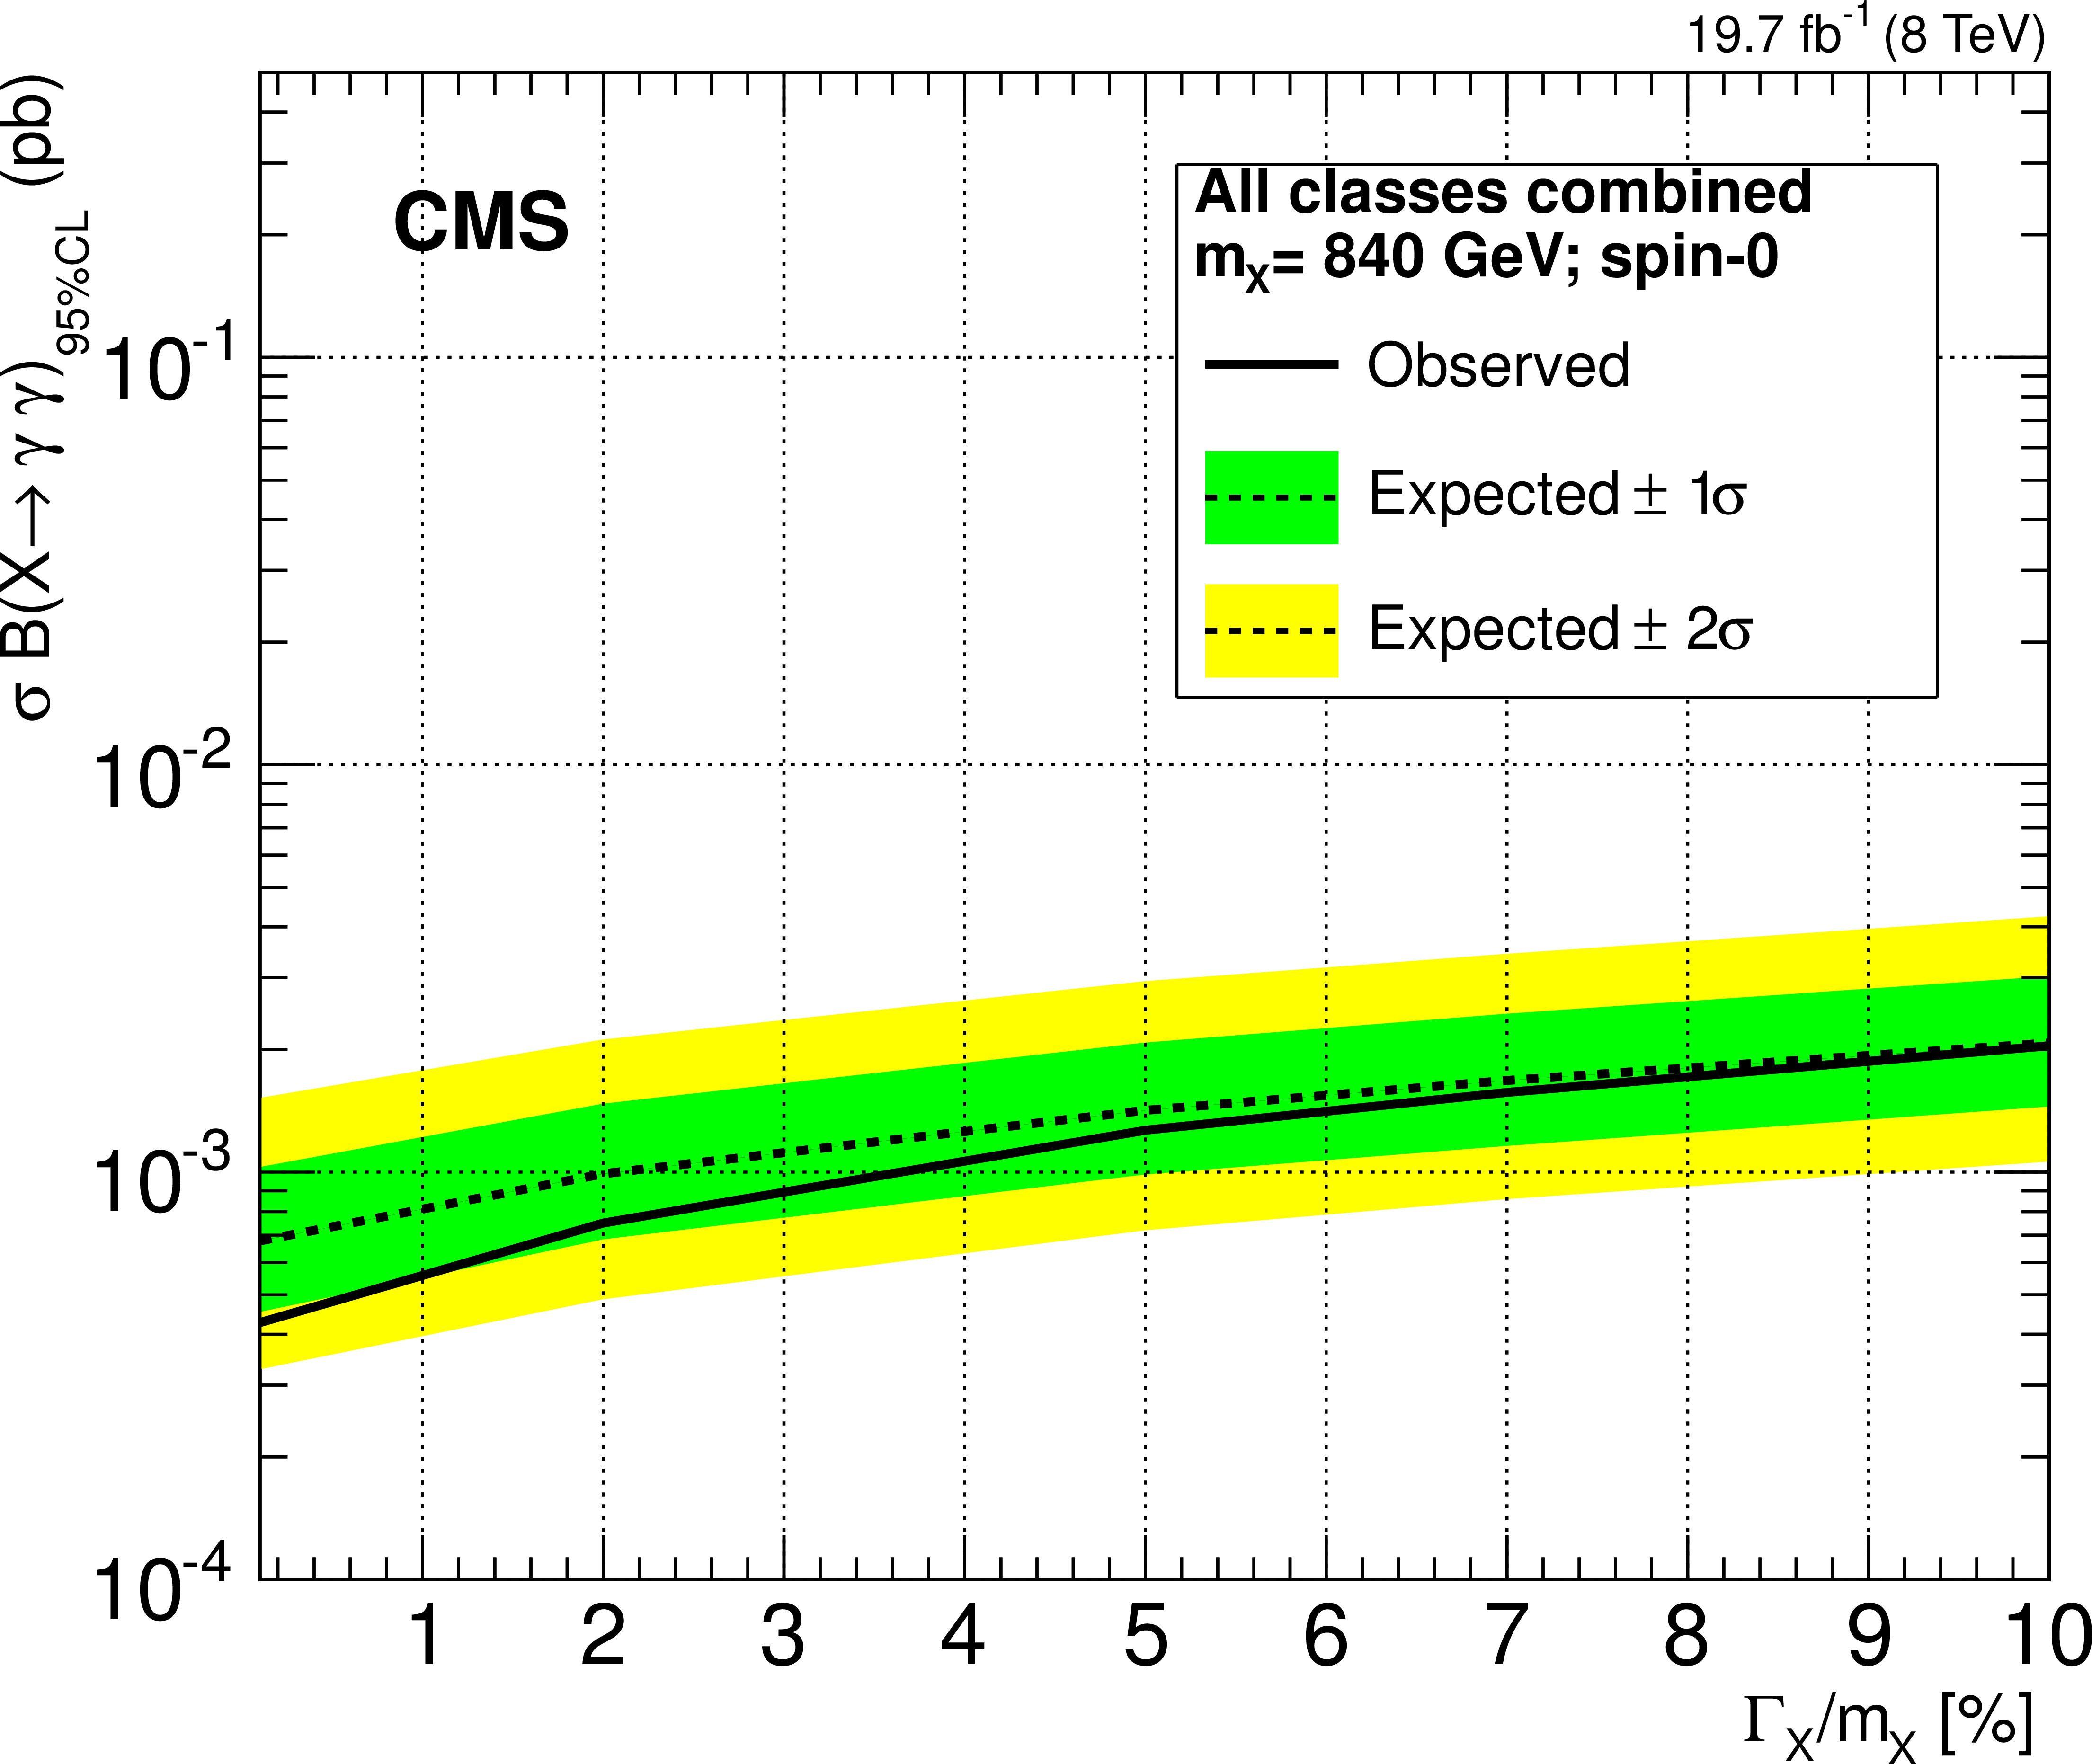
Figure 8-b:
Exclusion limit at 95% CL on the cross section times branching fraction of a new, spin-0 resonance decaying into two photons as a function of the resonance width hypothesis, combining the four classes of events. The results for $m_ {\mathrm {X}} $ = 150 (840) GeV are shown on a (b). |
png pdf |
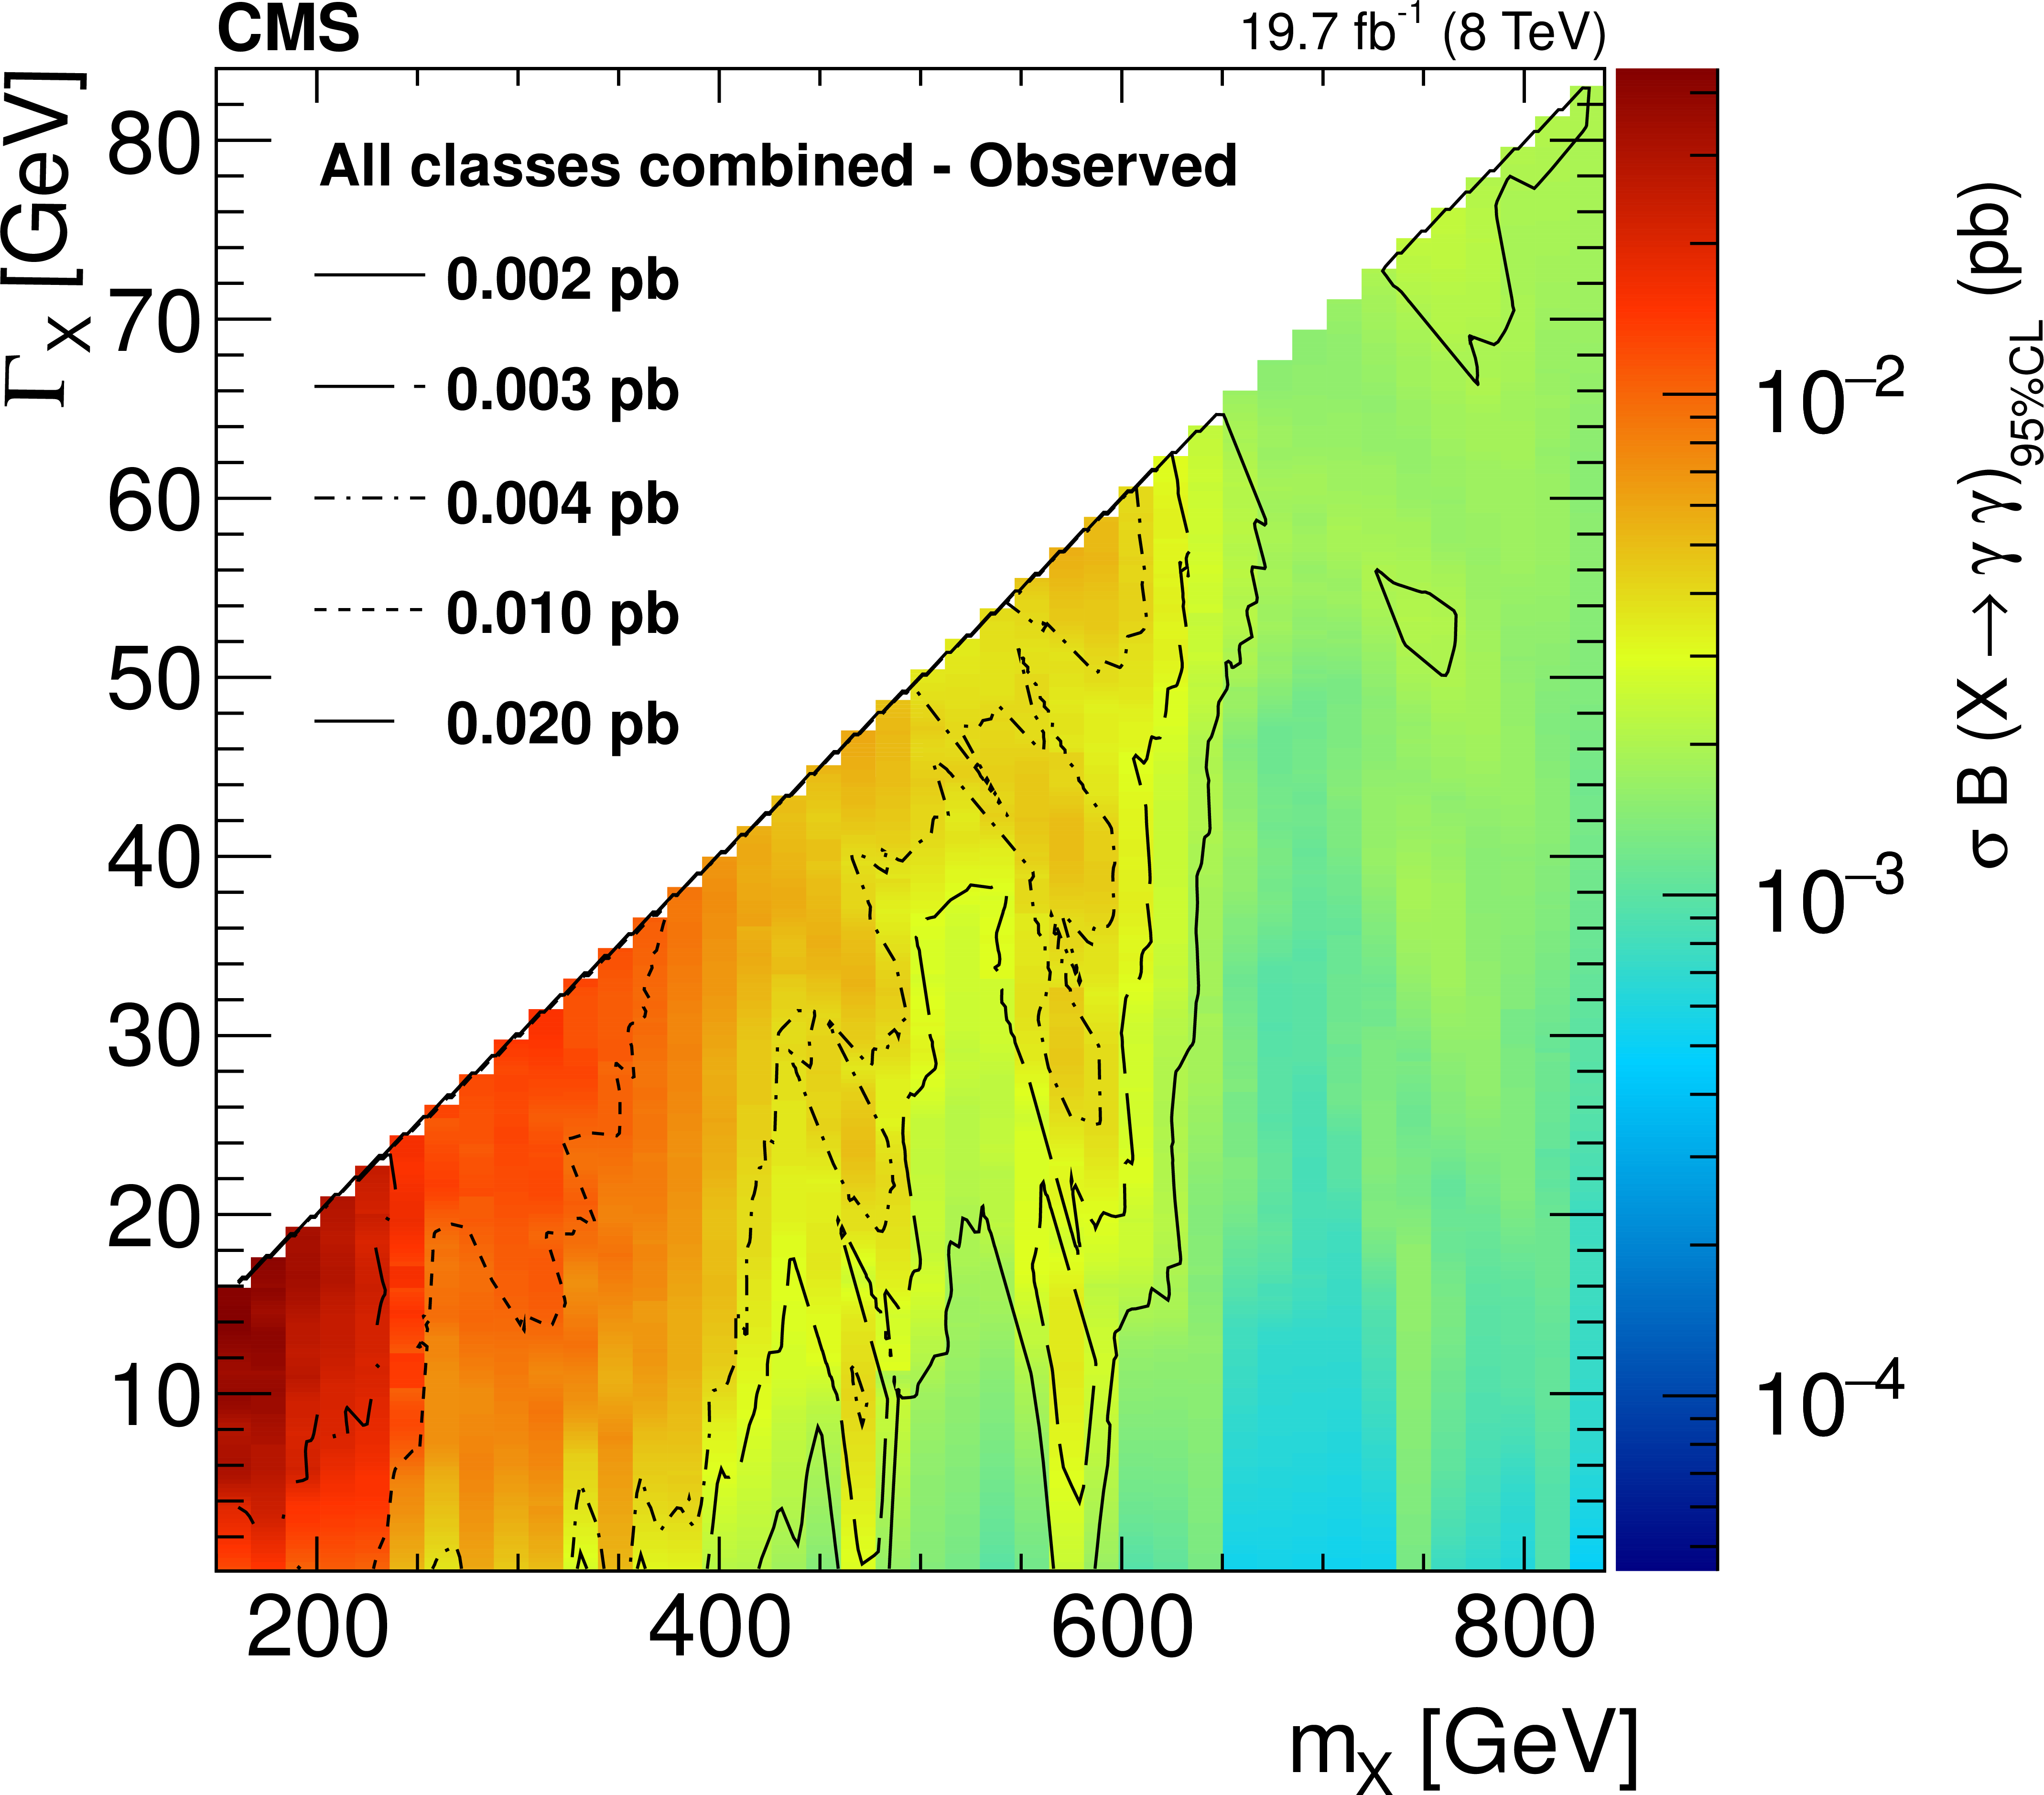
Figure 9-a:
Combined observed (a) and expected (b) exclusion limits at 95% CL on the cross section times branching fraction of a new, spin-0 resonance decaying into two photons as a function of the resonance mass and width hypotheses. Contours are displayed for different values of $\sigma \mathcal {B}(X \to \gamma \gamma )$. |
png pdf |
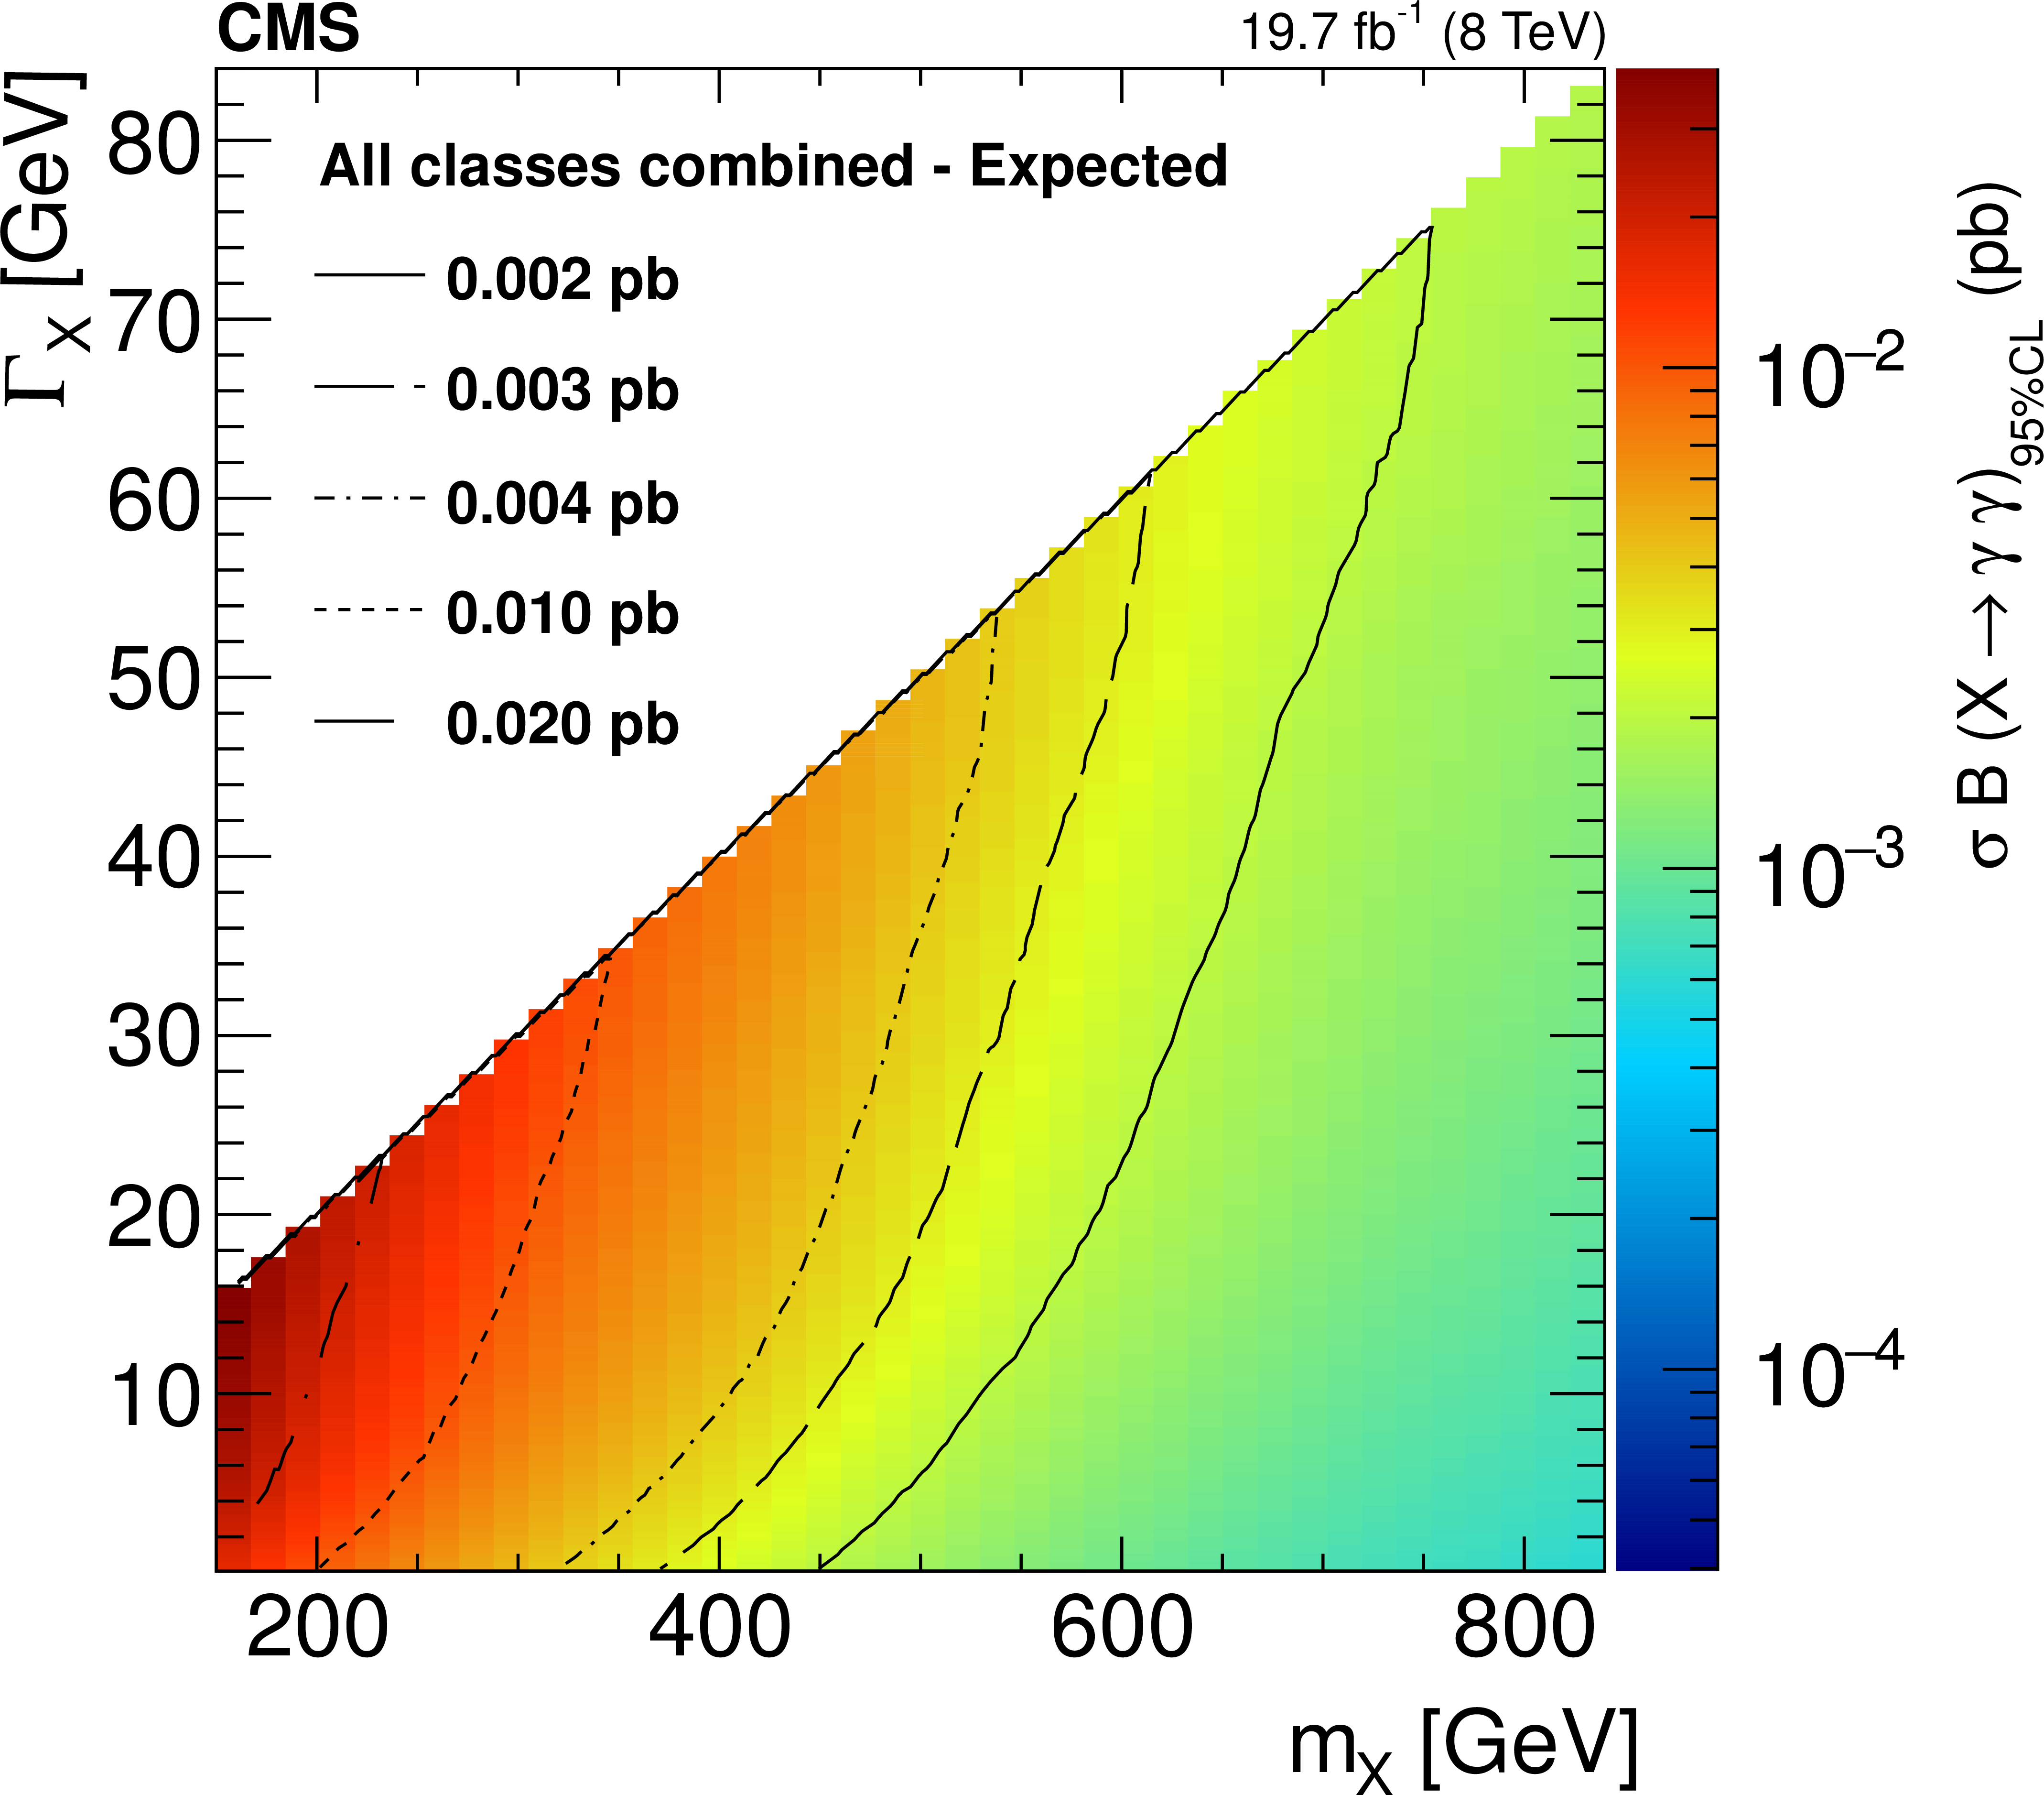
Figure 9-b:
Combined observed (a) and expected (b) exclusion limits at 95% CL on the cross section times branching fraction of a new, spin-0 resonance decaying into two photons as a function of the resonance mass and width hypotheses. Contours are displayed for different values of $\sigma \mathcal {B}(X \to \gamma \gamma )$. |
png pdf |
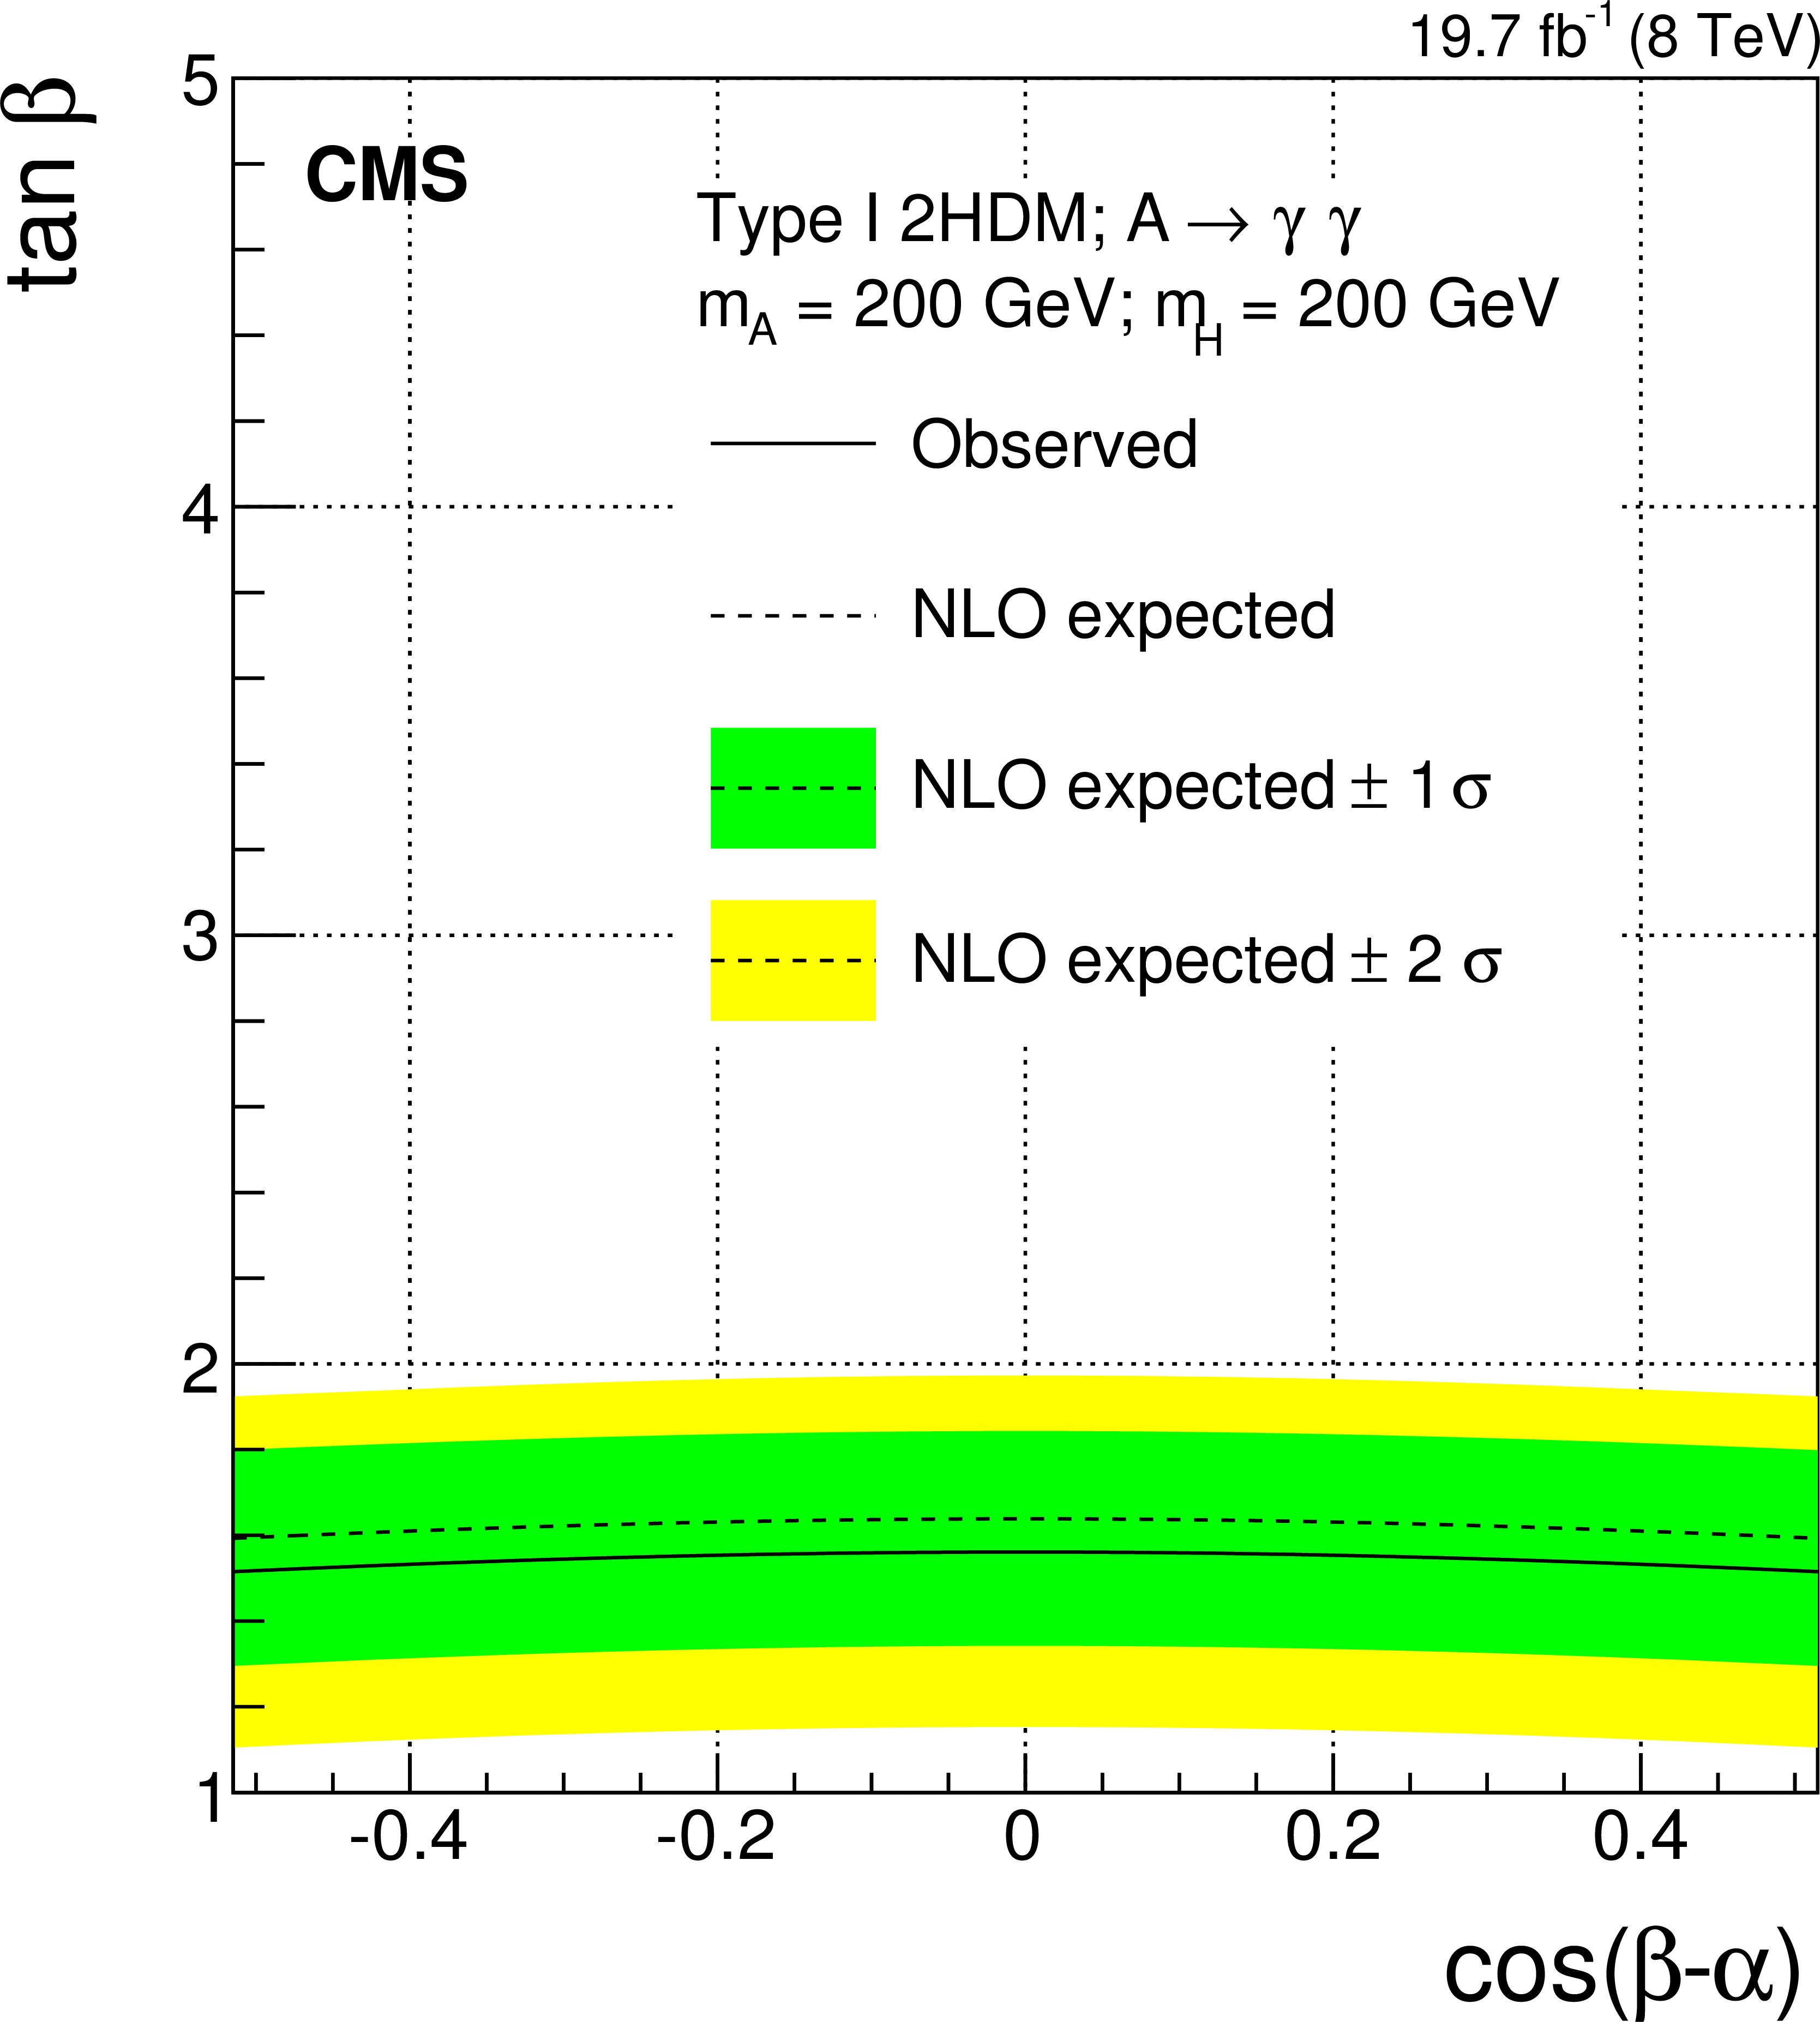
Figure 10-a:
Observed and expected 95% CL exclusion regions for gluon-fusion production of a heavy Higgs boson A $\cos(\beta -\alpha )$ plane for the Type I 2HDM, assuming the H boson to be degenerate in mass with A. The regions below the curves are excluded. |
png pdf |
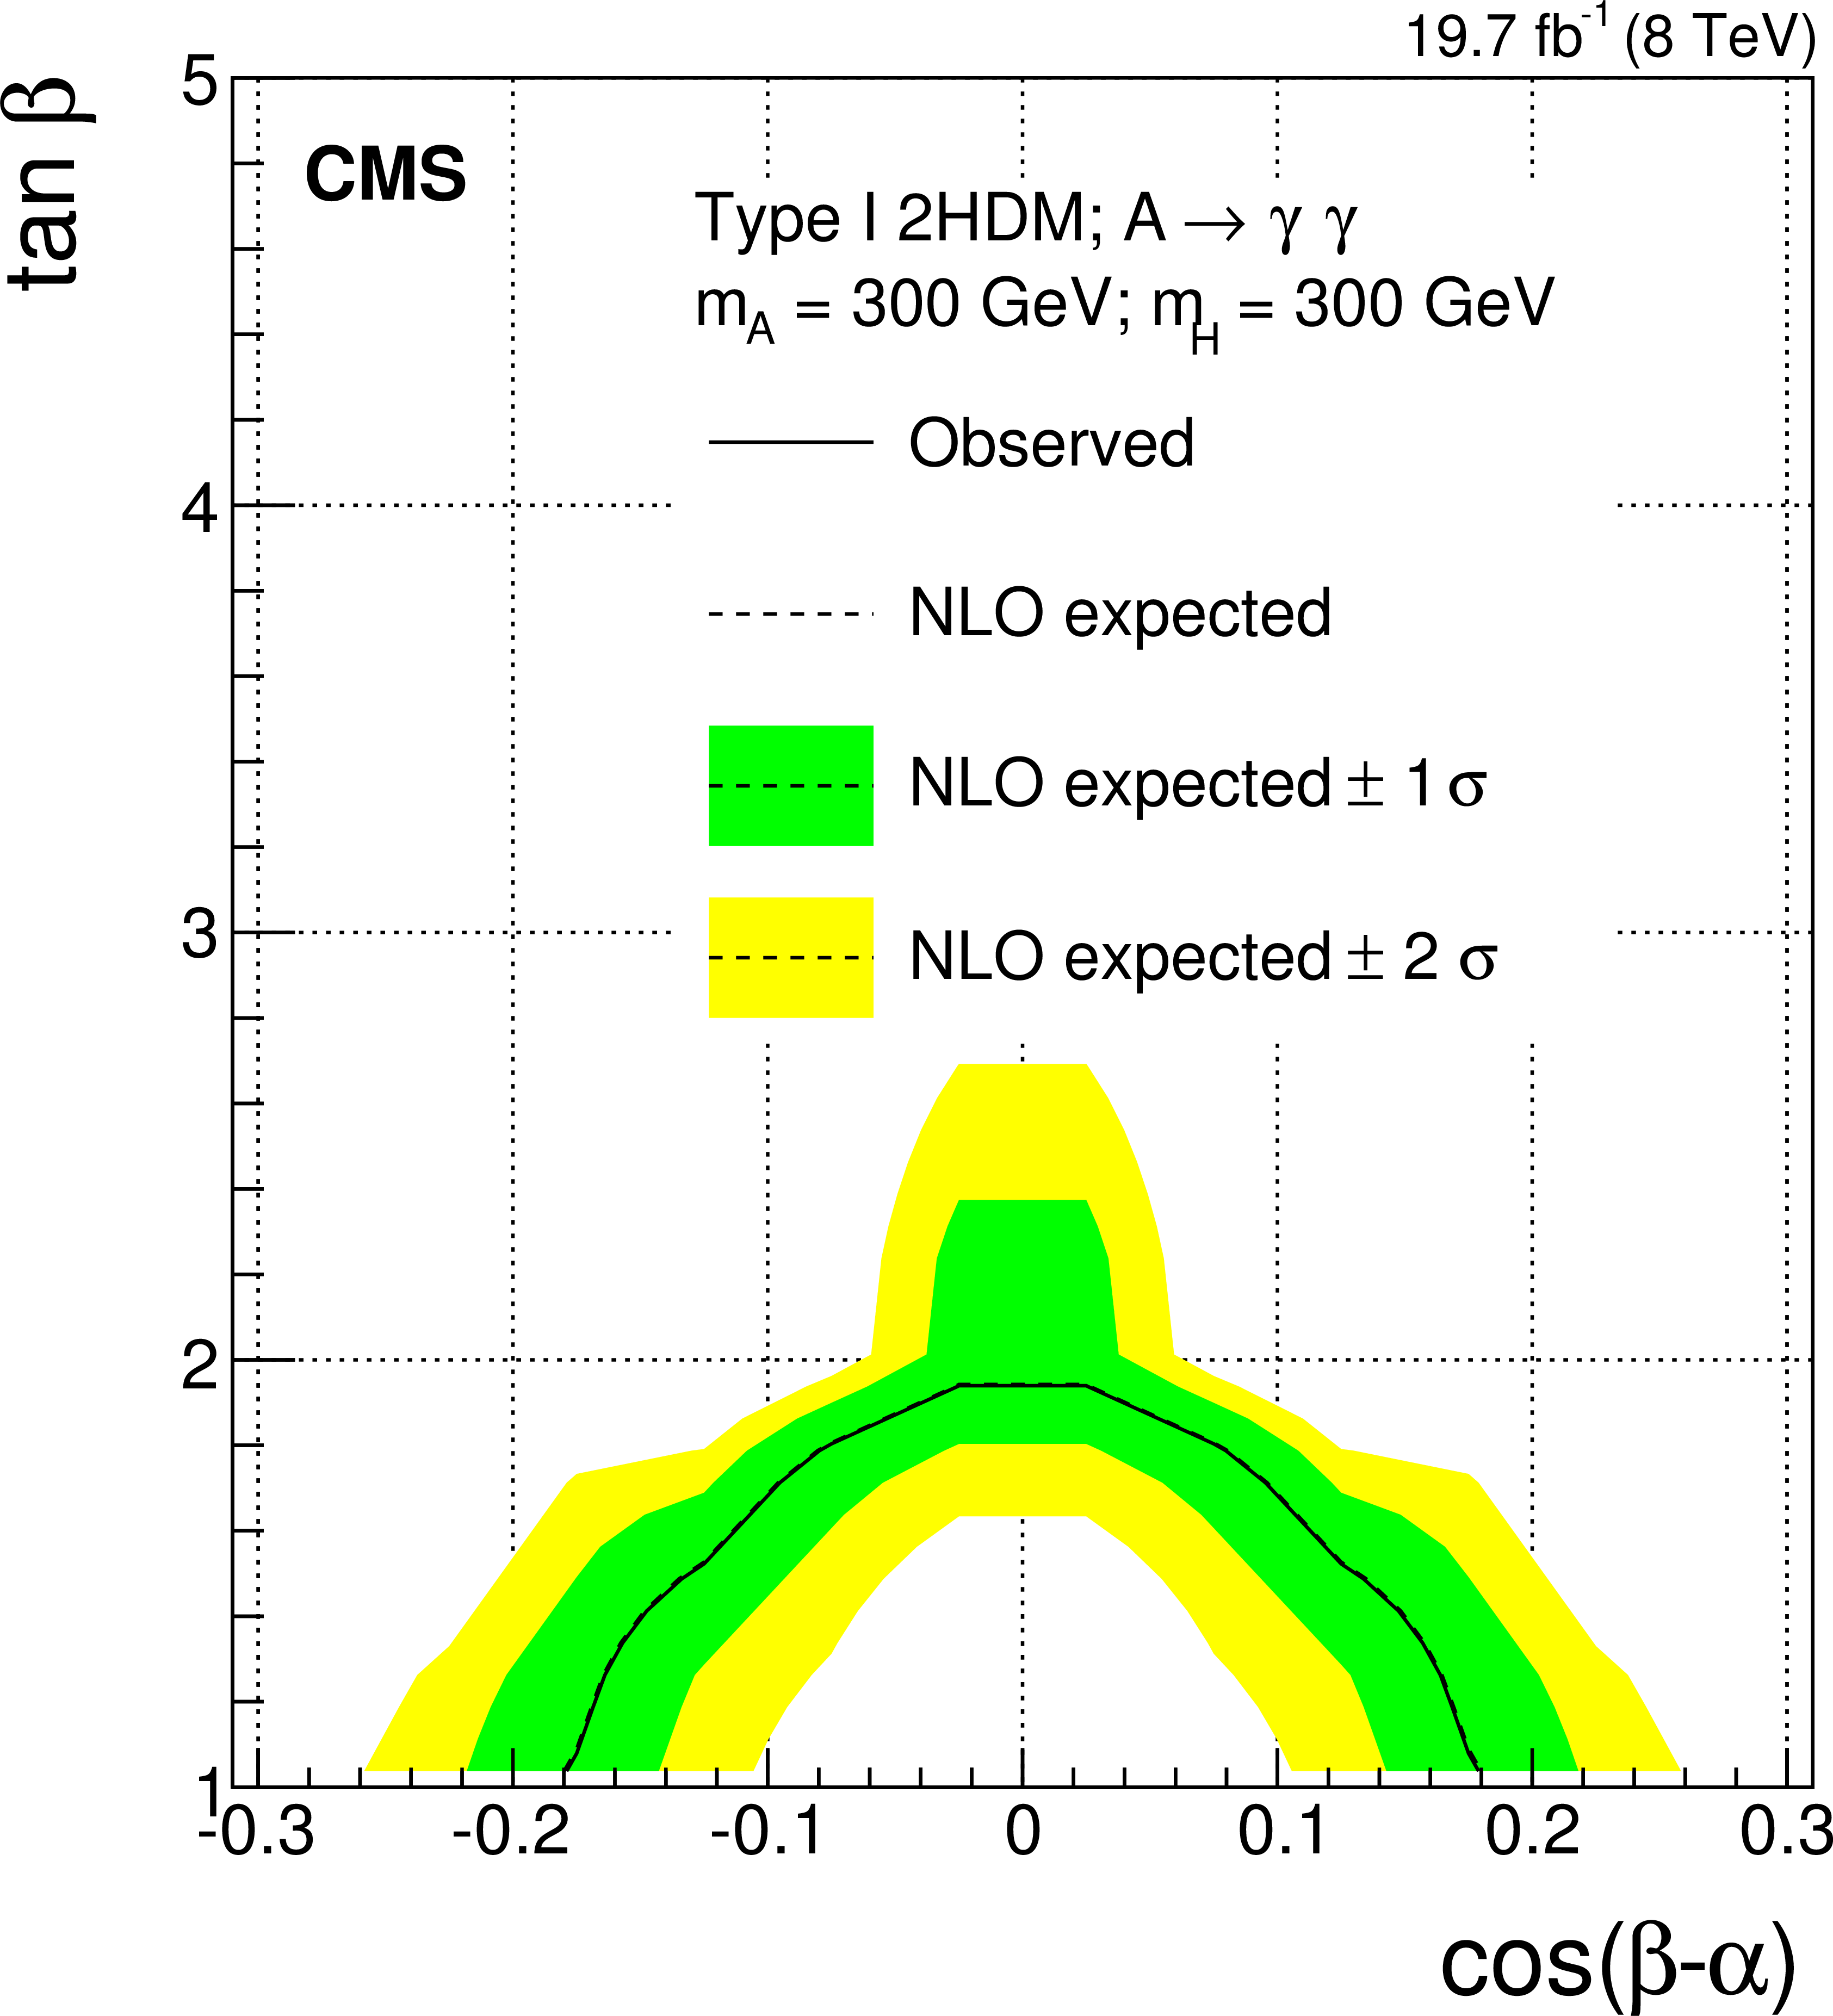
Figure 10-b:
Observed and expected 95% CL exclusion regions for gluon-fusion production of a heavy Higgs boson A $\cos(\beta -\alpha )$ plane for the Type I 2HDM, assuming the H boson to be degenerate in mass with A. The regions below the curves are excluded. |
| Tables | |
png pdf |
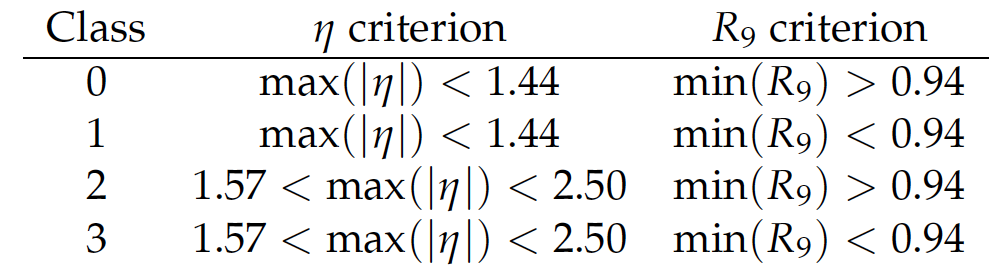
Table 1:
Definition of diphoton event classes |
png pdf |
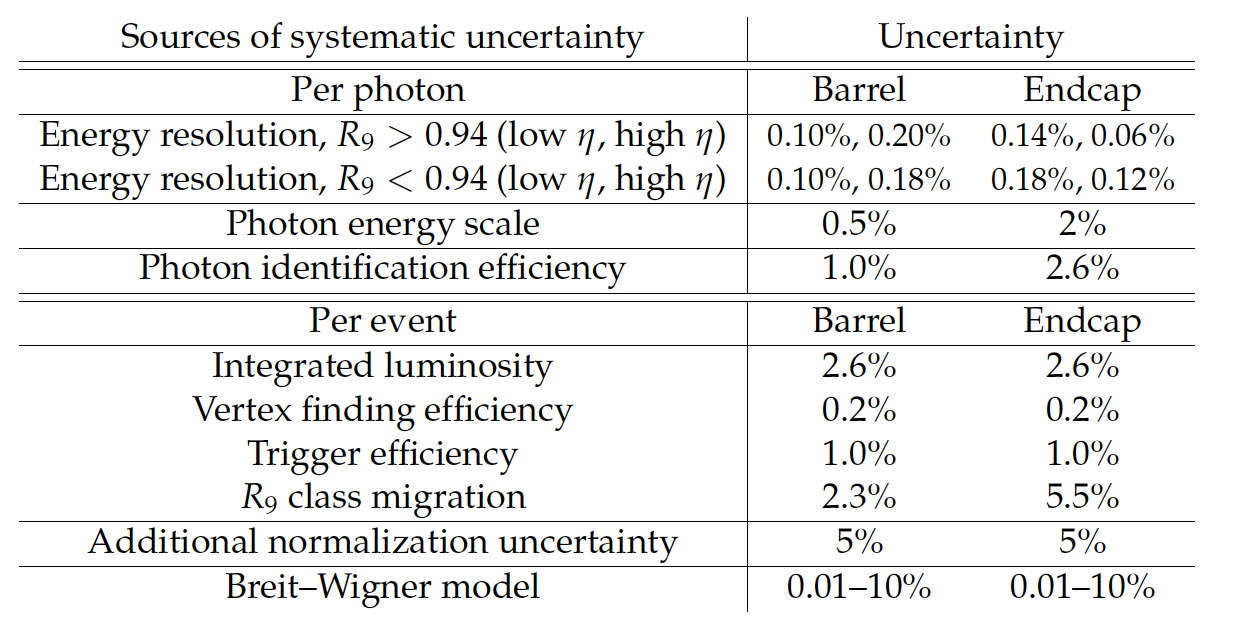
Table 2:
Summary of uncertainties that have impact on the signal strength, applicable to events in all classes. |
| Summary |
| A search for resonant production of two photons is performed using 19.7 fb$^{-1}$ of pp collisions collected at $\sqrt{s} = $ 8 TeV, in the mass range 150-850 GeV. Width of the resonance X in the range 0.1 GeV to 0.1$m_{\mathrm{X}}$ are investigated. Both spin-0 and spin-2 scenarios are considered. A fit to the diphoton invariant mass distribution in data is performed using a parametric model for the signal and a background shape obtained directly from data. No evidence for a signal is observed, and upper exclusion limits at 95% CL are set on the production cross section times branching fraction. The model-independent upper limits extend over considerably wider mass and width ranges than in previous searches. We further interpret these limits in the context of the 2HDM, presenting exclusion contours in the $\tan \beta$ versus $\cos( \beta - \alpha )$ plane. This is the first search for heavy diphoton resonances carried out at the LHC to be interpreted in terms of the 2HDM. |
|
|
Compact Muon Solenoid LHC, CERN |
|

|

|

|

|

|