

Compact Muon Solenoid
LHC, CERN
| CMS-SMP-12-028 ; CERN-PH-EP-2014-238 | ||
| Constraints on parton distribution functions and extraction of the strong coupling constant from the inclusive jet cross section in pp collisions at $\sqrt{s} =$ 7 TeV | ||
| CMS Collaboration | ||
| 25 October 2014 | ||
| Eur. Phys. J. C 75 (2015) 288 | ||
| Abstract: The inclusive jet cross section for proton-proton collisions at a centre-of-mass energy of 7 TeV was measured by the CMS Collaboration at the LHC with data corresponding to an integrated luminosity of 5.0 fb$^{-1}$. The measurement covers a phase space up to 2 TeV in jet transverse momentum and 2.5 in absolute jet rapidity. The statistical precision of these data leads to stringent constraints on the parton distribution functions of the proton. The data provide important input for the gluon density at high fractions of the proton momentum and for the strong coupling constant at large energy scales. Using predictions from perturbative quantum chromodynamics at next-to-leading order, complemented with electroweak corrections, the constraining power of these data is investigated and the strong coupling constant at the Z boson mass $M_{\mathrm{Z}}$ is determined to be $\alpha_S(M_{\mathrm{Z}}) = 0.1185 \pm 0.0019\,(\mathrm{exp})\,^{+0.0060}_{-0.0037}\,(\mathrm{theo})$, which is in agreement with the world average. | ||
| Links: e-print arXiv:1410.6765 [hep-ex] (PDF) ; CDS record ; inSPIRE record ; Public twiki page ; CADI line (restricted) ; | ||
| Figures | |

png pdf |
Figure 1:
Measured inclusive jet cross section from Ref.[1] compared to the prediction by POWHEG + PYTHIA-6 tune Z2* at particle level complemented with electroweak corrections. The boxes indicate the statistical uncertainty of the calculation. |

png pdf |
Figure 2-a:
NP corrections for the five regions in $ { {| y | }} $ as derived in Ref.[1], using PYTHIA-6 tune Z2 and HERWIG++ with the default tune of version2.3, in comparison to corrections obtained from POWHEG using PYTHIA-6 for showering with the two underlying event tunes P11 and Z2*. |

png pdf |
Figure 2-b:
NP corrections for the five regions in $ { {| y | }} $ as derived in Ref.[1], using PYTHIA-6 tune Z2 and HERWIG++ with the default tune of version2.3, in comparison to corrections obtained from POWHEG using PYTHIA-6 for showering with the two underlying event tunes P11 and Z2*. |

png pdf |
Figure 2-c:
NP corrections for the five regions in $ { {| y | }} $ as derived in Ref.[1], using PYTHIA-6 tune Z2 and HERWIG++ with the default tune of version2.3, in comparison to corrections obtained from POWHEG using PYTHIA-6 for showering with the two underlying event tunes P11 and Z2*. |

png pdf |
Figure 2-d:
NP corrections for the five regions in $ { {| y | }} $ as derived in Ref.[1], using PYTHIA-6 tune Z2 and HERWIG++ with the default tune of version2.3, in comparison to corrections obtained from POWHEG using PYTHIA-6 for showering with the two underlying event tunes P11 and Z2*. |

png pdf |
Figure 2-e:
NP corrections for the five regions in $ { {| y | }} $ as derived in Ref.[1], using PYTHIA-6 tune Z2 and HERWIG++ with the default tune of version2.3, in comparison to corrections obtained from POWHEG using PYTHIA-6 for showering with the two underlying event tunes P11 and Z2*. |
png pdf |
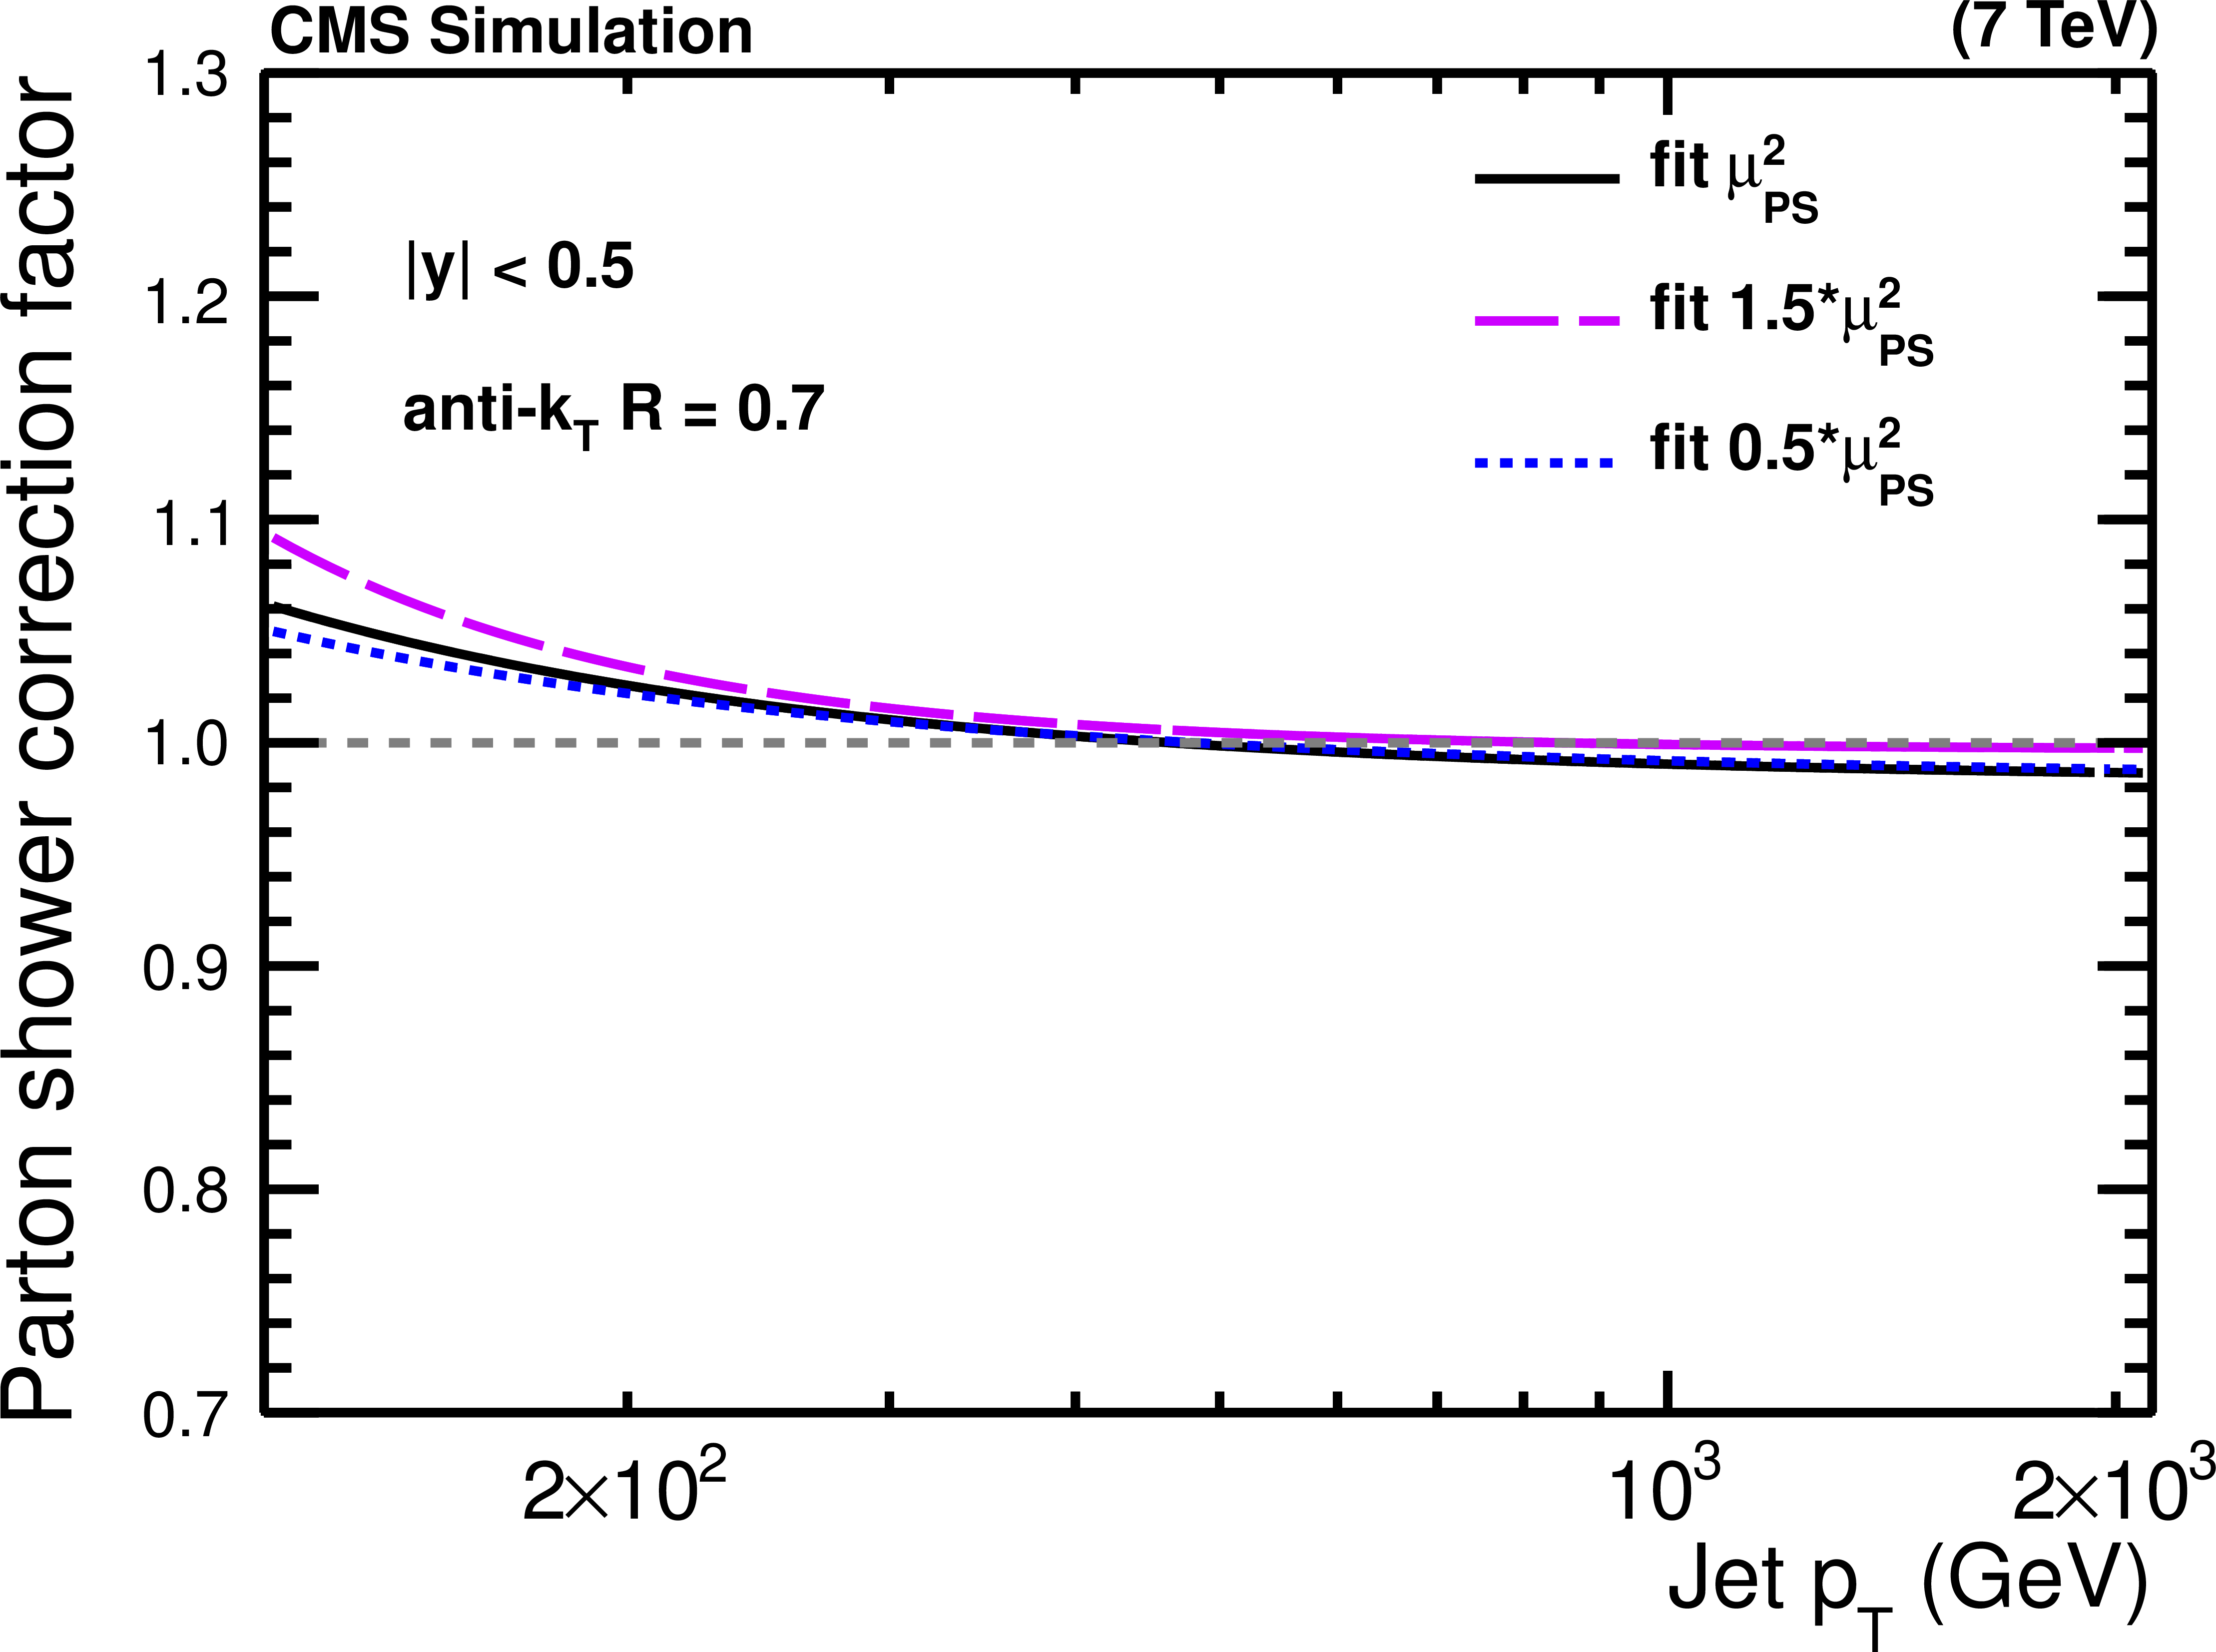
Figure 3-a:
PS corrections for the five regions in $ { {| y | }} $ obtained from POWHEG using PYTHIA-6 for showering for different upper scale limits of the parton shower evolution in PYTHIA-6 tune Z2*. The curves parameterize the correction factors as a function of the jet $ {p_{\mathrm {T}}} $. |
png pdf |
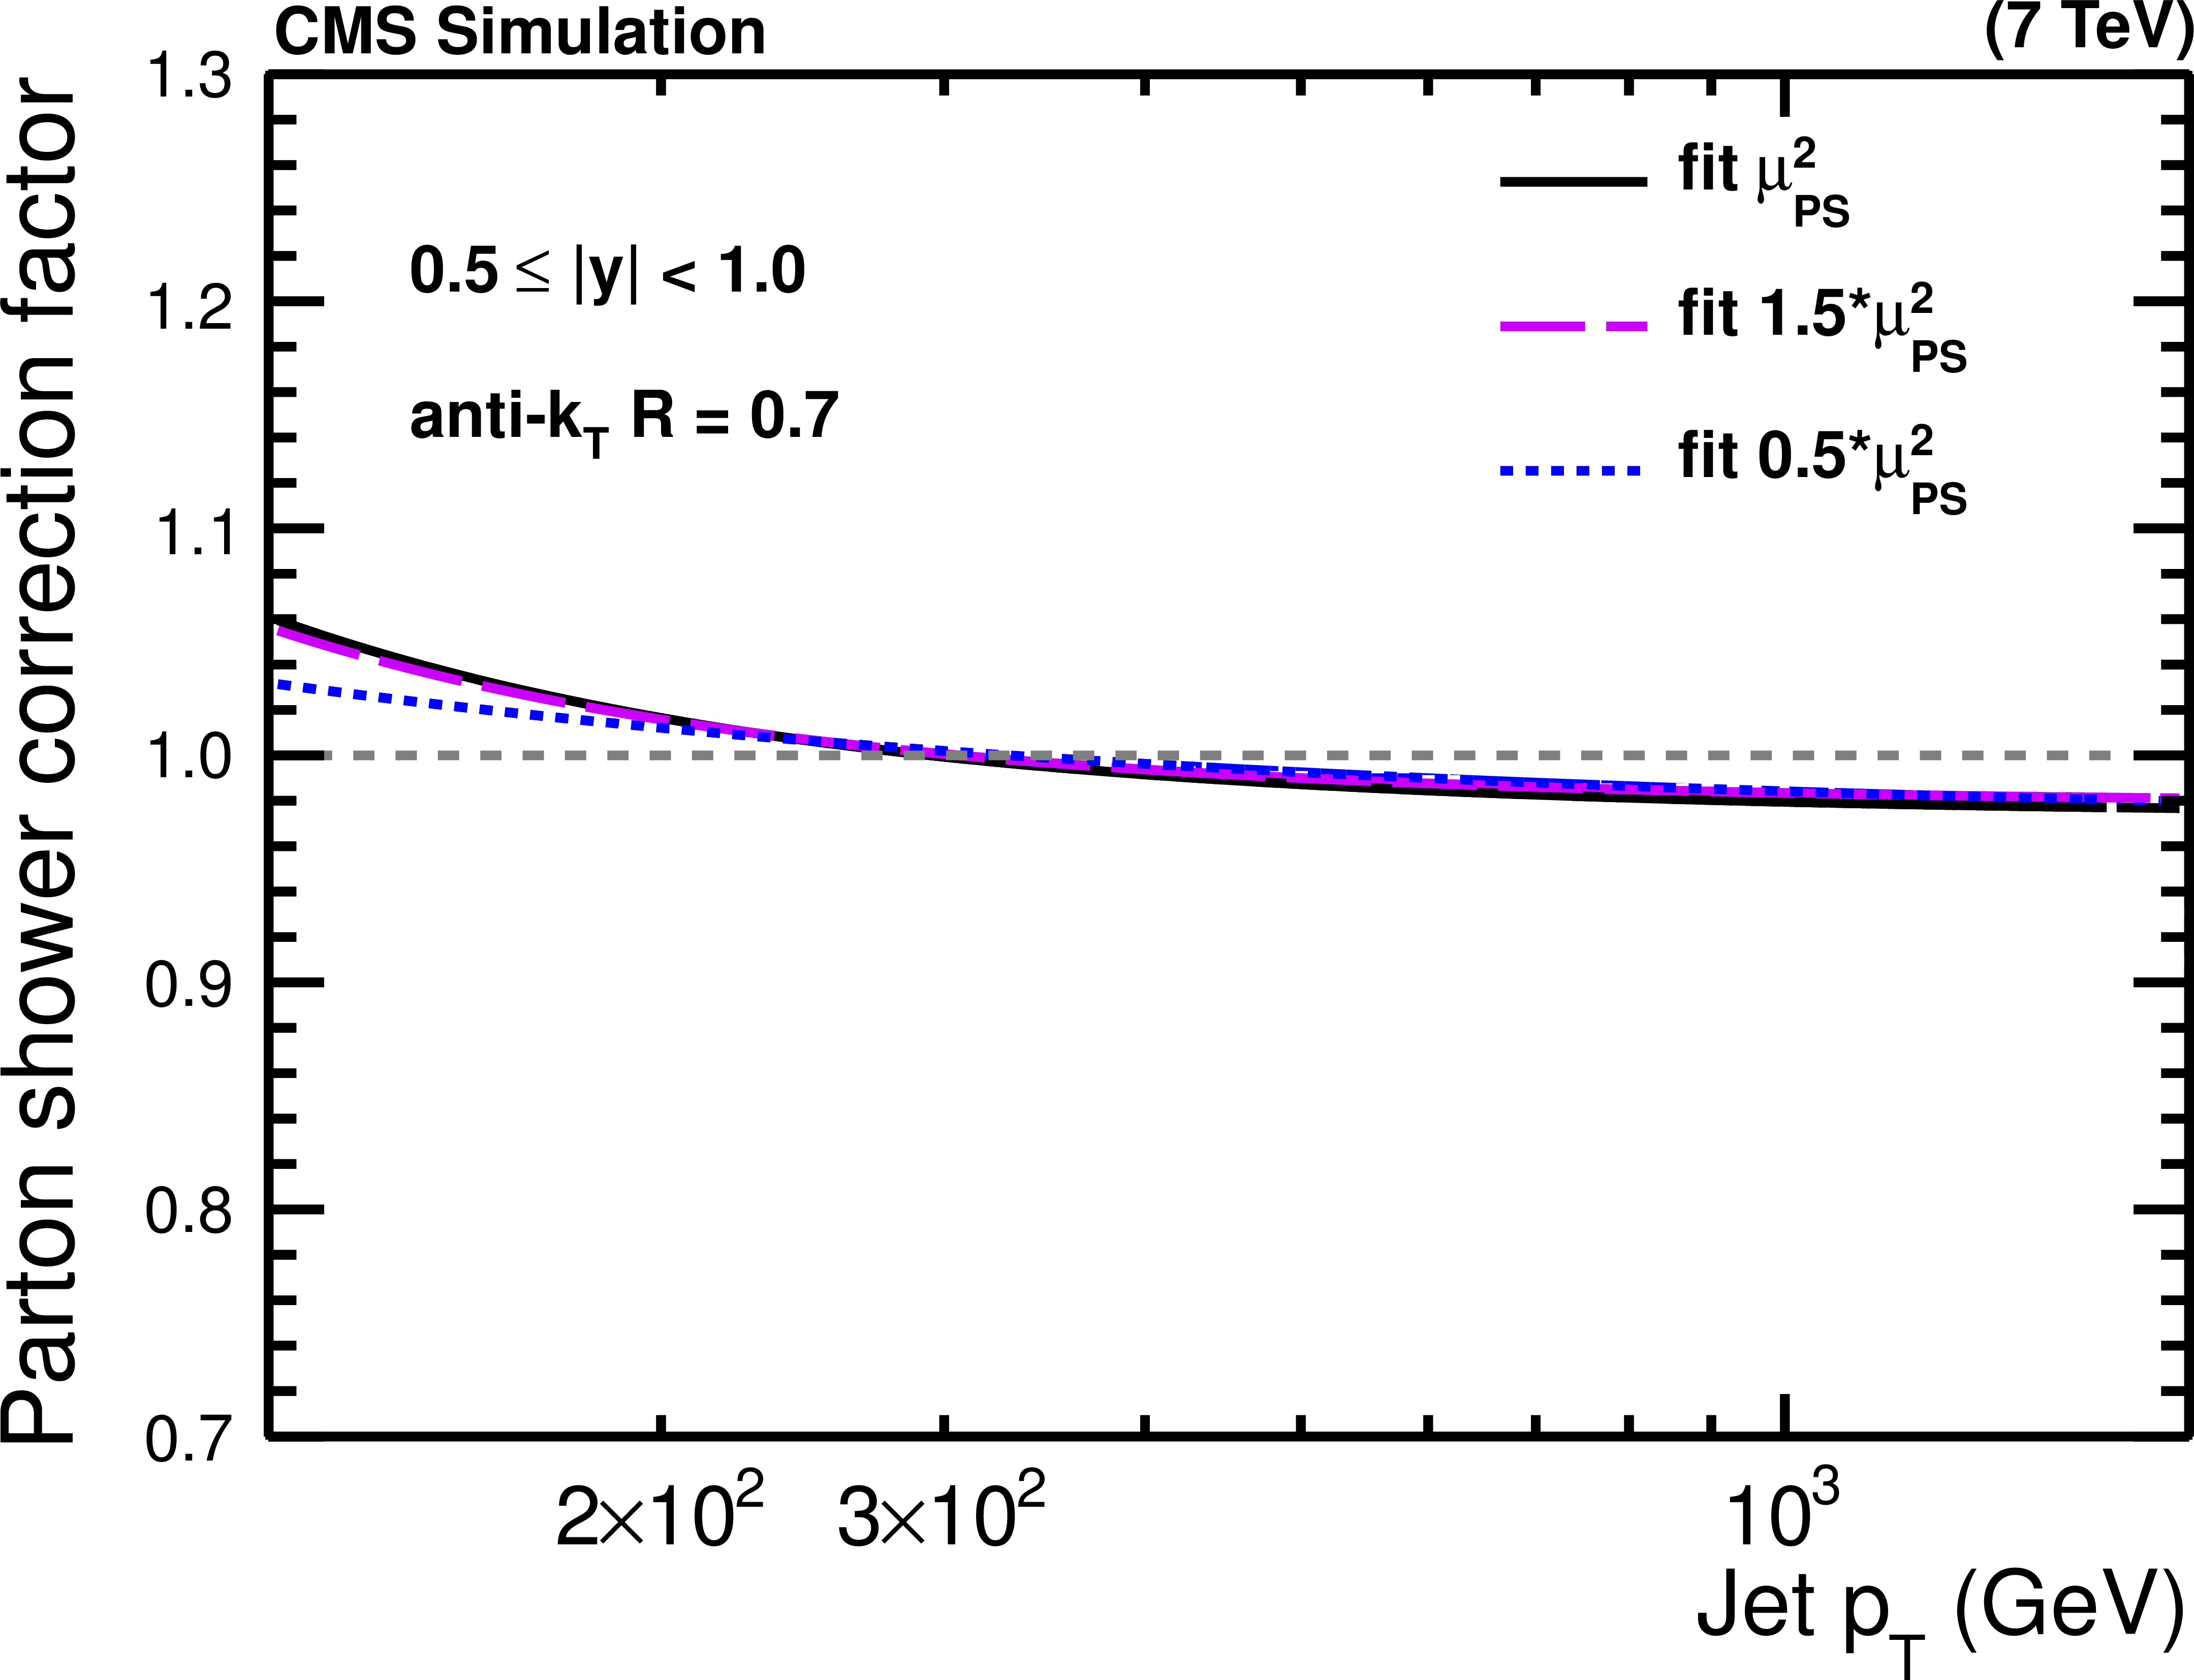
Figure 3-b:
PS corrections for the five regions in $ { {| y | }} $ obtained from POWHEG using PYTHIA-6 for showering for different upper scale limits of the parton shower evolution in PYTHIA-6 tune Z2*. The curves parameterize the correction factors as a function of the jet $ {p_{\mathrm {T}}} $. |

png pdf |
Figure 3-c:
PS corrections for the five regions in $ { {| y | }} $ obtained from POWHEG using PYTHIA-6 for showering for different upper scale limits of the parton shower evolution in PYTHIA-6 tune Z2*. The curves parameterize the correction factors as a function of the jet $ {p_{\mathrm {T}}} $. |
png pdf |
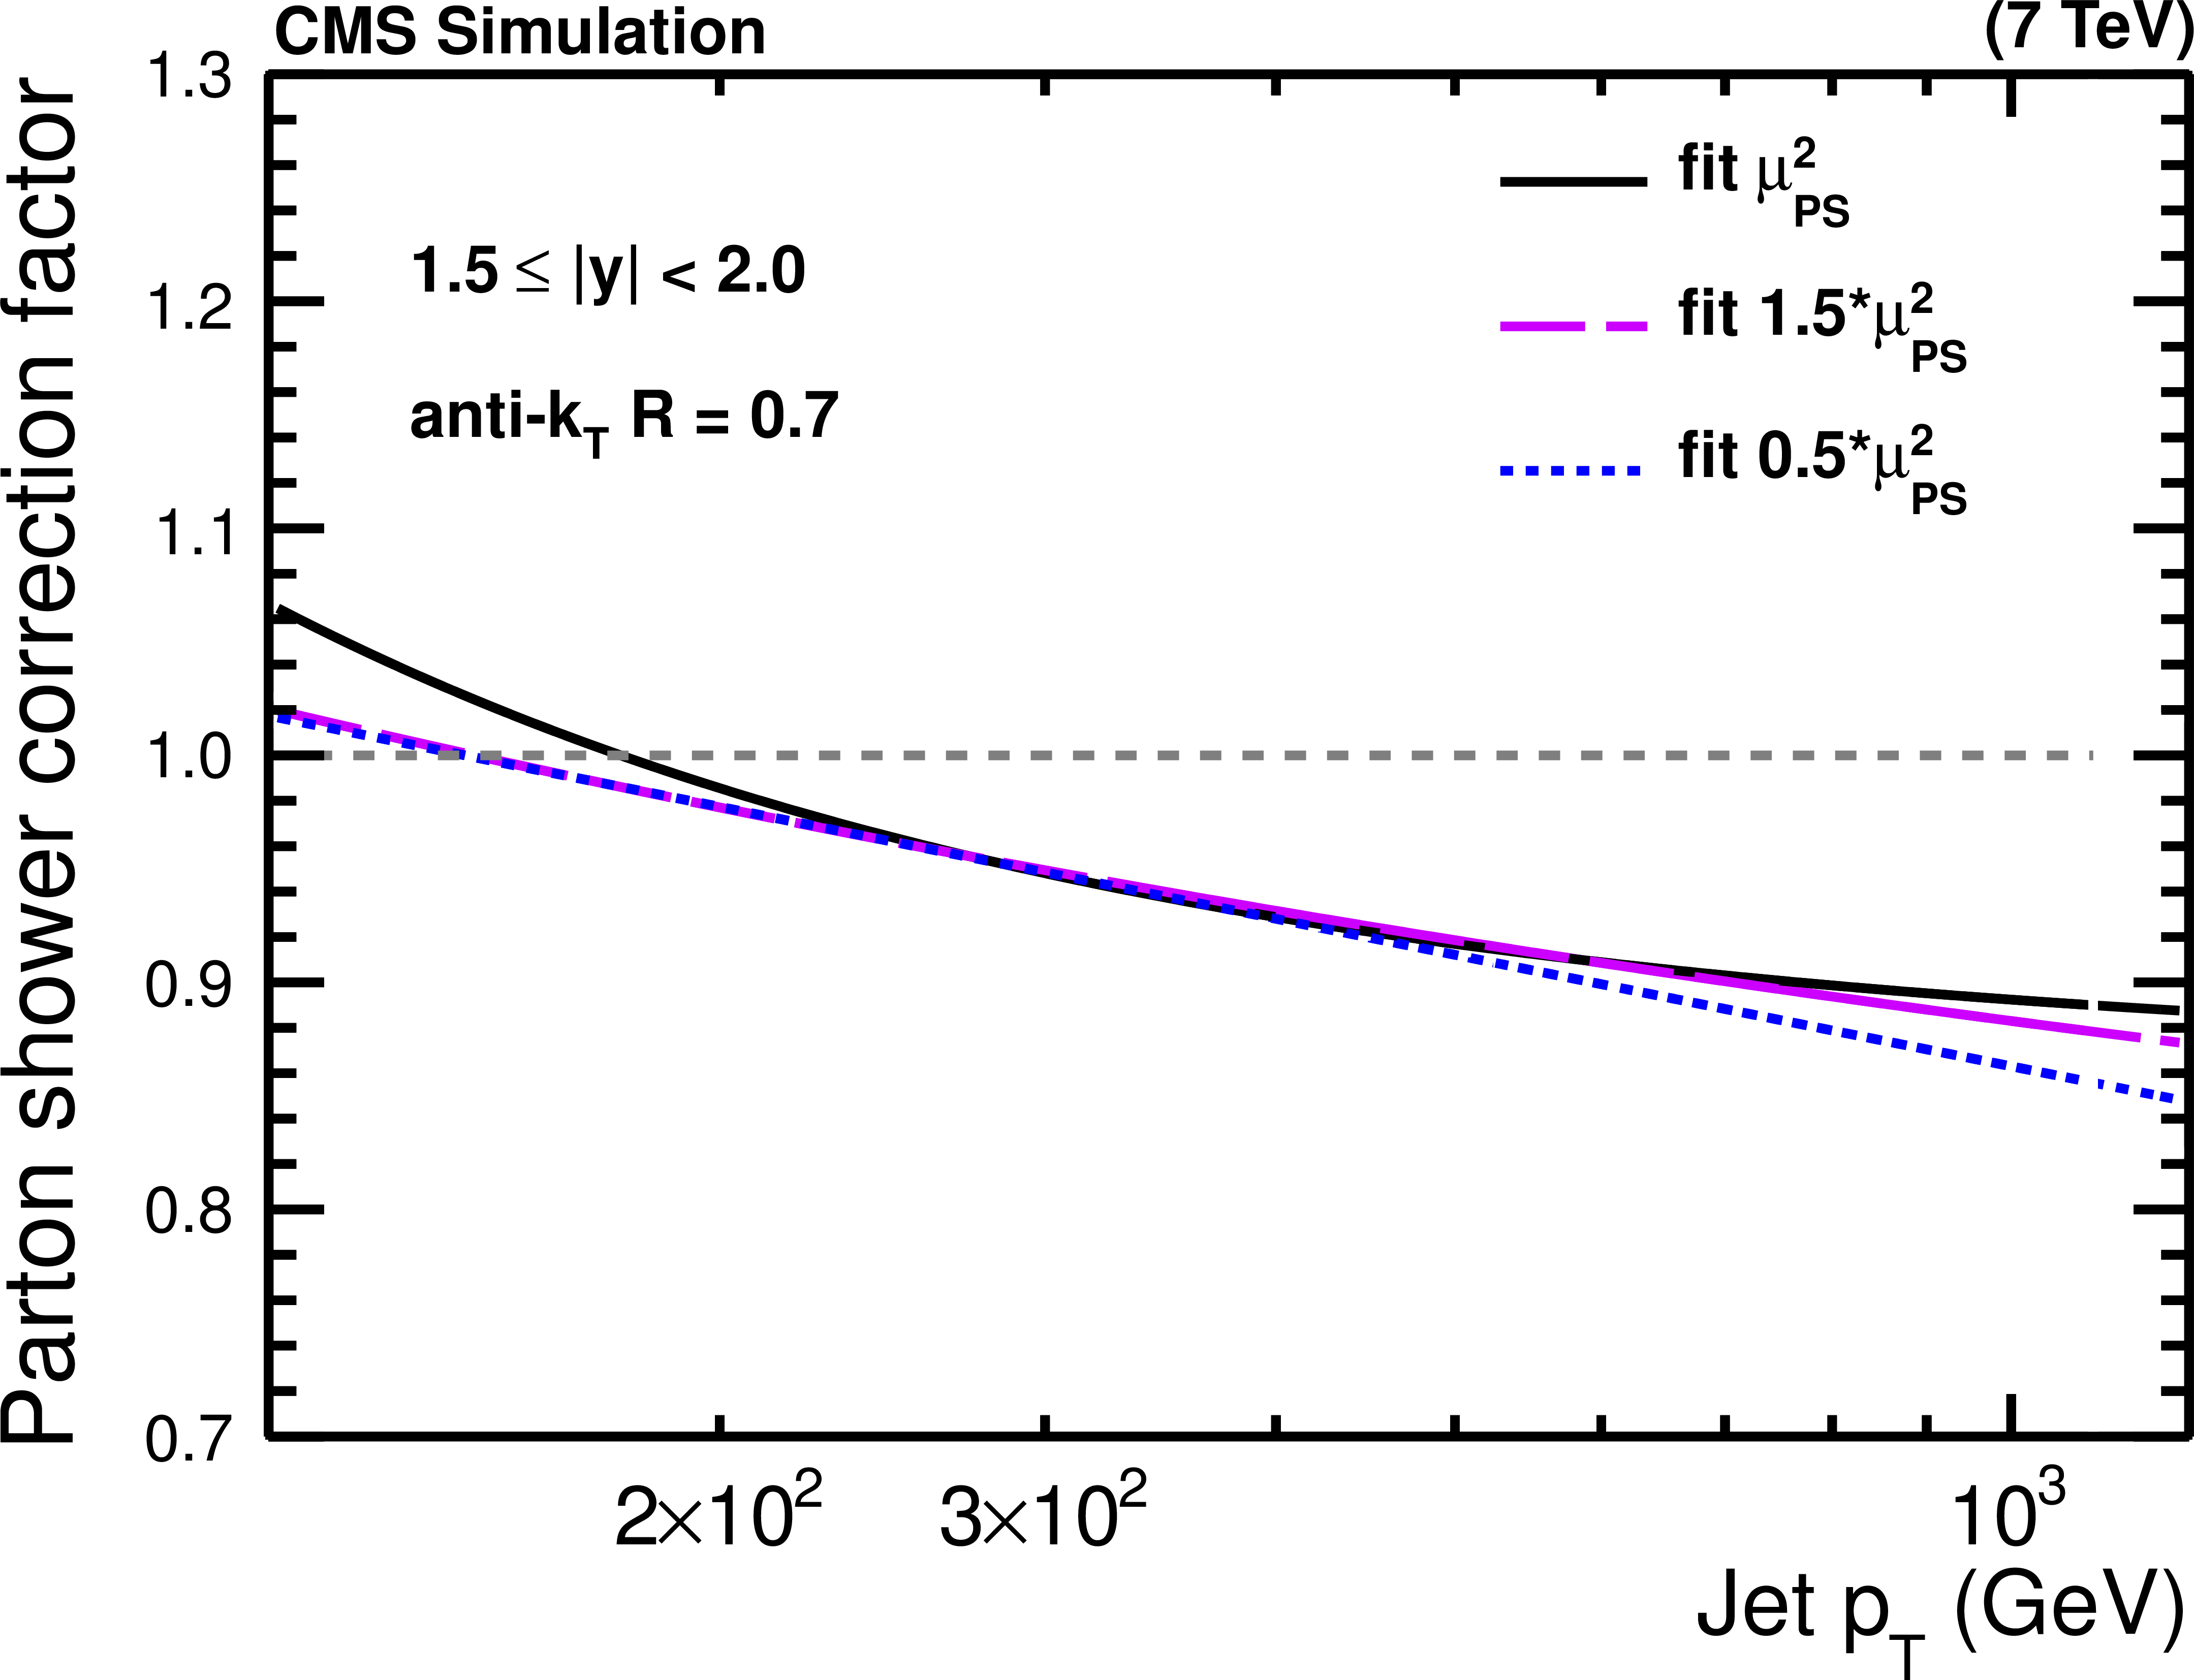
Figure 3-d:
PS corrections for the five regions in $ { {| y | }} $ obtained from POWHEG using PYTHIA-6 for showering for different upper scale limits of the parton shower evolution in PYTHIA-6 tune Z2*. The curves parameterize the correction factors as a function of the jet $ {p_{\mathrm {T}}} $. |
png pdf |
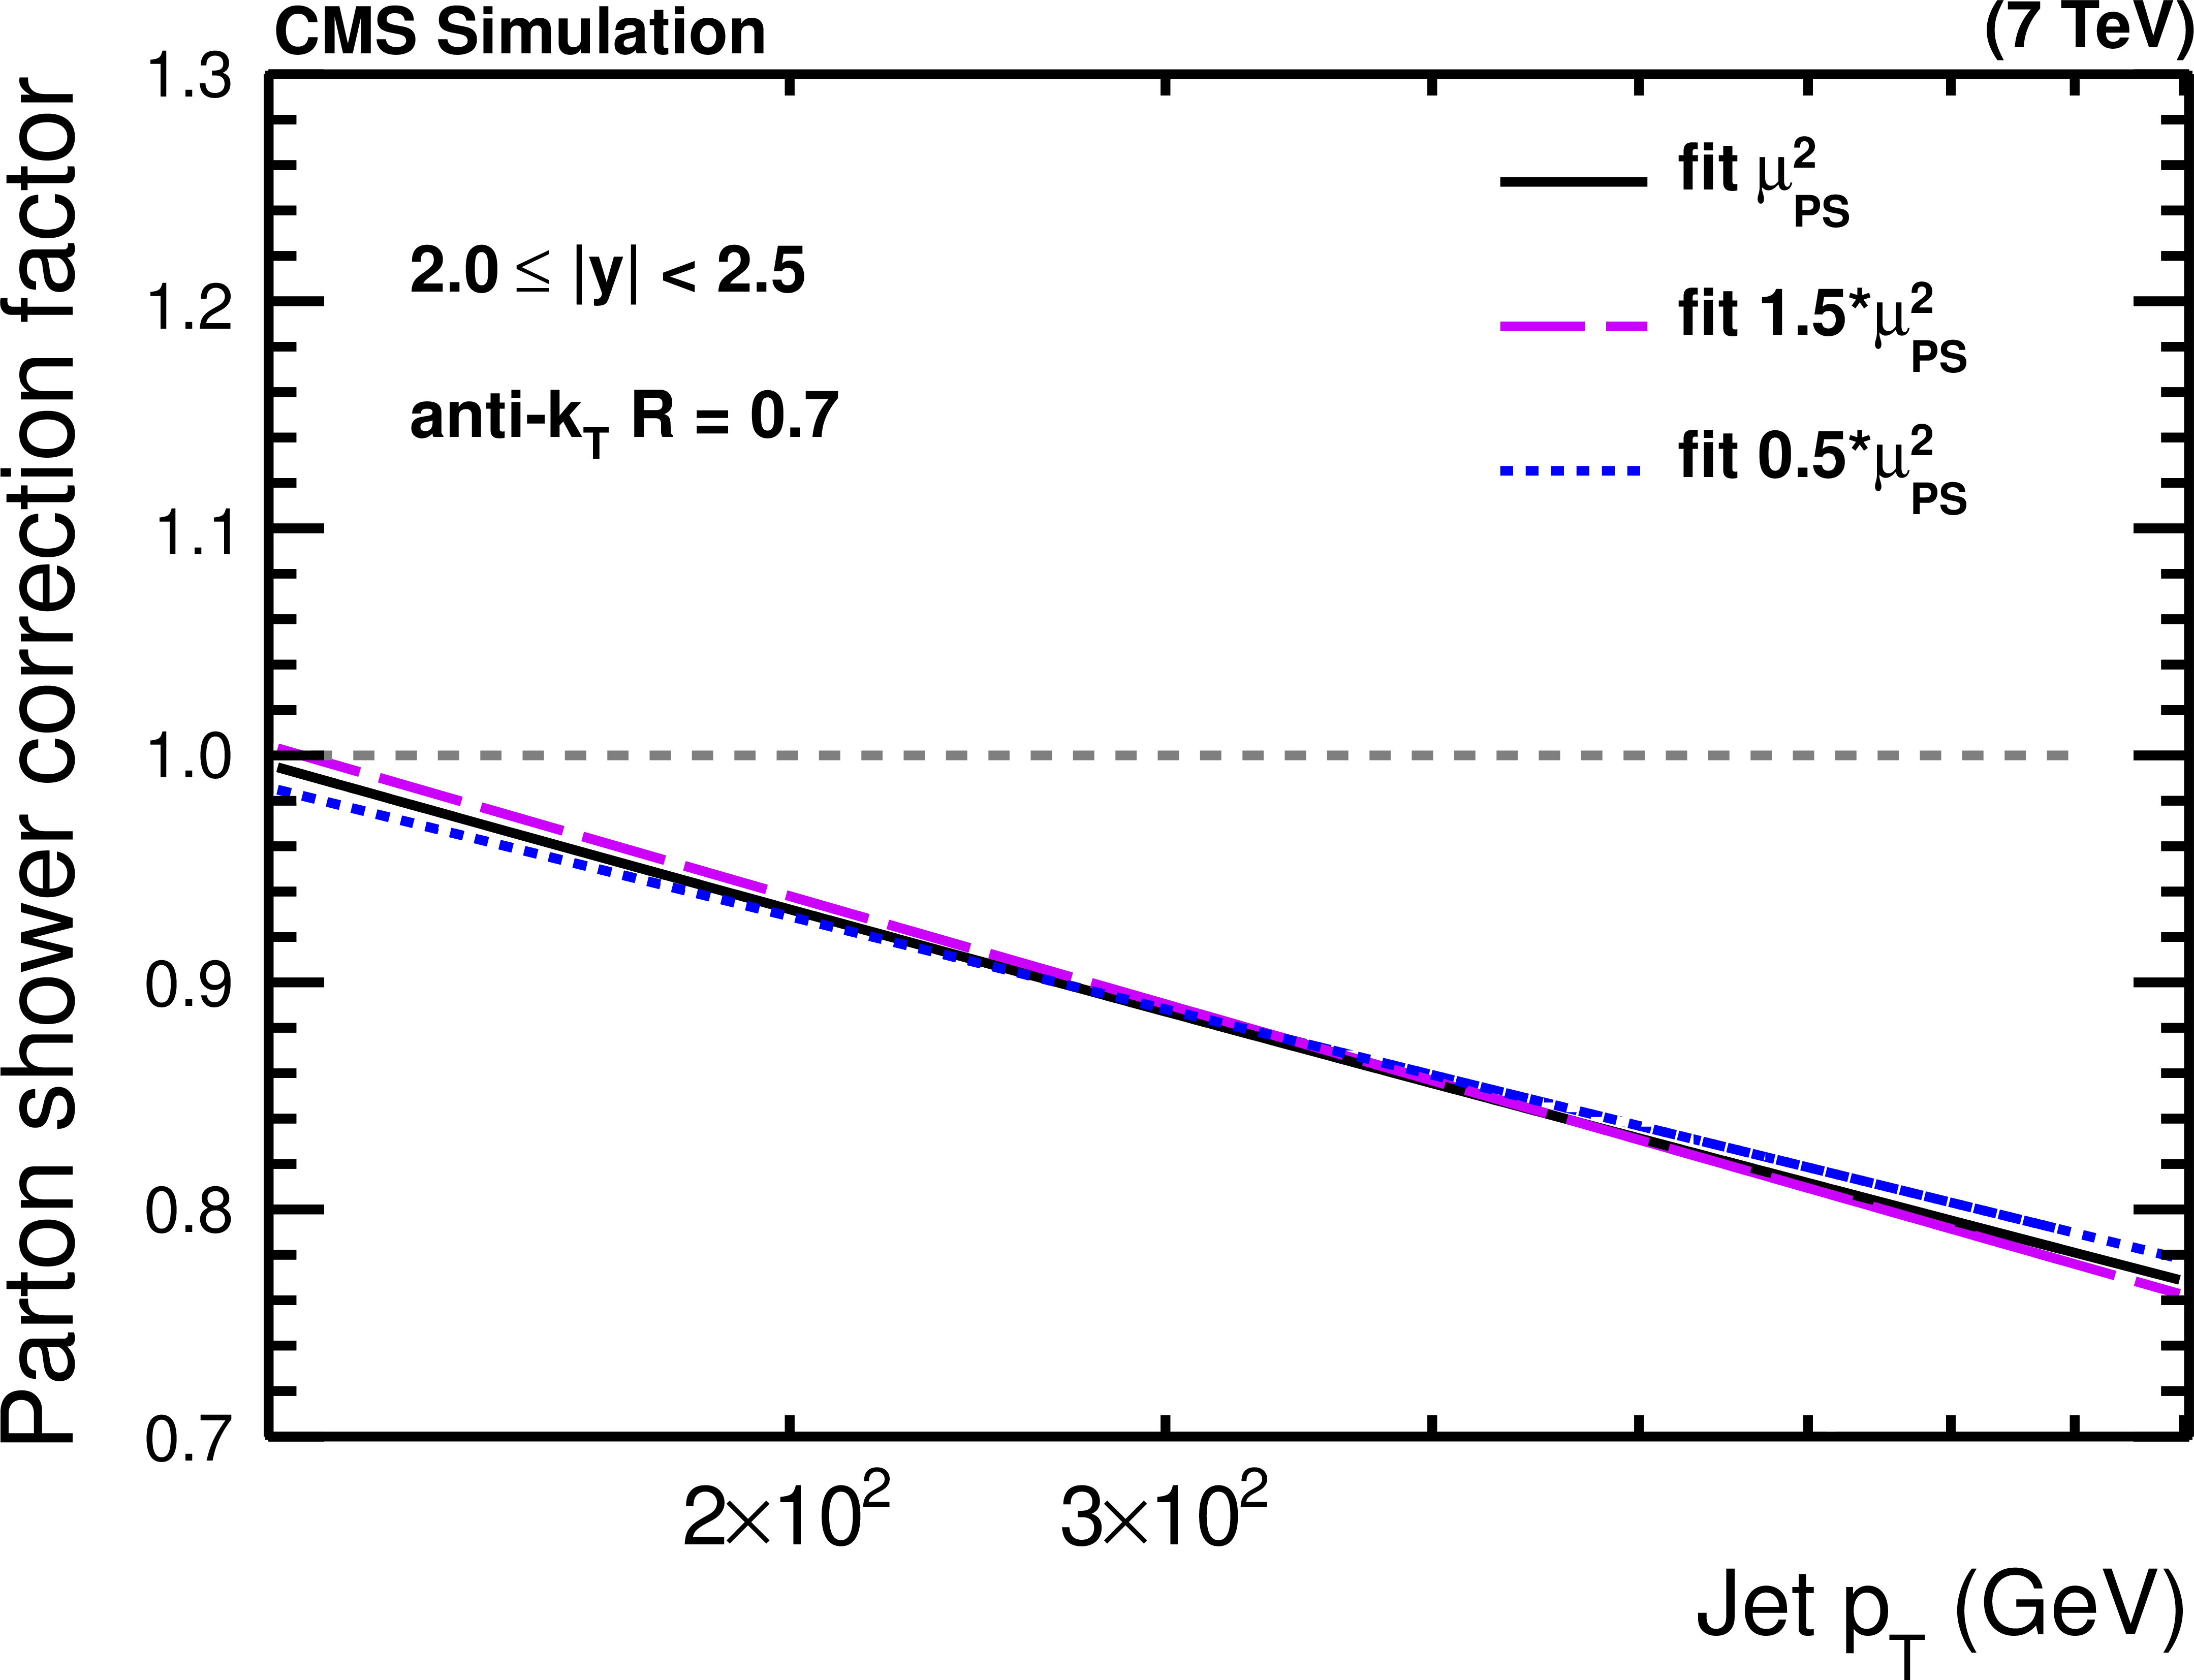
Figure 3-e:
PS corrections for the five regions in $ { {| y | }} $ obtained from POWHEG using PYTHIA-6 for showering for different upper scale limits of the parton shower evolution in PYTHIA-6 tune Z2*. The curves parameterize the correction factors as a function of the jet $ {p_{\mathrm {T}}} $. |

png pdf |
Figure 4-a:
NP correction (a) obtained from the envelope of the predictions of PYTHIA-6 tune Z2, HERWIG++ tune 2.3, and POWHEG + PYTHIA-6 with the tunes P11 and Z2*, PS correction (b) obtained from the average of the predictions of POWHEG + PYTHIA-6 tune Z2* with scale factor variation, and combined correction (c), defined as the product of the NP and PS correction, for the five regions in $ { {| y | }} $. |

png pdf |
Figure 4-b:
NP correction (a) obtained from the envelope of the predictions of PYTHIA-6 tune Z2, HERWIG++ tune 2.3, and POWHEG + PYTHIA-6 with the tunes P11 and Z2*, PS correction (b) obtained from the average of the predictions of POWHEG + PYTHIA-6 tune Z2* with scale factor variation, and combined correction (c), defined as the product of the NP and PS correction, for the five regions in $ { {| y | }} $. |

png pdf |
Figure 4-c:
NP correction (a) obtained from the envelope of the predictions of PYTHIA-6 tune Z2, HERWIG++ tune 2.3, and POWHEG + PYTHIA-6 with the tunes P11 and Z2*, PS correction (b) obtained from the average of the predictions of POWHEG + PYTHIA-6 tune Z2* with scale factor variation, and combined correction (c), defined as the product of the NP and PS correction, for the five regions in $ { {| y | }} $. |

png pdf |
Figure 5-a:
Ratio of the inclusive jet cross section to theoretical predictions using the ABM11-NLO PDF set for the five rapidity bins, where the ${\alpha _S(M_ {\mathrm {Z}})} $ value is varied in the range 0.110--0.130 in steps of 0.001. The error bars correspond to the total uncertainty. |

png pdf |
Figure 5-b:
Ratio of the inclusive jet cross section to theoretical predictions using the ABM11-NLO PDF set for the five rapidity bins, where the ${\alpha _S(M_ {\mathrm {Z}})} $ value is varied in the range 0.110--0.130 in steps of 0.001. The error bars correspond to the total uncertainty. |

png pdf |
Figure 5-c:
Ratio of the inclusive jet cross section to theoretical predictions using the ABM11-NLO PDF set for the five rapidity bins, where the ${\alpha _S(M_ {\mathrm {Z}})} $ value is varied in the range 0.110--0.130 in steps of 0.001. The error bars correspond to the total uncertainty. |

png pdf |
Figure 5-d:
Ratio of the inclusive jet cross section to theoretical predictions using the ABM11-NLO PDF set for the five rapidity bins, where the ${\alpha _S(M_ {\mathrm {Z}})} $ value is varied in the range 0.110--0.130 in steps of 0.001. The error bars correspond to the total uncertainty. |

png pdf |
Figure 5-e:
Ratio of the inclusive jet cross section to theoretical predictions using the ABM11-NLO PDF set for the five rapidity bins, where the ${\alpha _S(M_ {\mathrm {Z}})} $ value is varied in the range 0.110--0.130 in steps of 0.001. The error bars correspond to the total uncertainty. |
png pdf |
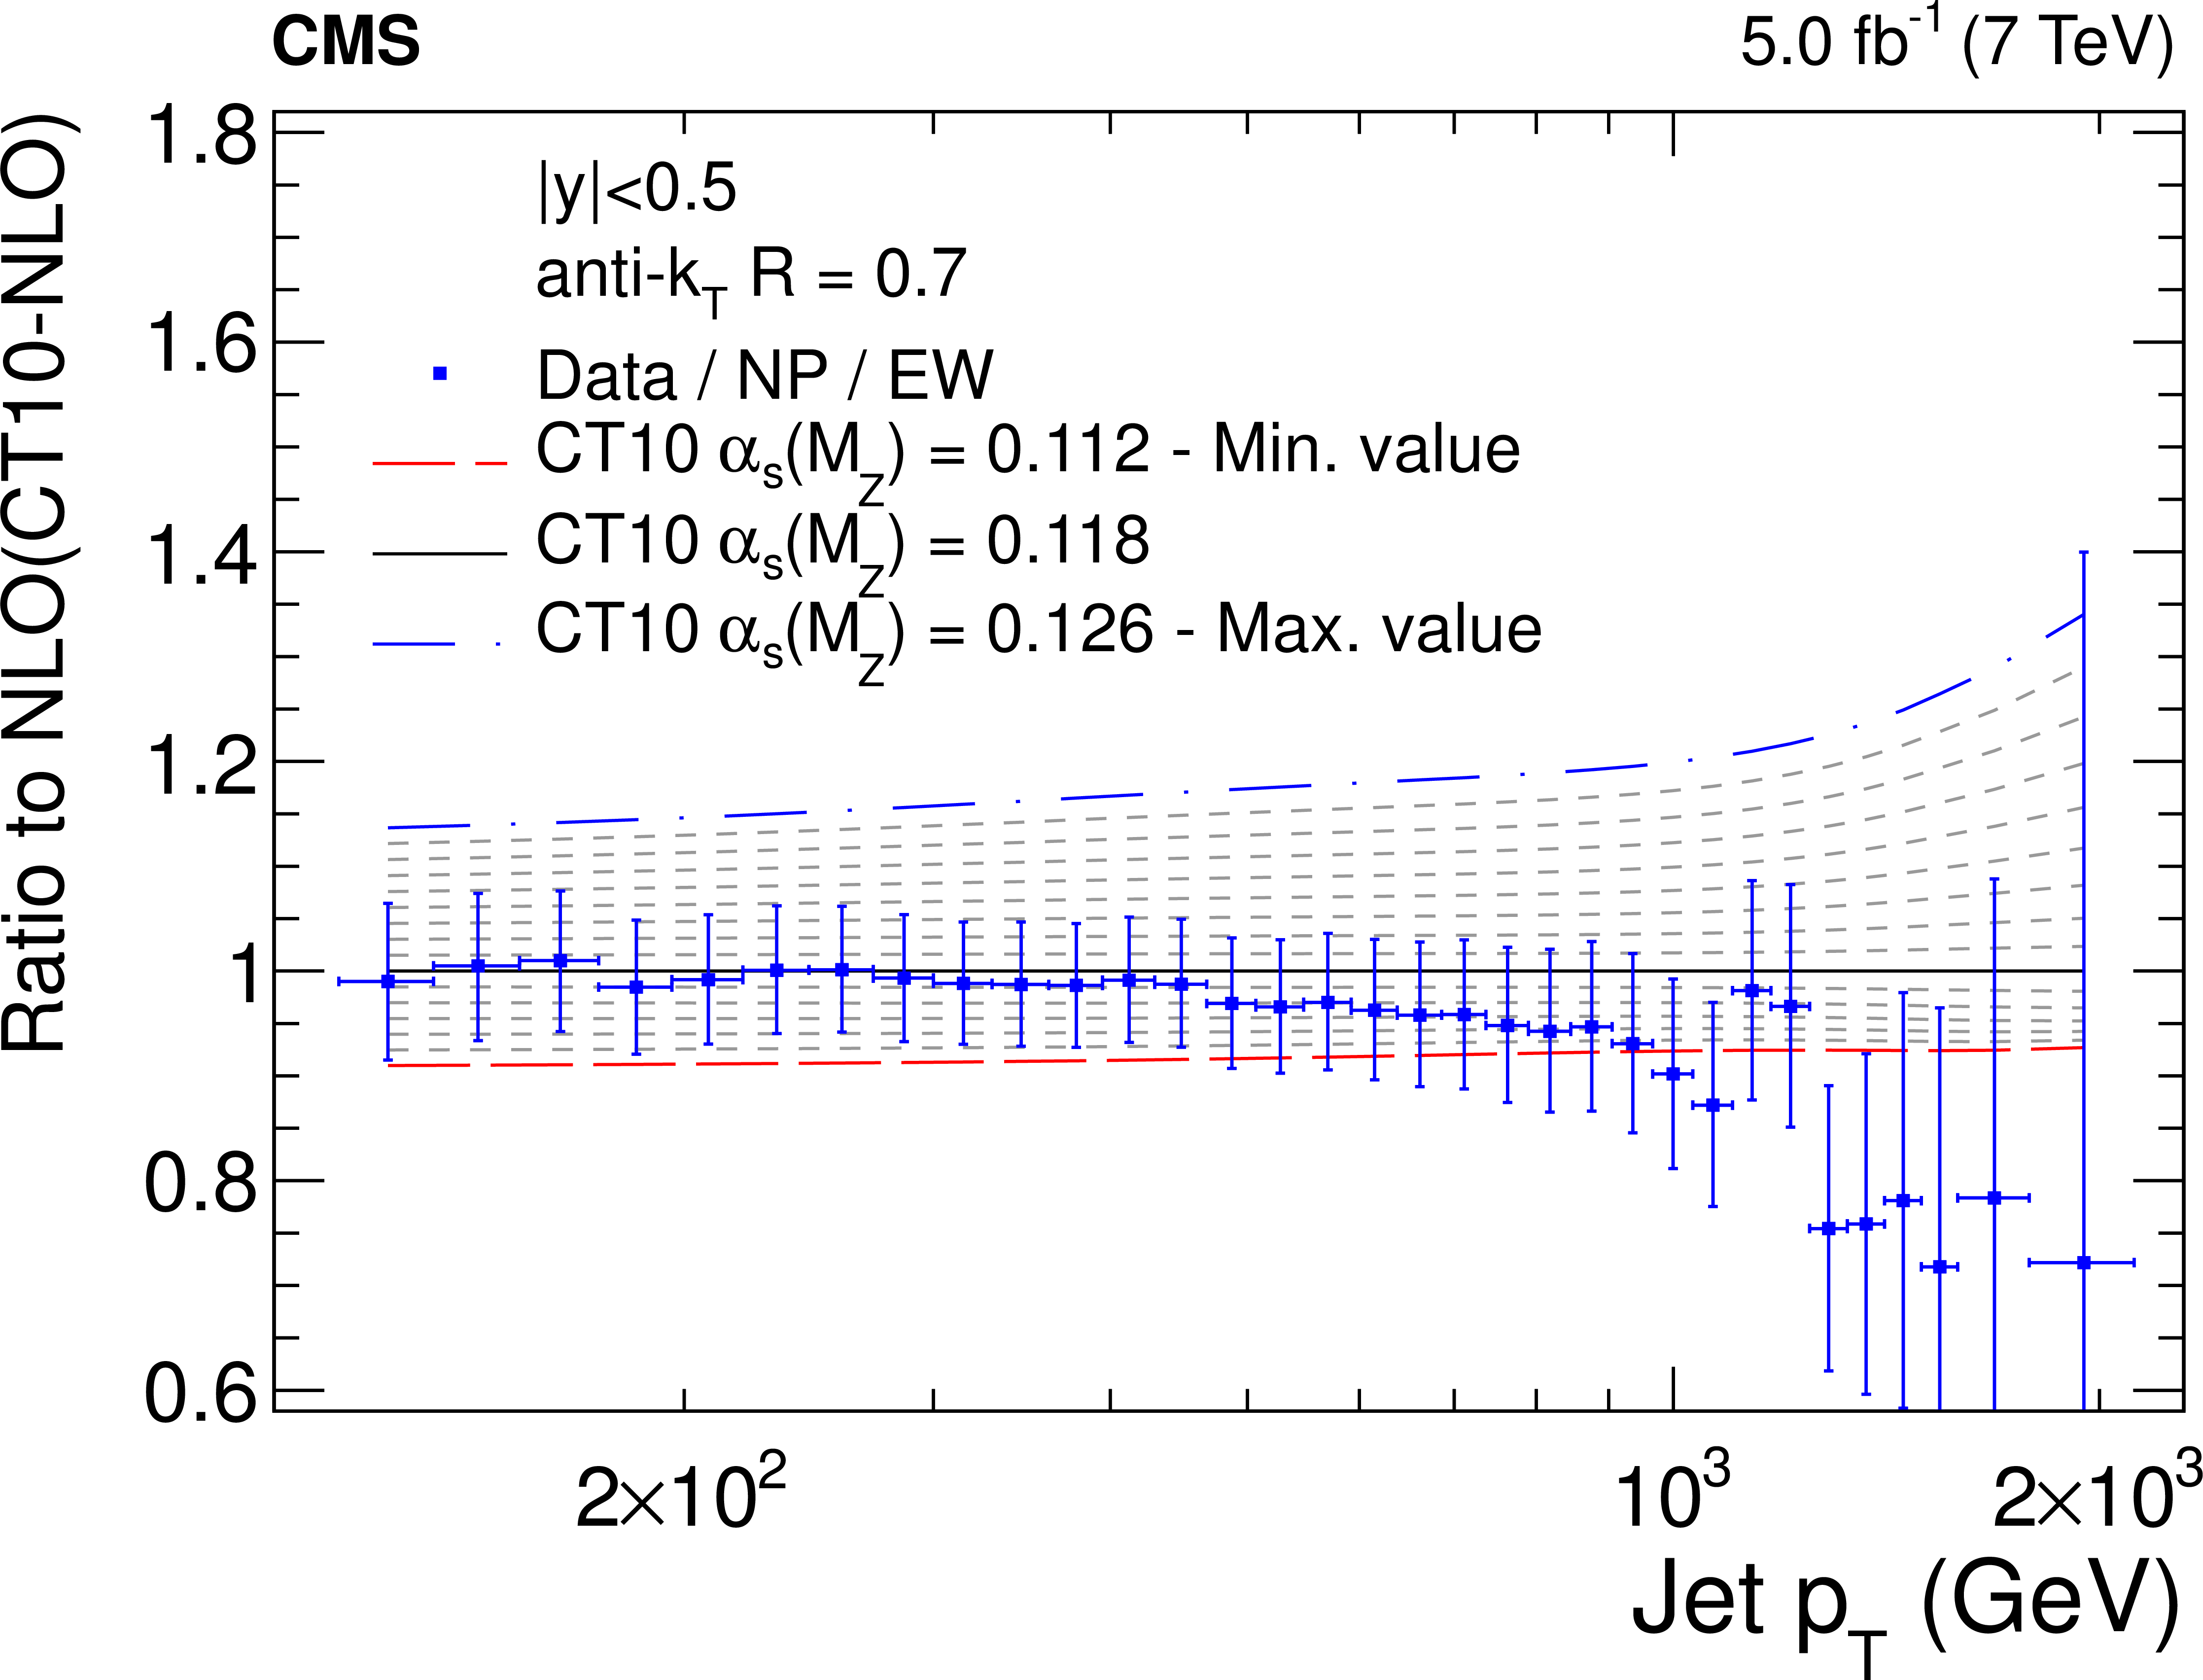
Figure 6-a:
Ratio of the inclusive jet cross section to theoretical predictions using the CT10-NLO PDF set for the five rapidity bins, where the ${\alpha _S(M_ {\mathrm {Z}})} $ value is varied in the range 0.112--0.126 in steps of 0.001. The error bars correspond to the total uncertainty. |

png pdf |
Figure 6-b:
Ratio of the inclusive jet cross section to theoretical predictions using the CT10-NLO PDF set for the five rapidity bins, where the ${\alpha _S(M_ {\mathrm {Z}})} $ value is varied in the range 0.112--0.126 in steps of 0.001. The error bars correspond to the total uncertainty. |

png pdf |
Figure 6-c:
Ratio of the inclusive jet cross section to theoretical predictions using the CT10-NLO PDF set for the five rapidity bins, where the ${\alpha _S(M_ {\mathrm {Z}})} $ value is varied in the range 0.112--0.126 in steps of 0.001. The error bars correspond to the total uncertainty. |
png pdf |
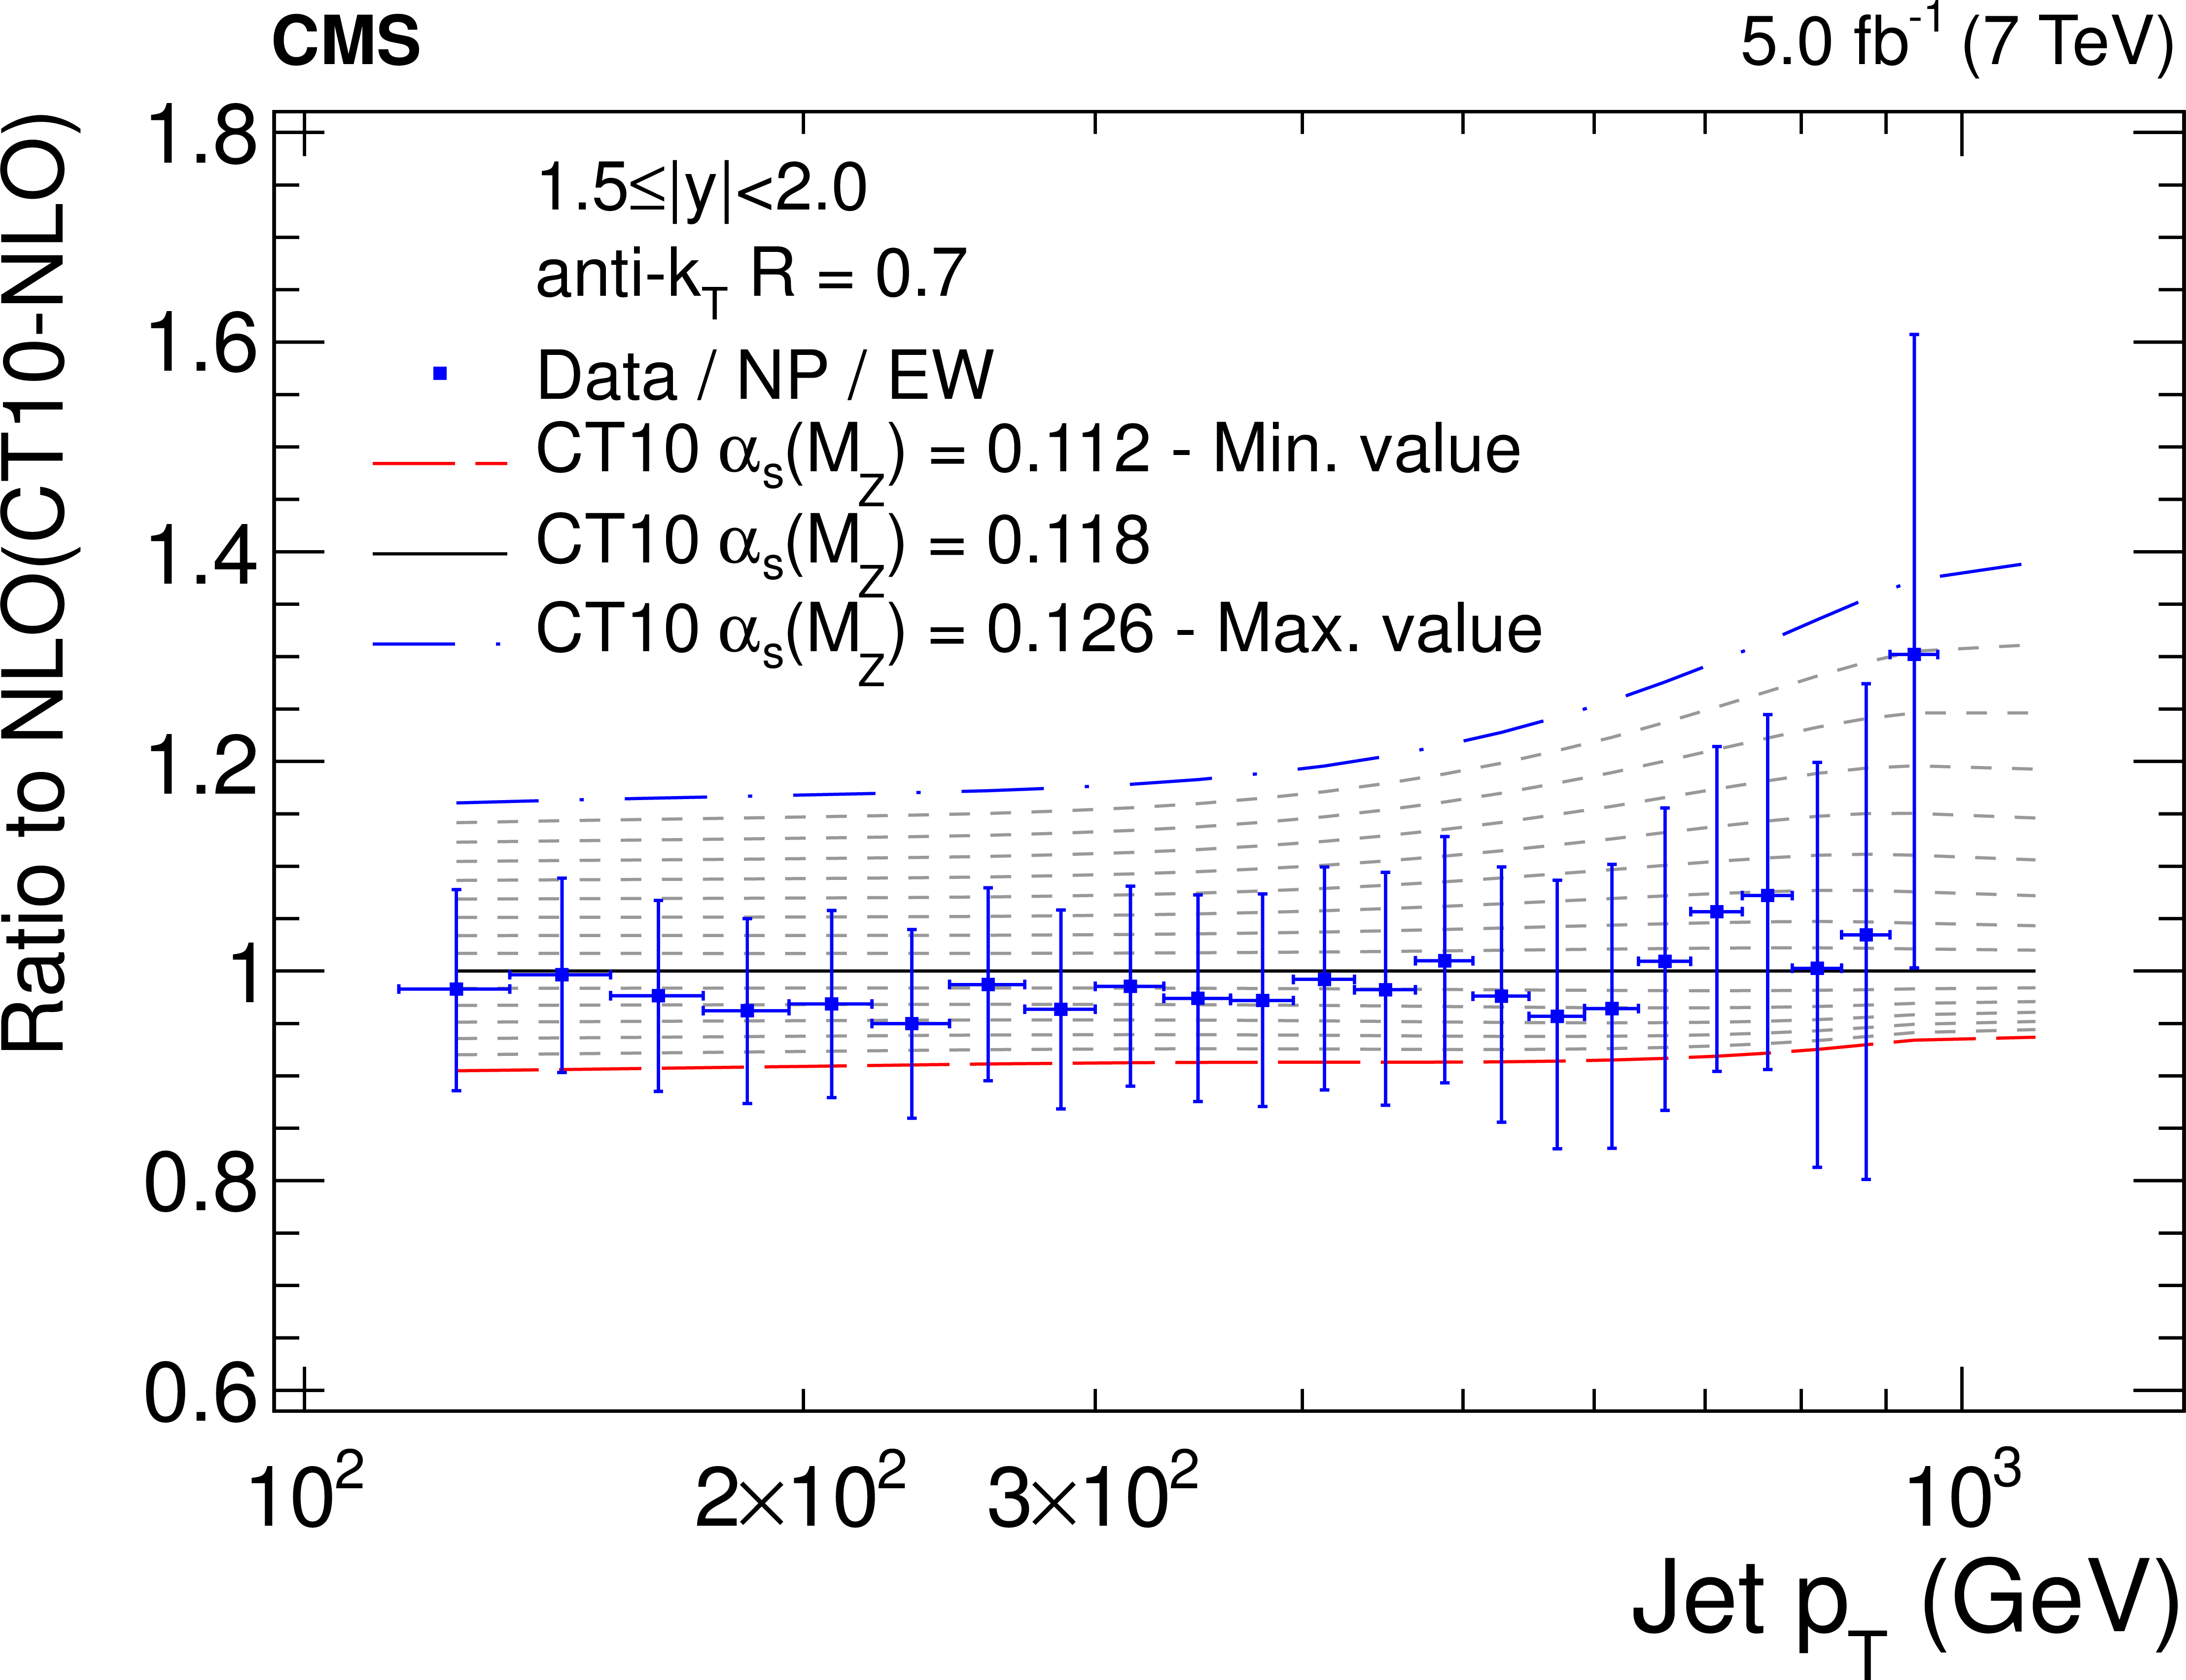
Figure 6-d:
Ratio of the inclusive jet cross section to theoretical predictions using the CT10-NLO PDF set for the five rapidity bins, where the ${\alpha _S(M_ {\mathrm {Z}})} $ value is varied in the range 0.112--0.126 in steps of 0.001. The error bars correspond to the total uncertainty. |

png pdf |
Figure 6-e:
Ratio of the inclusive jet cross section to theoretical predictions using the CT10-NLO PDF set for the five rapidity bins, where the ${\alpha _S(M_ {\mathrm {Z}})} $ value is varied in the range 0.112--0.126 in steps of 0.001. The error bars correspond to the total uncertainty. |

png pdf |
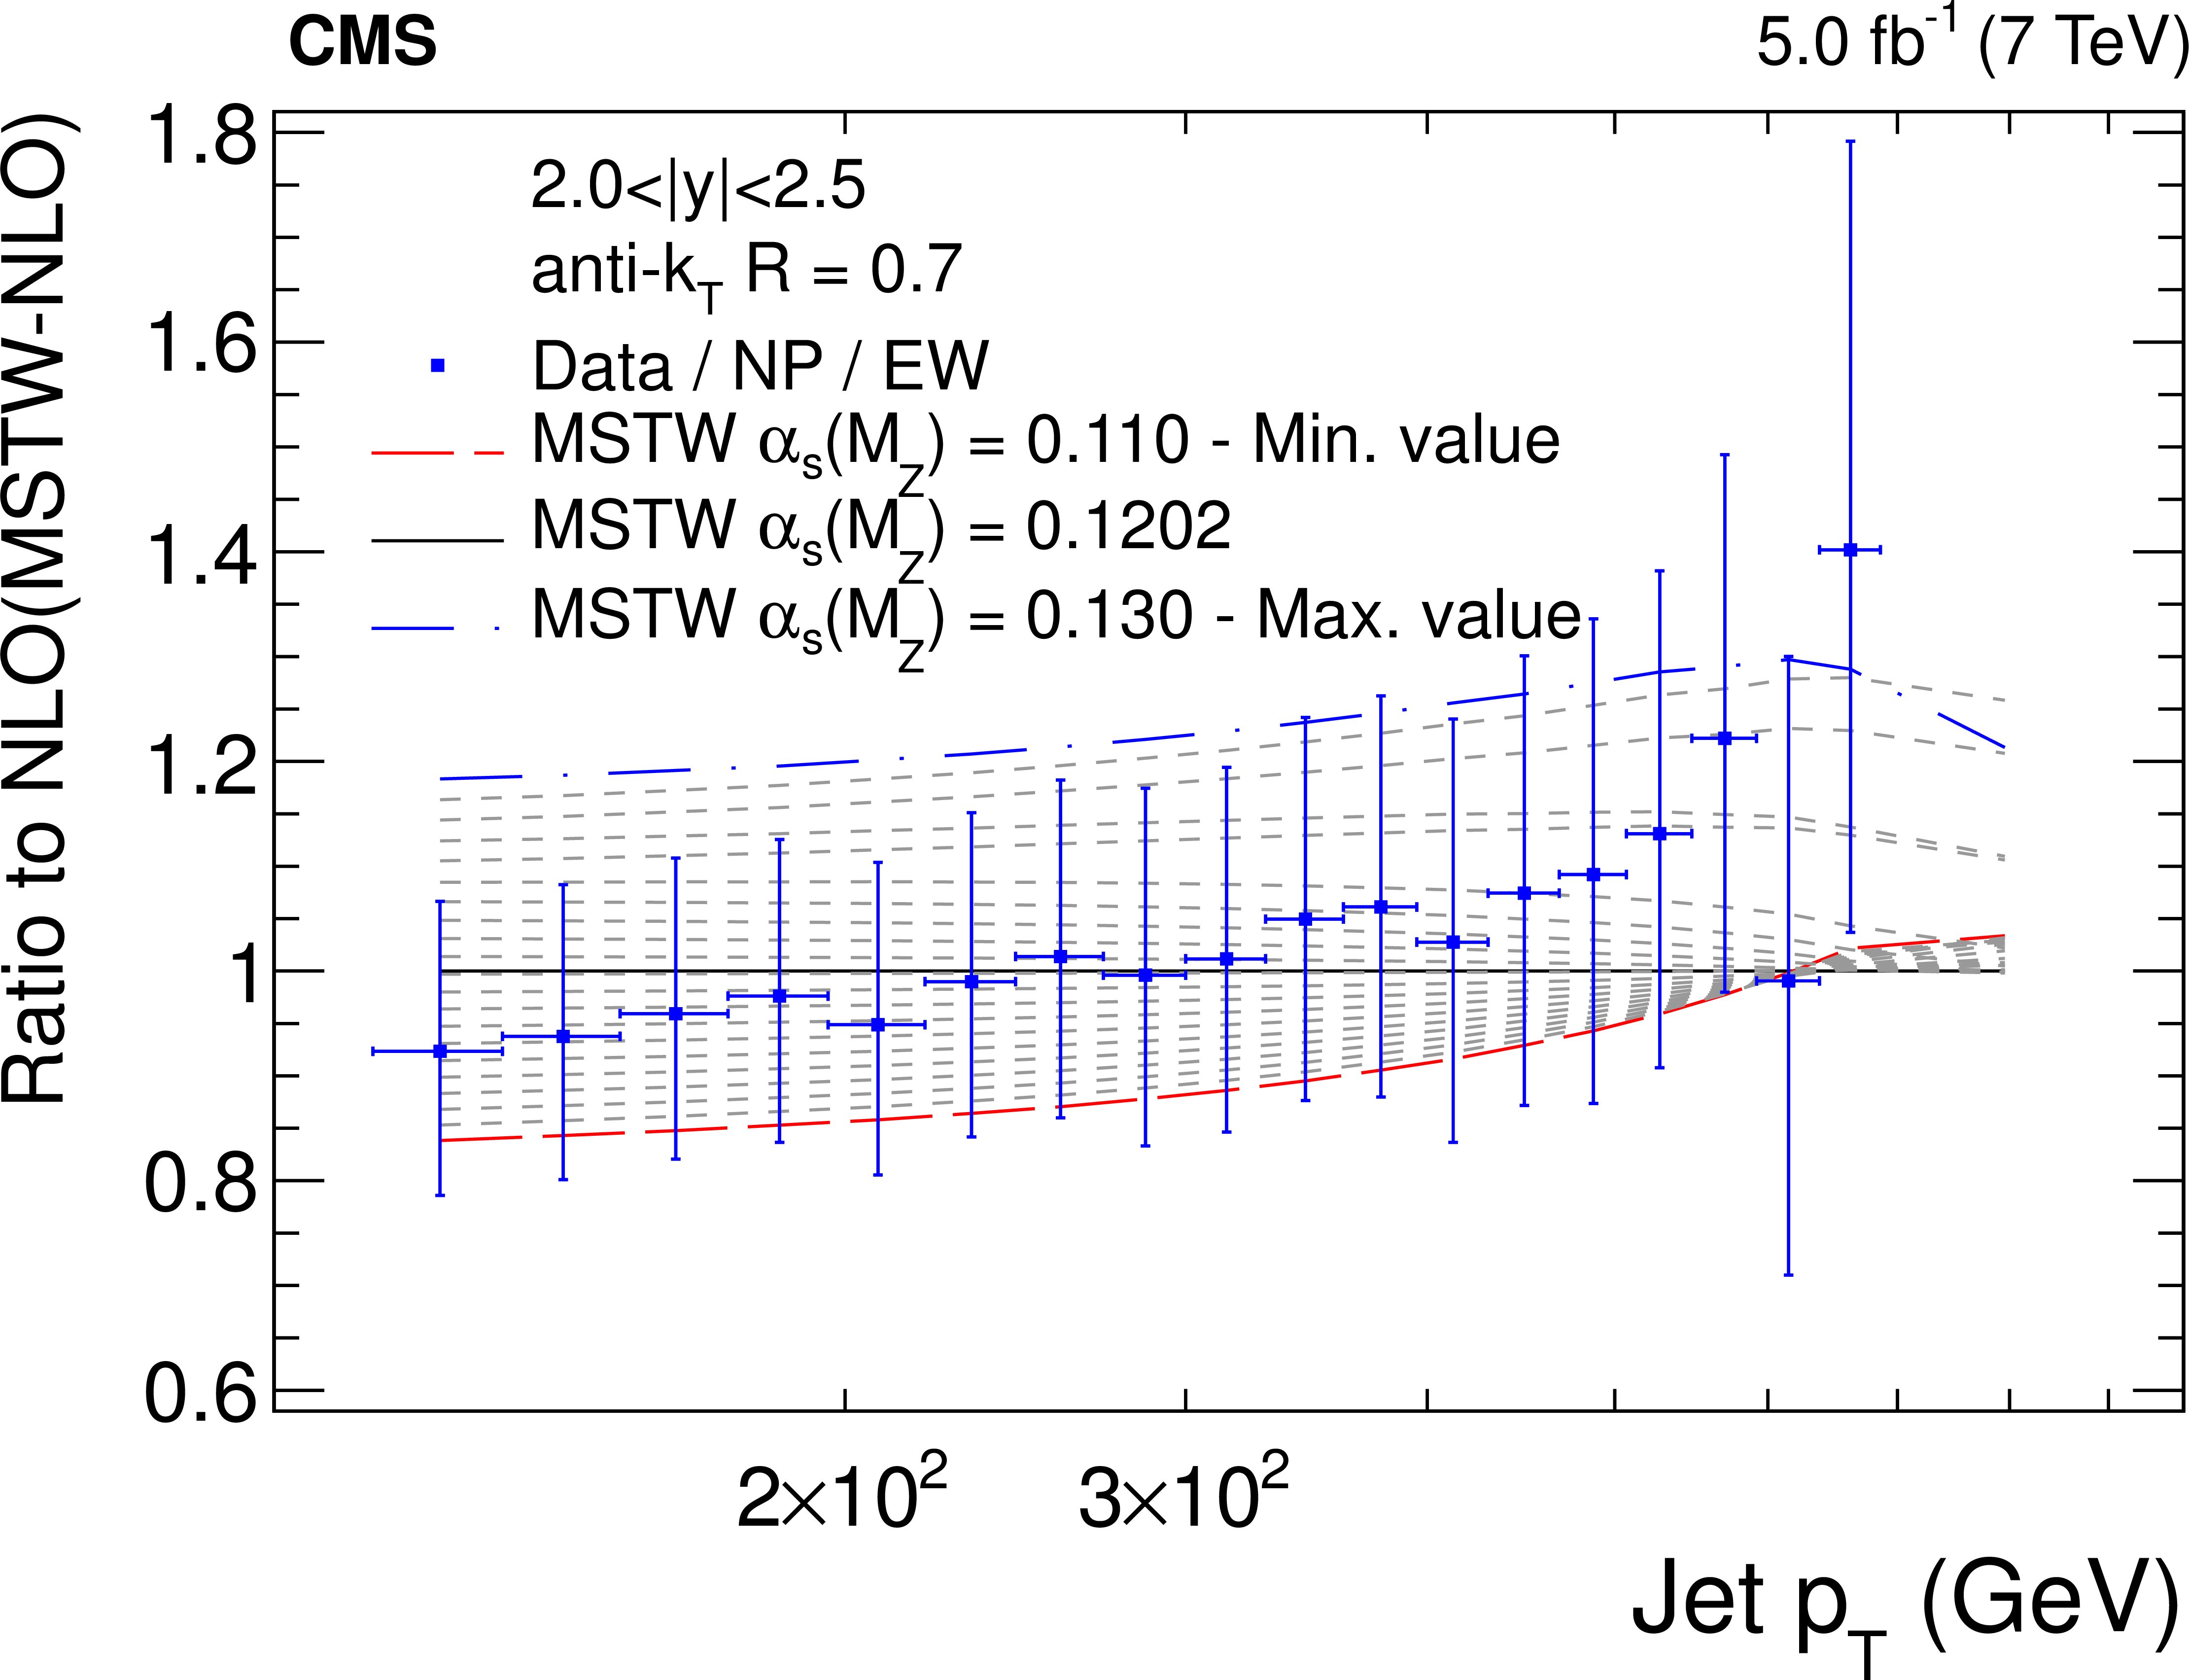
Figure 7-a:
Ratio of the inclusive jet cross section to theoretical predictions using the MSTW2008-NLO PDF set for the five rapidity bins, where the ${\alpha _S(M_ {\mathrm {Z}})} $ value is varied in the range 0.110--0.130 in steps of 0.001. The error bars correspond to the total uncertainty. |

png pdf |
Figure 7-b:
Ratio of the inclusive jet cross section to theoretical predictions using the MSTW2008-NLO PDF set for the five rapidity bins, where the ${\alpha _S(M_ {\mathrm {Z}})} $ value is varied in the range 0.110--0.130 in steps of 0.001. The error bars correspond to the total uncertainty. |

png pdf |
Figure 7-c:
Ratio of the inclusive jet cross section to theoretical predictions using the MSTW2008-NLO PDF set for the five rapidity bins, where the ${\alpha _S(M_ {\mathrm {Z}})} $ value is varied in the range 0.110--0.130 in steps of 0.001. The error bars correspond to the total uncertainty. |

png pdf |
Figure 7-d:
Ratio of the inclusive jet cross section to theoretical predictions using the MSTW2008-NLO PDF set for the five rapidity bins, where the ${\alpha _S(M_ {\mathrm {Z}})} $ value is varied in the range 0.110--0.130 in steps of 0.001. The error bars correspond to the total uncertainty. |
png pdf |
Figure 7-e:
Ratio of the inclusive jet cross section to theoretical predictions using the MSTW2008-NLO PDF set for the five rapidity bins, where the ${\alpha _S(M_ {\mathrm {Z}})} $ value is varied in the range 0.110--0.130 in steps of 0.001. The error bars correspond to the total uncertainty. |

png pdf |
Figure 8-a:
Ratio of the inclusive jet cross section to theoretical predictions using the NNPDF2.1-NLO PDF set for the five rapidity bins, where the ${\alpha _S(M_ {\mathrm {Z}})} $ value is varied in the range 0.116--0.122 in steps of 0.001. The error bars correspond to the total uncertainty. |

png pdf |
Figure 8-b:
Ratio of the inclusive jet cross section to theoretical predictions using the NNPDF2.1-NLO PDF set for the five rapidity bins, where the ${\alpha _S(M_ {\mathrm {Z}})} $ value is varied in the range 0.116--0.122 in steps of 0.001. The error bars correspond to the total uncertainty. |

png pdf |
Figure 8-c:
Ratio of the inclusive jet cross section to theoretical predictions using the NNPDF2.1-NLO PDF set for the five rapidity bins, where the ${\alpha _S(M_ {\mathrm {Z}})} $ value is varied in the range 0.116--0.122 in steps of 0.001. The error bars correspond to the total uncertainty. |

png pdf |
Figure 8-d:
Ratio of the inclusive jet cross section to theoretical predictions using the NNPDF2.1-NLO PDF set for the five rapidity bins, where the ${\alpha _S(M_ {\mathrm {Z}})} $ value is varied in the range 0.116--0.122 in steps of 0.001. The error bars correspond to the total uncertainty. |

png pdf |
Figure 8-e:
Ratio of the inclusive jet cross section to theoretical predictions using the NNPDF2.1-NLO PDF set for the five rapidity bins, where the ${\alpha _S(M_ {\mathrm {Z}})} $ value is varied in the range 0.116--0.122 in steps of 0.001. The error bars correspond to the total uncertainty. |
png pdf |
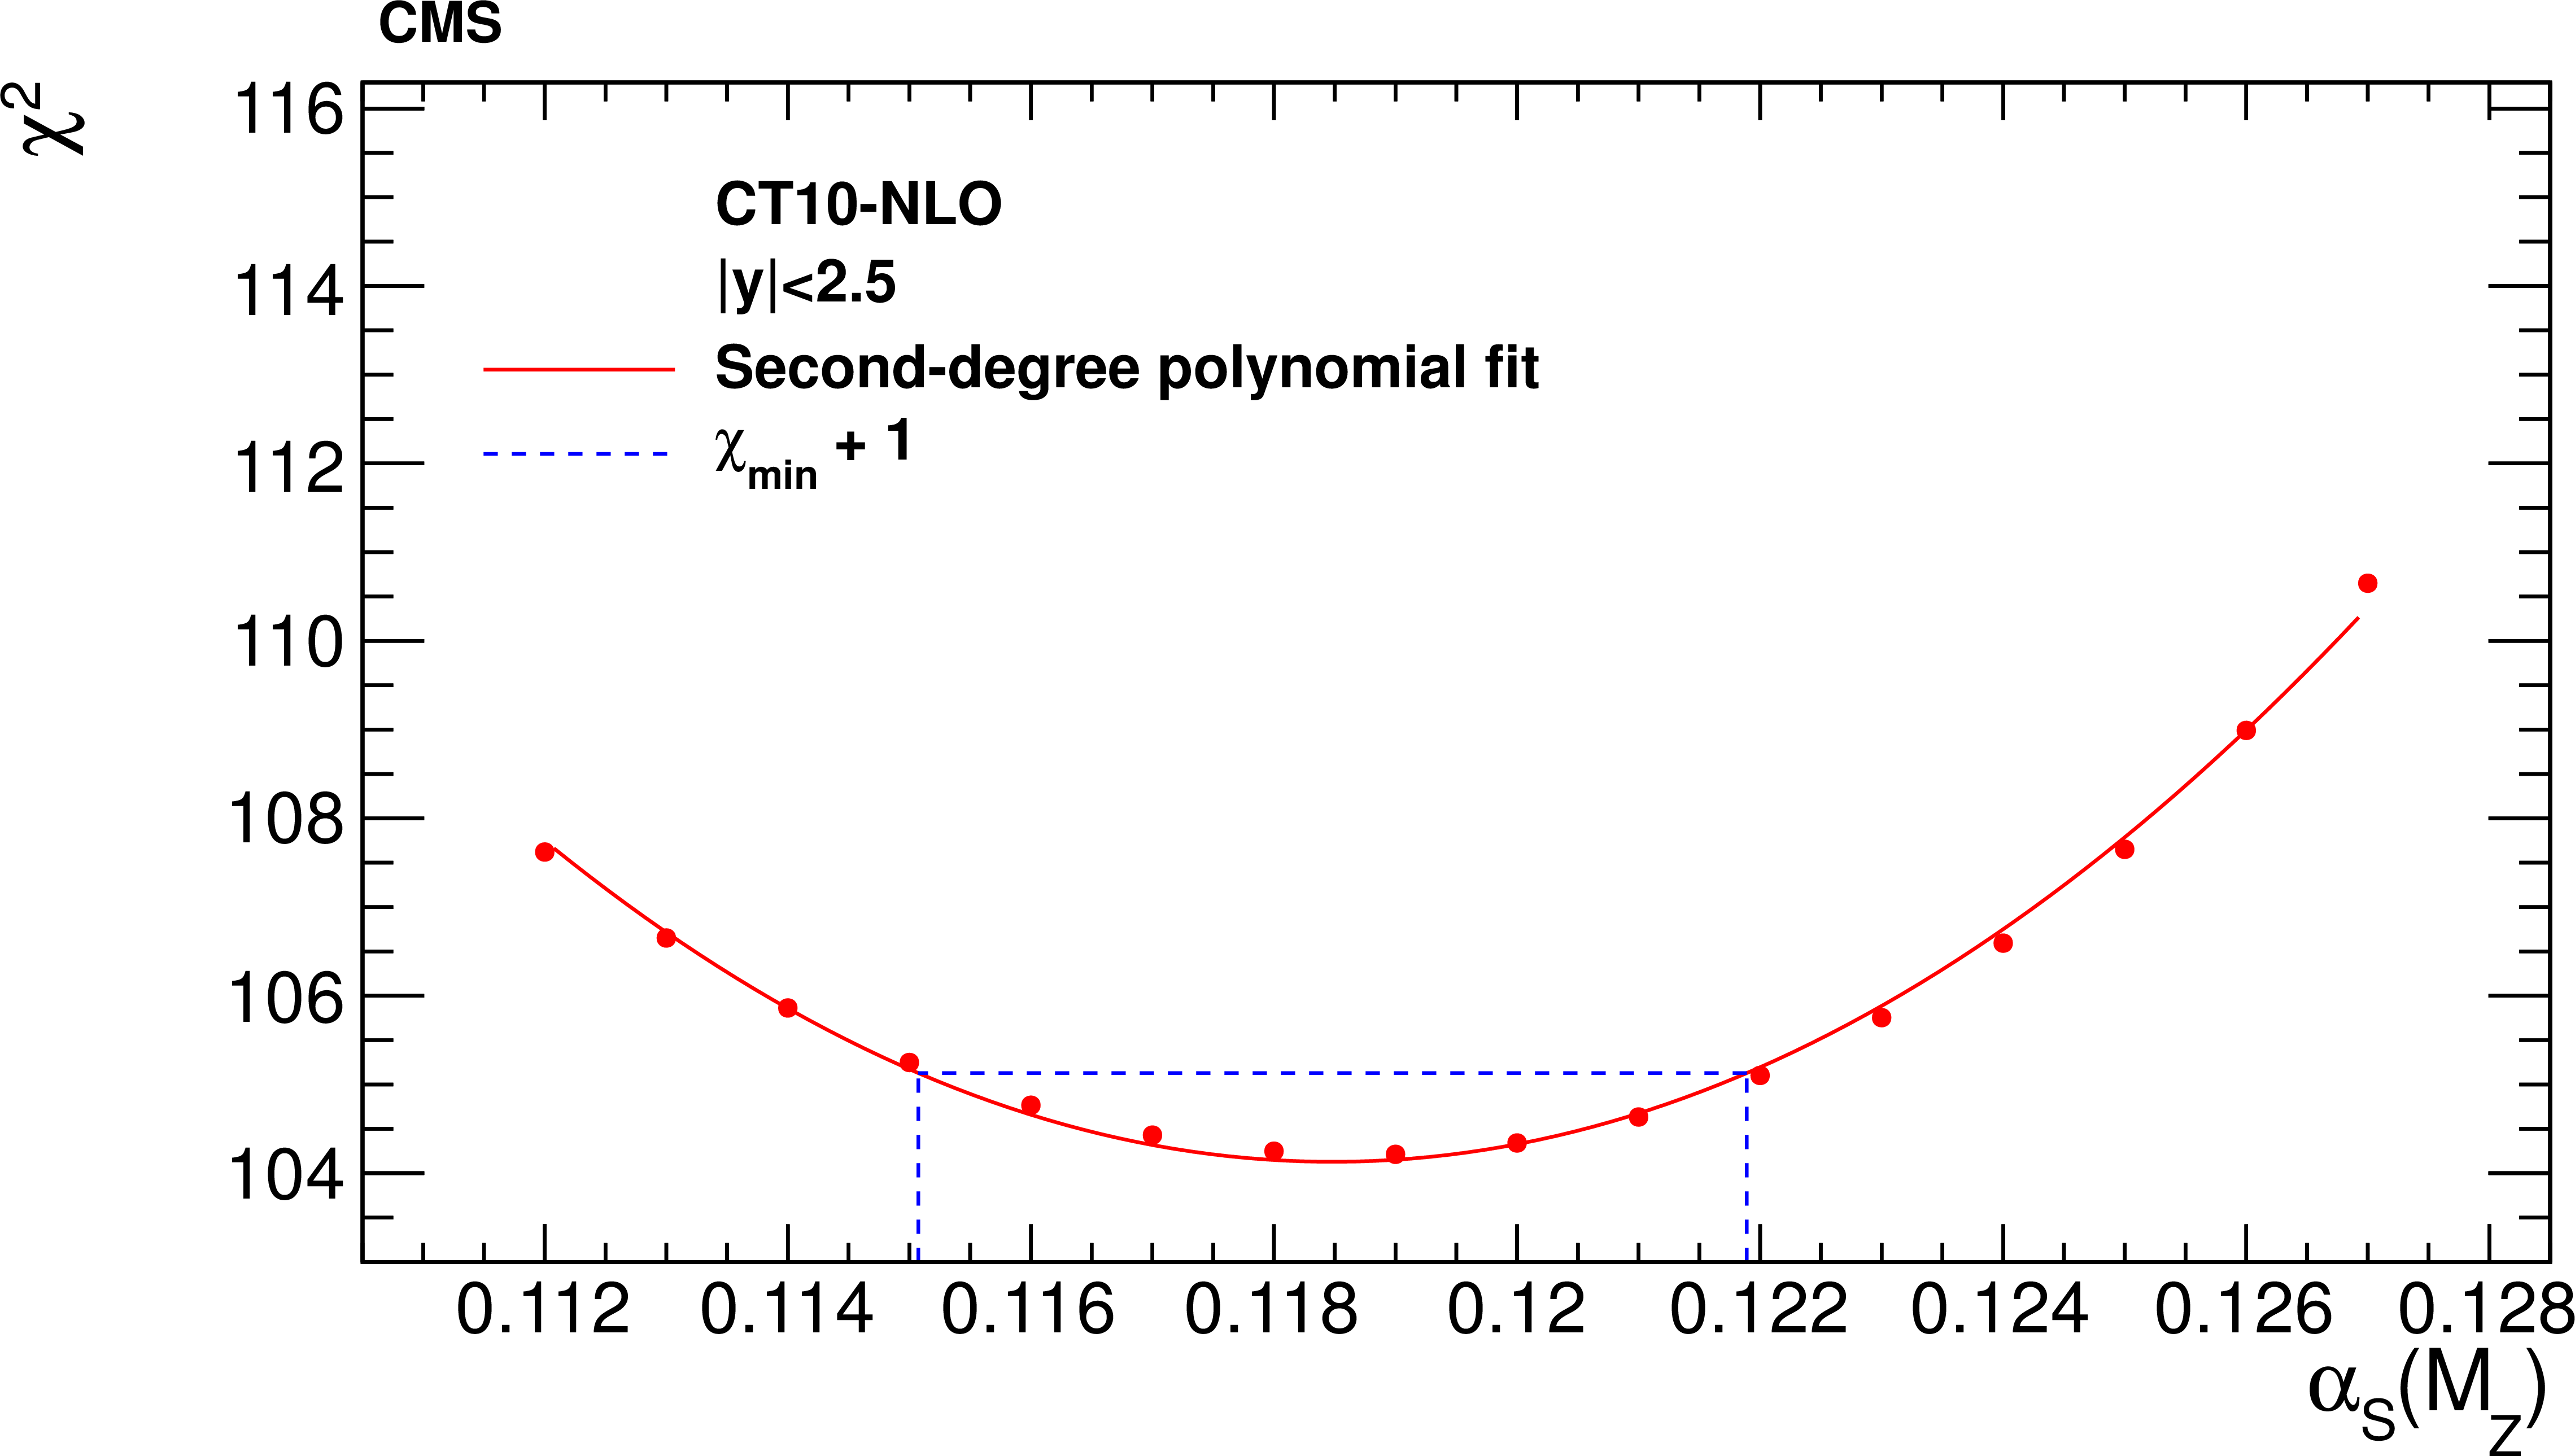
Figure 9:
The $ {\chi ^2} $ minimisation with respect to $ {\alpha _S(M_ {\mathrm {Z}})} $ using the CT10-NLO PDF set and data from all rapidity bins. The experimental uncertainty is obtained from the $ {\alpha _S(M_ {\mathrm {Z}})} $ values for which $ {\chi ^2} $ is increased by one with respect to the minimum value, indicated by the dashed line. The curve corresponds to a second-degree polynomial fit through the available $ {\chi ^2} $ points. |

png pdf |
Figure 10:
The strong coupling $ {\alpha _S(Q)} $ (full line) and its total uncertainty (band) as determined in this analysis using a two-loop solution to the RGE as a function of the momentum transfer $Q= {p_{\mathrm {T}}} $. The extractions of $ {\alpha _S(Q)} $ in six separate ranges of $Q$ as presented in Table 5 are shown together with results from the H1 [58-59], ZEUS [60], and D0 [52,53] experiments at the HERA and Tevatron colliders. Other recent CMS measurements [55,56] are displayed as well. The uncertainties represented by error bars are subject to correlations. |

png pdf |
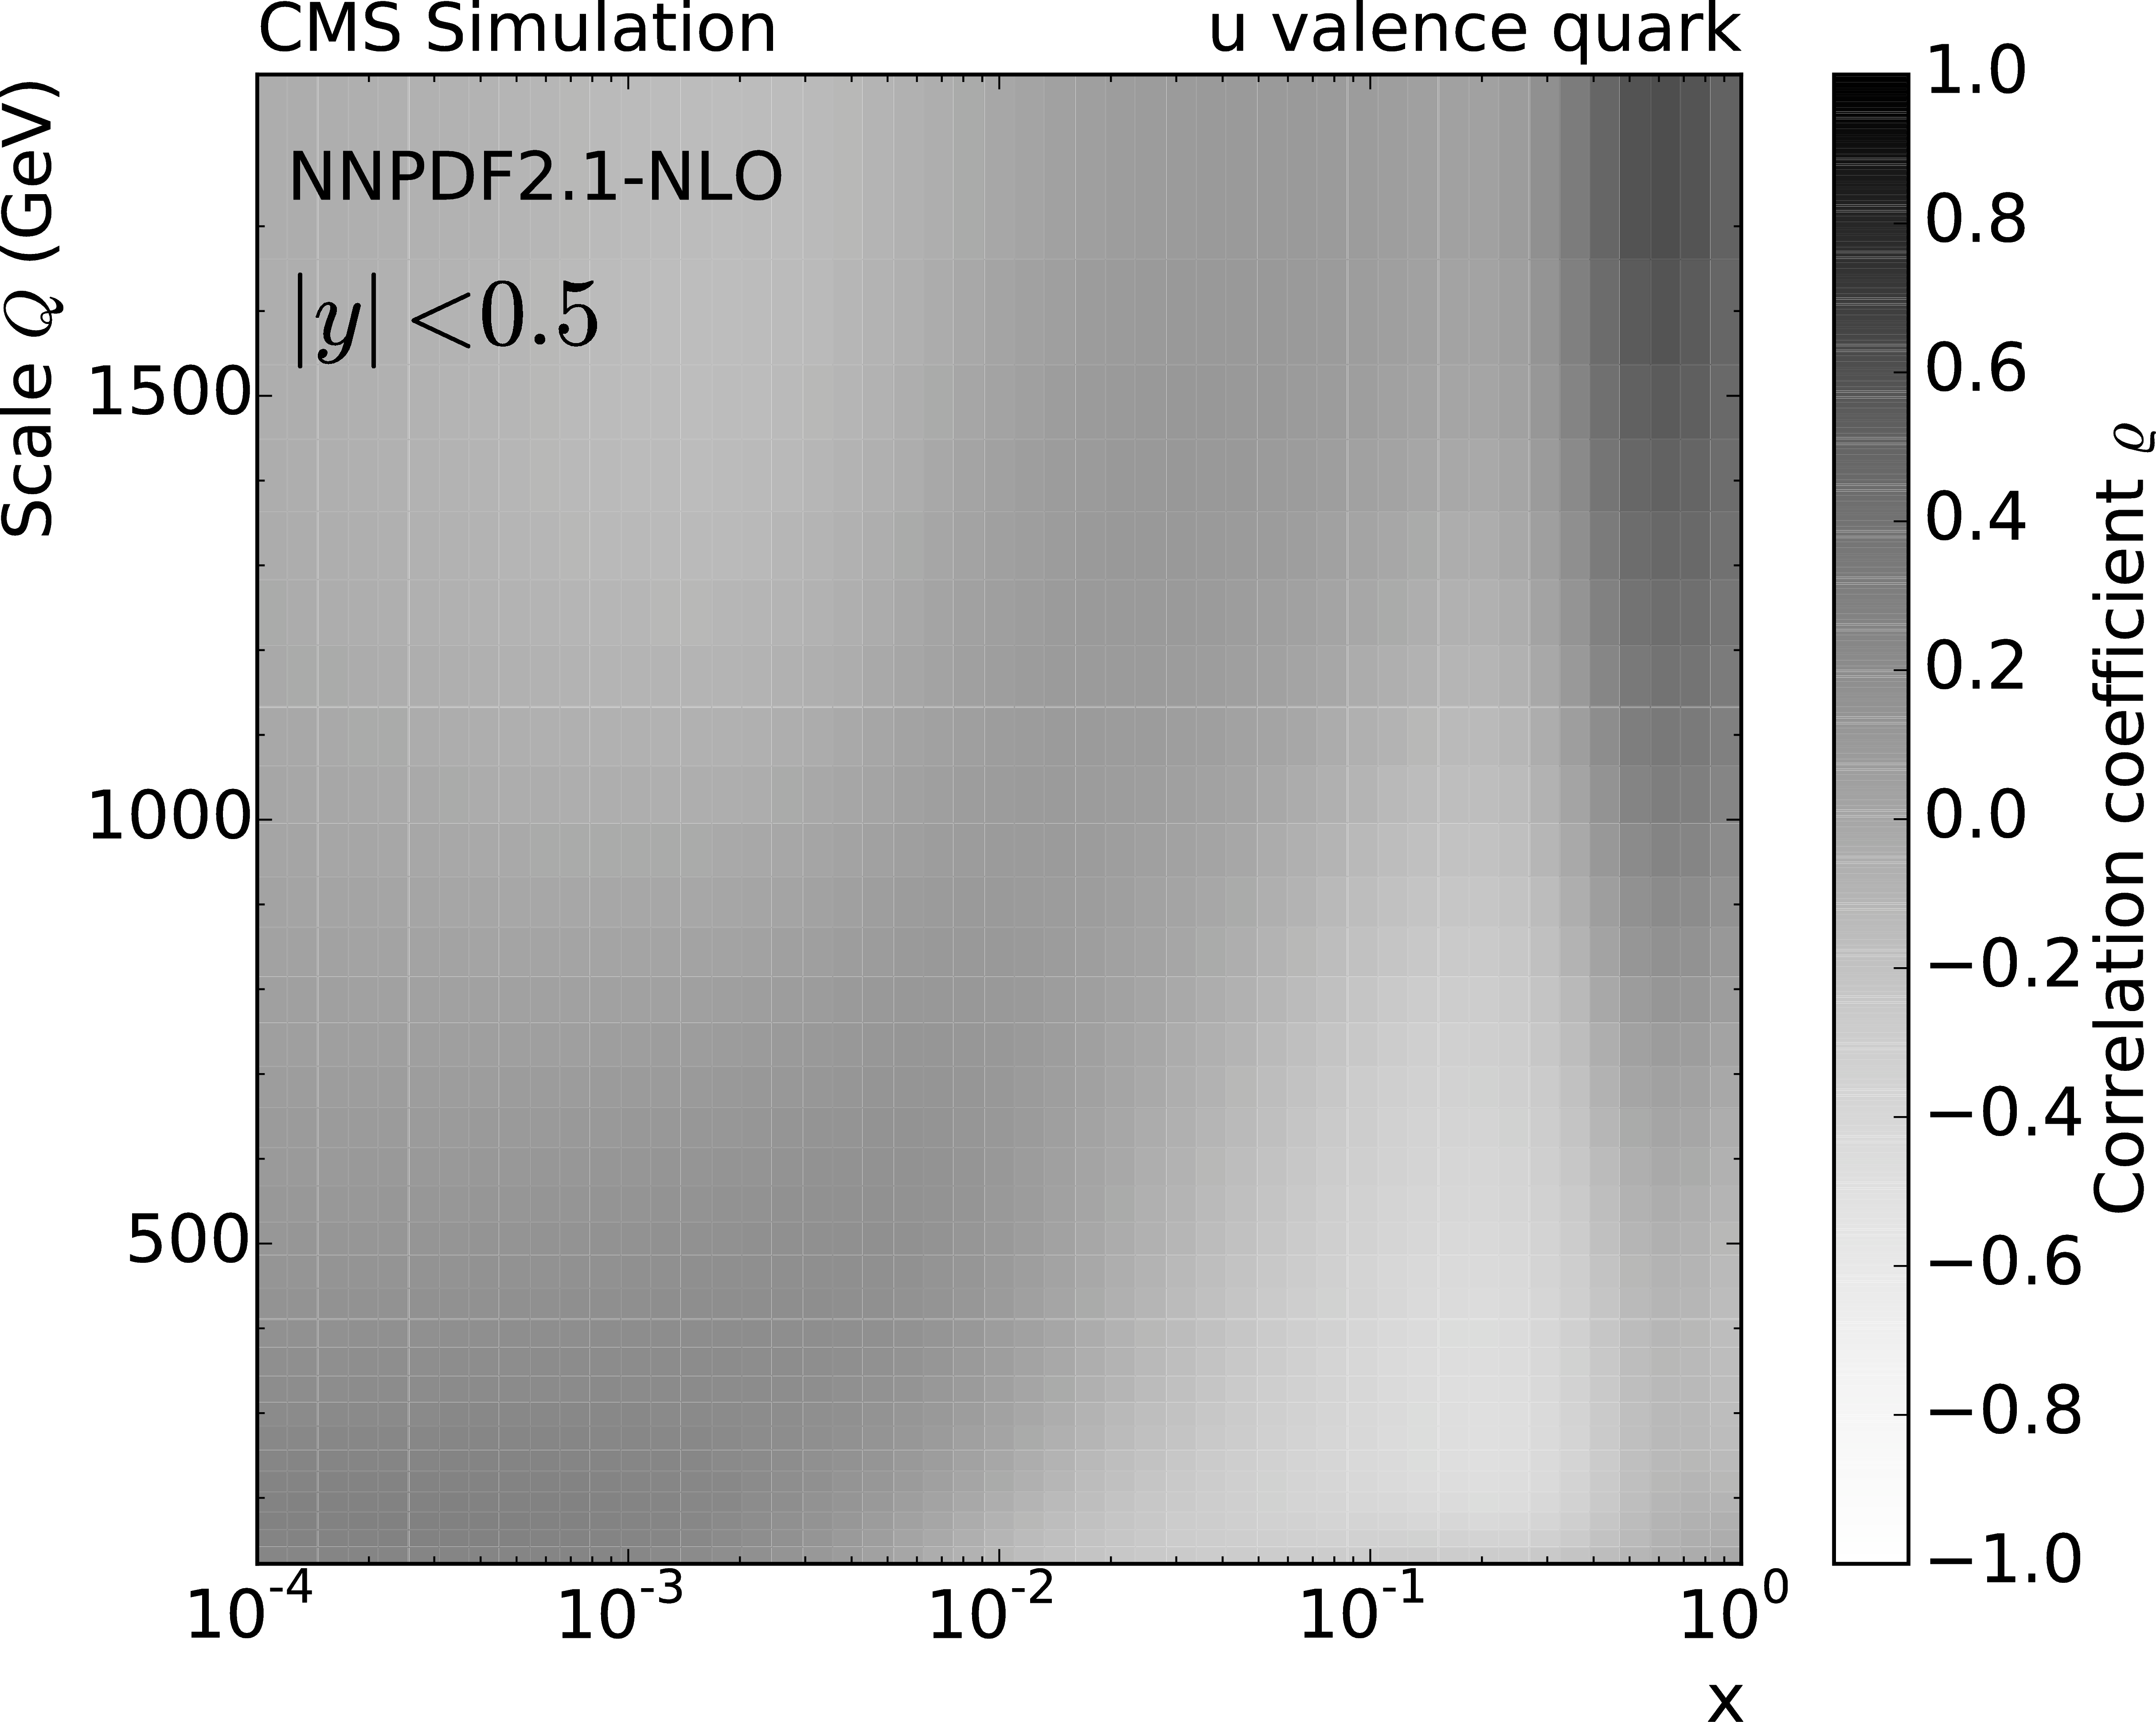
Figure 11-a:
The correlation coefficient between the inclusive jet cross section and the gluon (a,b), the u valence quark (c,d), and the d valence quark PDFs (e,f), as a function of the momentum fraction $x$ of the proton and the energy scale $Q$ of the hard process. The correlation is shown for the central rapidity region $ { {| y | }} <$ 0.5 (a,c,e) and for 2.0 $< { {| y | }} <$ 2.5 (b,d,f). |

png pdf |
Figure 11-b:
The correlation coefficient between the inclusive jet cross section and the gluon (a,b), the u valence quark (c,d), and the d valence quark PDFs (e,f), as a function of the momentum fraction $x$ of the proton and the energy scale $Q$ of the hard process. The correlation is shown for the central rapidity region $ { {| y | }} <$ 0.5 (a,c,e) and for 2.0 $< { {| y | }} <$ 2.5 (b,d,f). |
png pdf |
Figure 11-c:
The correlation coefficient between the inclusive jet cross section and the gluon (a,b), the u valence quark (c,d), and the d valence quark PDFs (e,f), as a function of the momentum fraction $x$ of the proton and the energy scale $Q$ of the hard process. The correlation is shown for the central rapidity region $ { {| y | }} <$ 0.5 (a,c,e) and for 2.0 $< { {| y | }} <$ 2.5 (b,d,f). |

png pdf |
Figure 11-d:
The correlation coefficient between the inclusive jet cross section and the gluon (a,b), the u valence quark (c,d), and the d valence quark PDFs (e,f), as a function of the momentum fraction $x$ of the proton and the energy scale $Q$ of the hard process. The correlation is shown for the central rapidity region $ { {| y | }} <$ 0.5 (a,c,e) and for 2.0 $< { {| y | }} <$ 2.5 (b,d,f). |

png pdf |
Figure 11-e:
The correlation coefficient between the inclusive jet cross section and the gluon (a,b), the u valence quark (c,d), and the d valence quark PDFs (e,f), as a function of the momentum fraction $x$ of the proton and the energy scale $Q$ of the hard process. The correlation is shown for the central rapidity region $ { {| y | }} <$ 0.5 (a,c,e) and for 2.0 $< { {| y | }} <$ 2.5 (b,d,f). |

png pdf |
Figure 11-f:
The correlation coefficient between the inclusive jet cross section and the gluon (a,b), the u valence quark (c,d), and the d valence quark PDFs (e,f), as a function of the momentum fraction $x$ of the proton and the energy scale $Q$ of the hard process. The correlation is shown for the central rapidity region $ { {| y | }} <$ 0.5 (a,c,e) and for 2.0 $< { {| y | }} <$ 2.5 (b,d,f). |

png pdf |
Figure 12-a:
The gluon (a,b) and sea quark (c,d) PDFs as a function of $x$ as derived from HERA-I inclusive DIS data alone (a,c) and in combination with CMS inclusive jet data (b,d). The PDFs are shown at the starting scale $Q^2 =$ 1.9 GeV$^2$. The experimental (inner band), model (middle band), and parameterization uncertainties (outer band) are successively added quadratically to give the total uncertainty. |

png pdf |
Figure 12-b:
The gluon (a,b) and sea quark (c,d) PDFs as a function of $x$ as derived from HERA-I inclusive DIS data alone (a,c) and in combination with CMS inclusive jet data (b,d). The PDFs are shown at the starting scale $Q^2 =$ 1.9 GeV$^2$. The experimental (inner band), model (middle band), and parameterization uncertainties (outer band) are successively added quadratically to give the total uncertainty. |
png pdf |
Figure 12-c:
The gluon (a,b) and sea quark (c,d) PDFs as a function of $x$ as derived from HERA-I inclusive DIS data alone (a,c) and in combination with CMS inclusive jet data (b,d). The PDFs are shown at the starting scale $Q^2 =$ 1.9 GeV$^2$. The experimental (inner band), model (middle band), and parameterization uncertainties (outer band) are successively added quadratically to give the total uncertainty. |

png pdf |
Figure 12-d:
The gluon (a,b) and sea quark (c,d) PDFs as a function of $x$ as derived from HERA-I inclusive DIS data alone (a,c) and in combination with CMS inclusive jet data (b,d). The PDFs are shown at the starting scale $Q^2 =$ 1.9 GeV$^2$. The experimental (inner band), model (middle band), and parameterization uncertainties (outer band) are successively added quadratically to give the total uncertainty. |

png pdf |
Figure 13-a:
The u valence quark (a,b) and d valence quark (c,d) PDFs as a function of $x$ as derived from HERA-I inclusive DIS data alone (a,c) and in combination with CMS inclusive jet data (b,d). The PDFs are shown at the starting scale $Q^2 =$ 1.9 GeV$^2$. The experimental (inner band), model (middle band), and parameterization uncertainties (outer band) are successively added quadratically to give the total uncertainty. |

png pdf |
Figure 13-b:
The u valence quark (a,b) and d valence quark (c,d) PDFs as a function of $x$ as derived from HERA-I inclusive DIS data alone (a,c) and in combination with CMS inclusive jet data (b,d). The PDFs are shown at the starting scale $Q^2 =$ 1.9 GeV$^2$. The experimental (inner band), model (middle band), and parameterization uncertainties (outer band) are successively added quadratically to give the total uncertainty. |

png pdf |
Figure 13-c:
The u valence quark (a,b) and d valence quark (c,d) PDFs as a function of $x$ as derived from HERA-I inclusive DIS data alone (a,c) and in combination with CMS inclusive jet data (b,d). The PDFs are shown at the starting scale $Q^2 =$ 1.9 GeV$^2$. The experimental (inner band), model (middle band), and parameterization uncertainties (outer band) are successively added quadratically to give the total uncertainty. |

png pdf |
Figure 13-d:
The u valence quark (a,b) and d valence quark (c,d) PDFs as a function of $x$ as derived from HERA-I inclusive DIS data alone (a,c) and in combination with CMS inclusive jet data (b,d). The PDFs are shown at the starting scale $Q^2 =$ 1.9 GeV$^2$. The experimental (inner band), model (middle band), and parameterization uncertainties (outer band) are successively added quadratically to give the total uncertainty. |

png pdf |
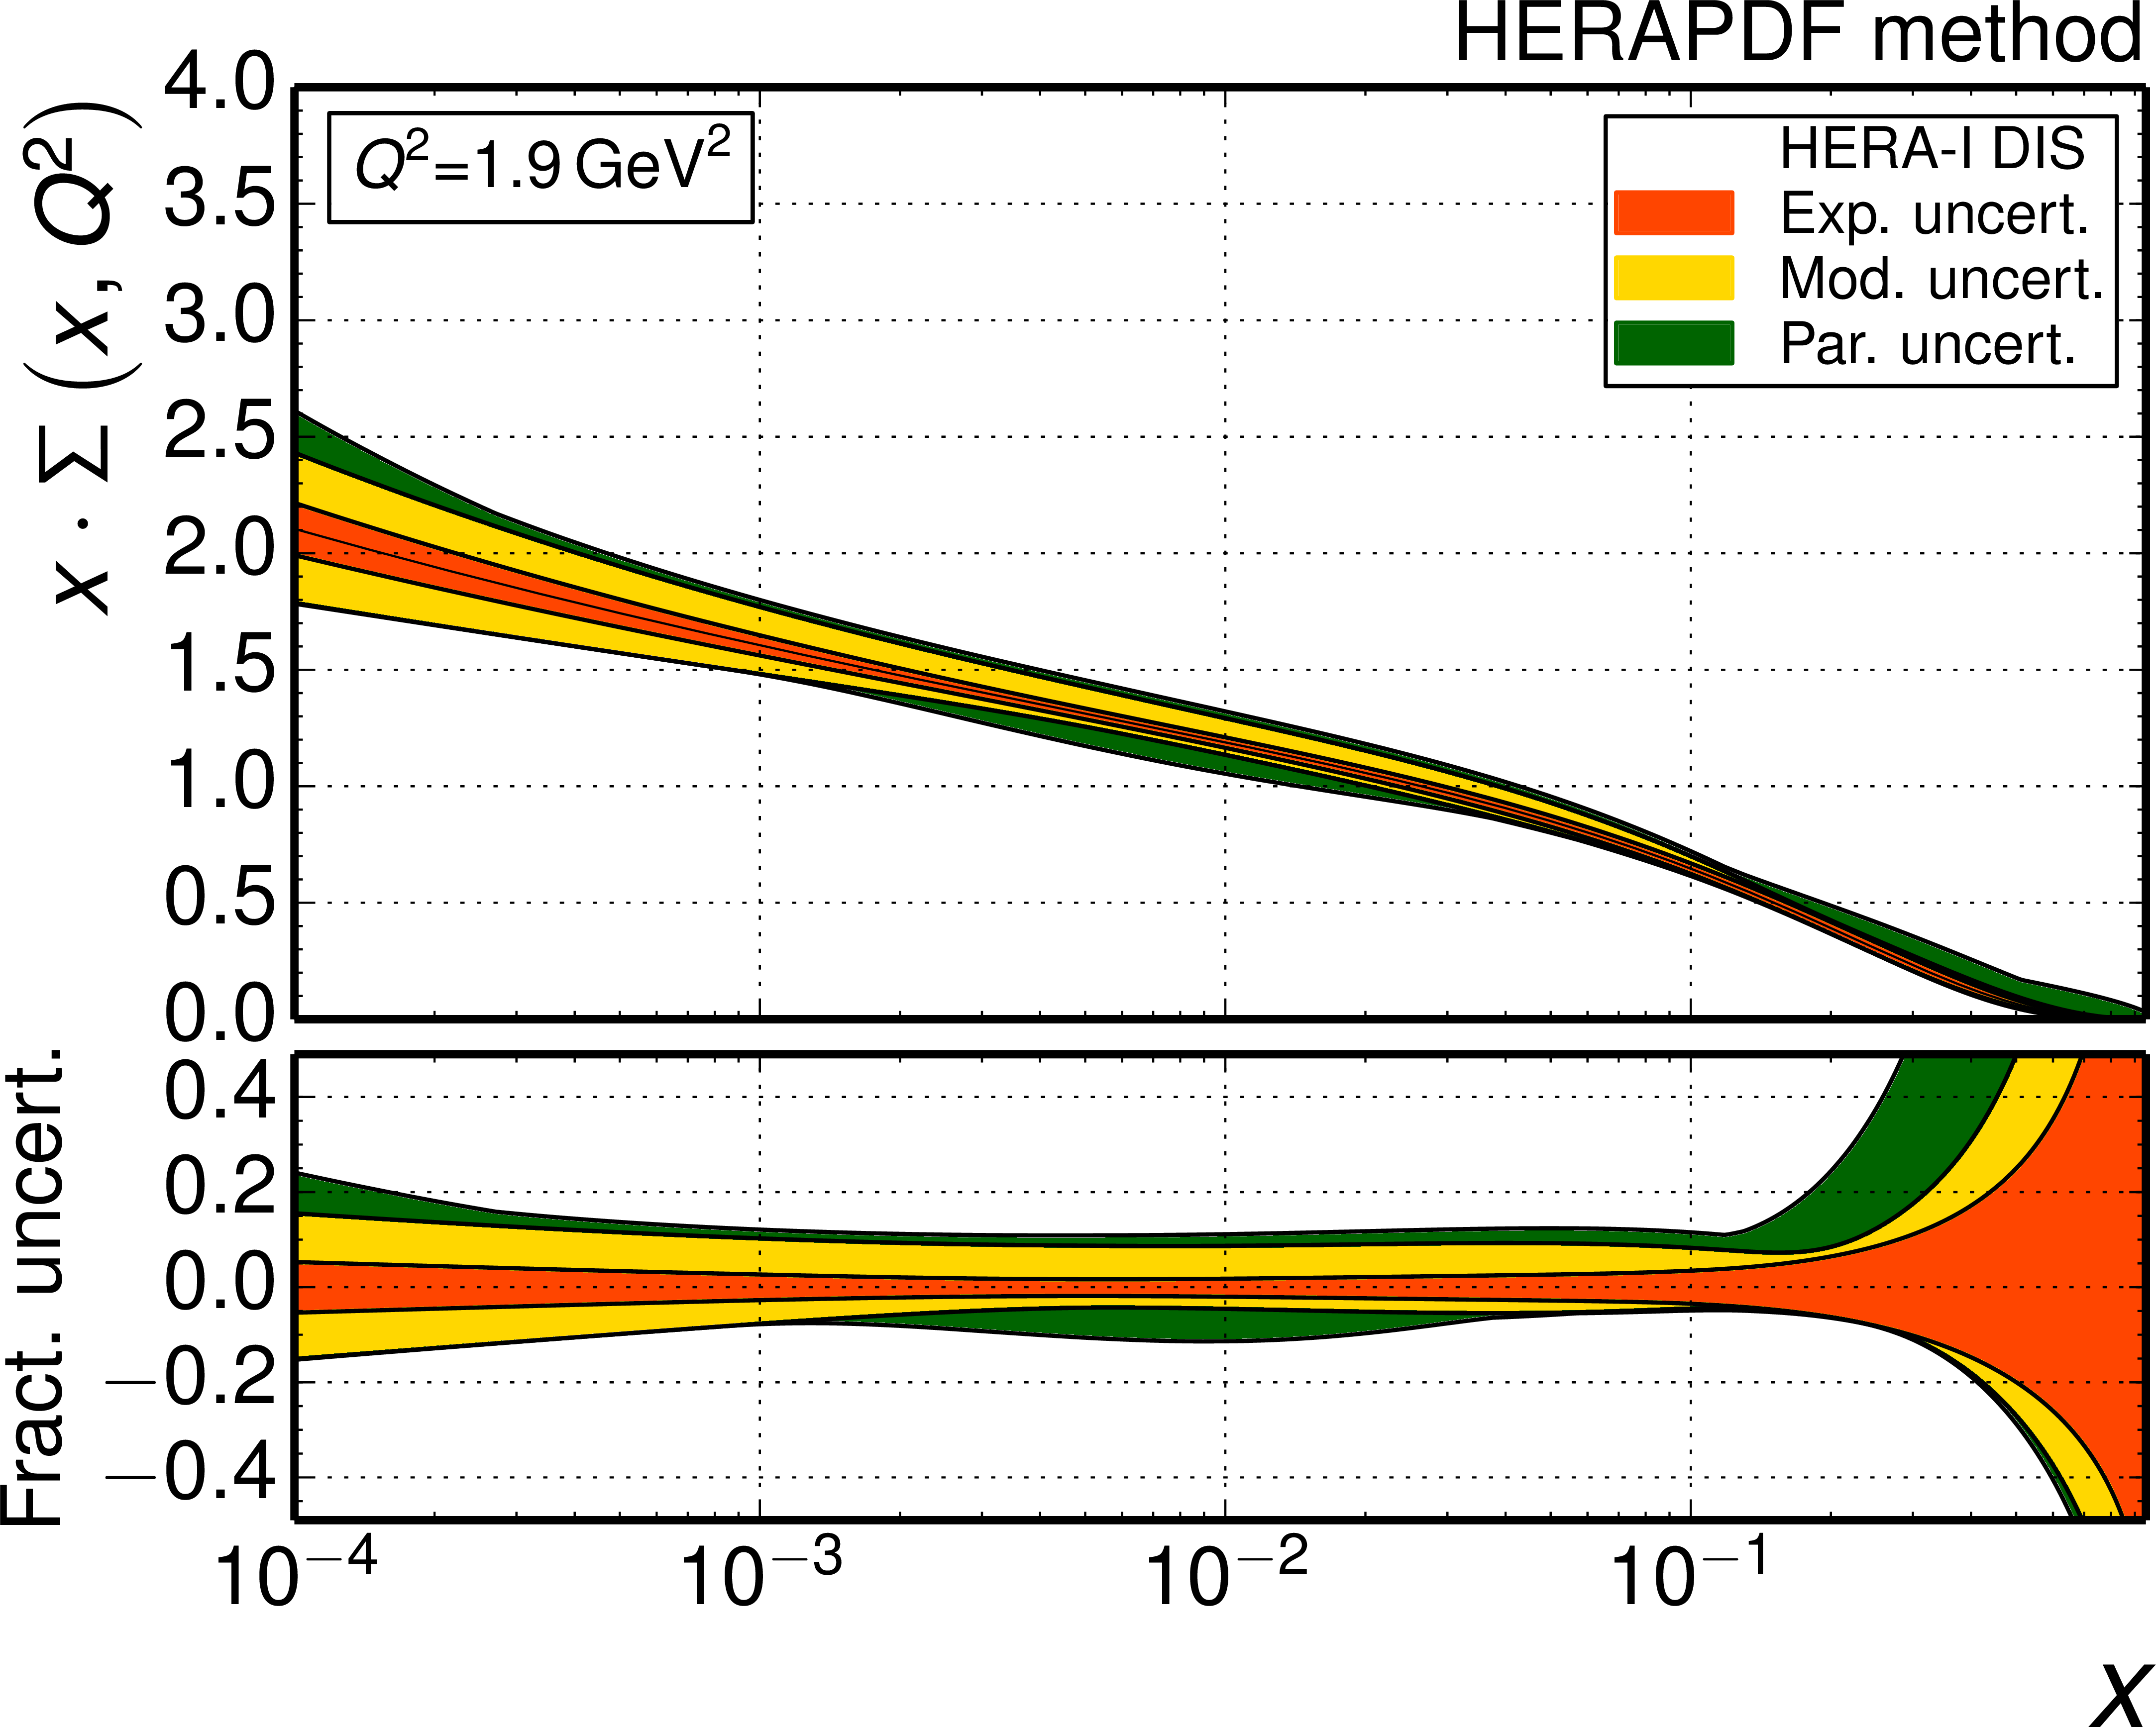
Figure 14-a:
The gluon (a), sea quark (b), u valence quark (c), and d valence quark (d) PDFs as a function of $x$ as derived from HERA-I inclusive DIS data alone (dashed line) and in combination with CMS inclusive jet data (full line). The PDFs are determined employing the HERAPDF method with a $Q^2_\mathrm {min} =$ 7.5 GeV$^2$ selection criterion. The PDFs are shown at the starting scale $Q^2 = $ 1.9 GeV$^2$. Only the total uncertainty in the PDFs is shown (hatched and solid bands). |

png pdf |
Figure 14-b:
The gluon (a), sea quark (b), u valence quark (c), and d valence quark (d) PDFs as a function of $x$ as derived from HERA-I inclusive DIS data alone (dashed line) and in combination with CMS inclusive jet data (full line). The PDFs are determined employing the HERAPDF method with a $Q^2_\mathrm {min} =$ 7.5 GeV$^2$ selection criterion. The PDFs are shown at the starting scale $Q^2 = $ 1.9 GeV$^2$. Only the total uncertainty in the PDFs is shown (hatched and solid bands). |

png pdf |
Figure 14-c:
The gluon (a), sea quark (b), u valence quark (c), and d valence quark (d) PDFs as a function of $x$ as derived from HERA-I inclusive DIS data alone (dashed line) and in combination with CMS inclusive jet data (full line). The PDFs are determined employing the HERAPDF method with a $Q^2_\mathrm {min} =$ 7.5 GeV$^2$ selection criterion. The PDFs are shown at the starting scale $Q^2 = $ 1.9 GeV$^2$. Only the total uncertainty in the PDFs is shown (hatched and solid bands). |

png pdf |
Figure 14-d:
The gluon (a), sea quark (b), u valence quark (c), and d valence quark (d) PDFs as a function of $x$ as derived from HERA-I inclusive DIS data alone (dashed line) and in combination with CMS inclusive jet data (full line). The PDFs are determined employing the HERAPDF method with a $Q^2_\mathrm {min} =$ 7.5 GeV$^2$ selection criterion. The PDFs are shown at the starting scale $Q^2 = $ 1.9 GeV$^2$. Only the total uncertainty in the PDFs is shown (hatched and solid bands). |

png pdf |
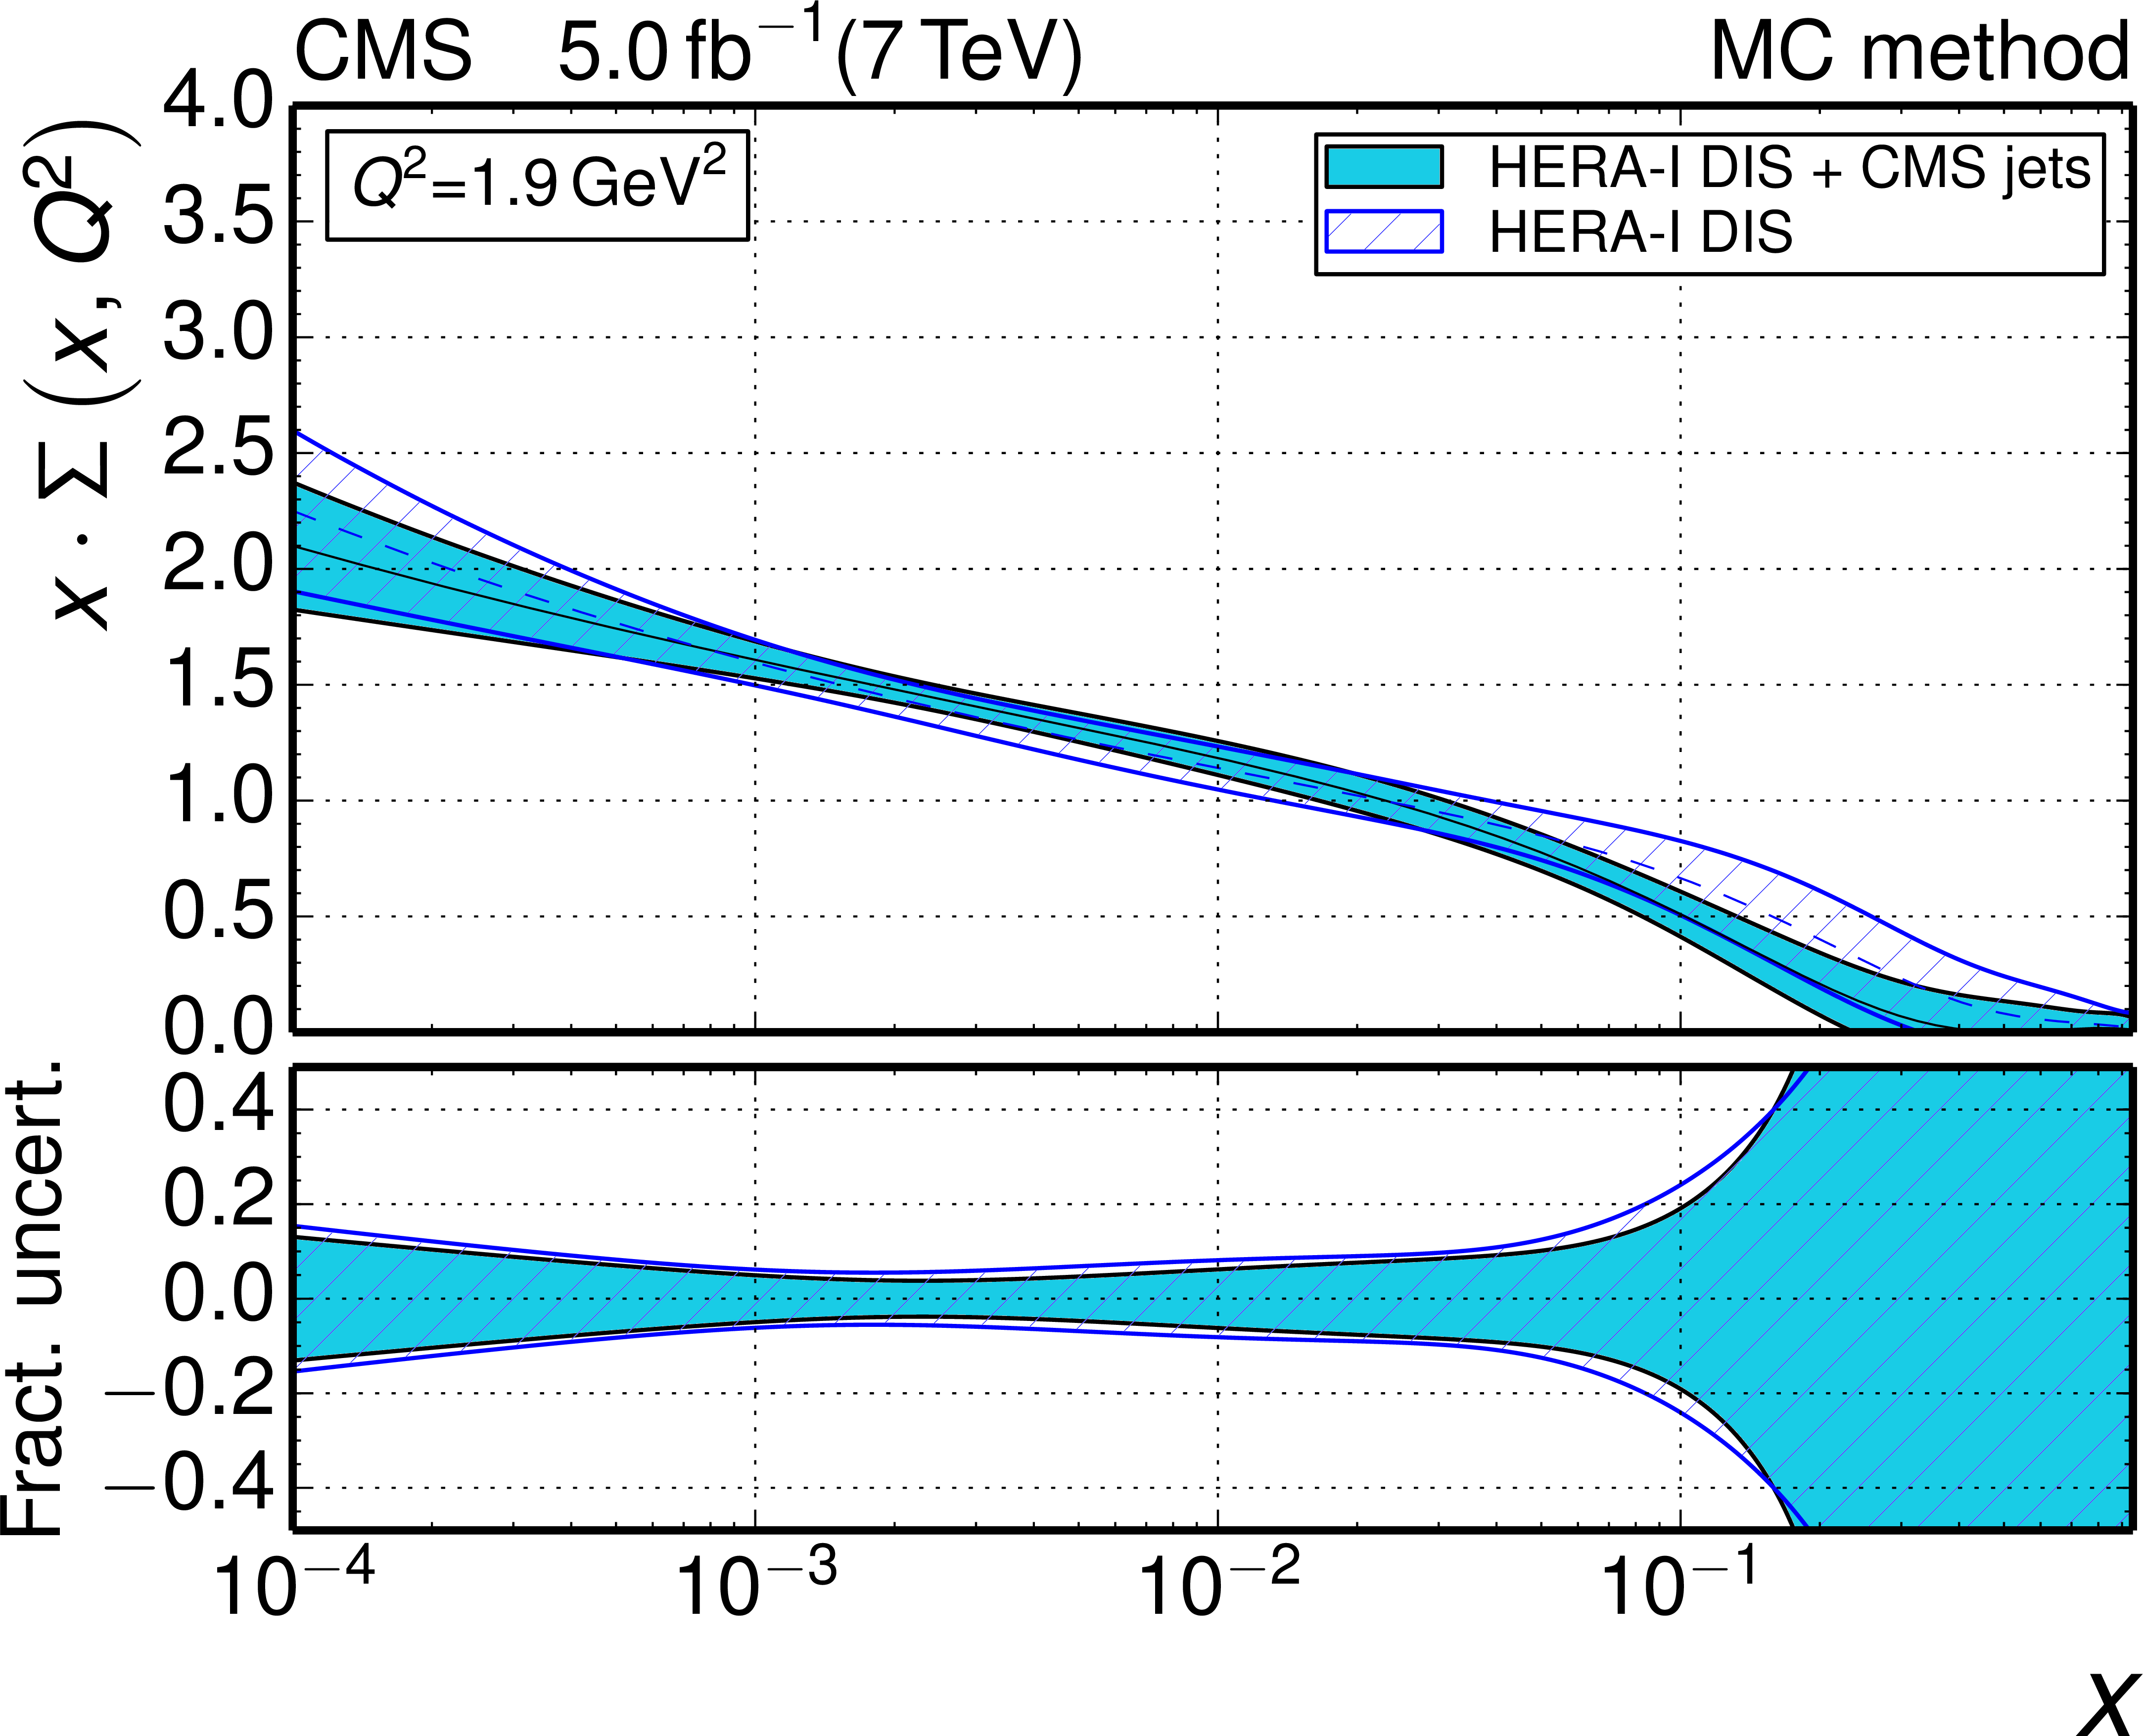
Figure 15-a:
The gluon (a), sea quark (b), u valence quark (c), and d valence quark (d) PDFs as a function of $x$ as derived from HERA-I inclusive DIS data alone (dashed line) and in combination with CMS inclusive jet data (full line). The PDFs are determined employing the MC method with data-derived regularisation. The PDFs are shown at the starting scale $Q^2 =$ 1.9 GeV $^2$. Only the total uncertainty in the PDFs is shown (hatched and solid bands). |
png pdf |
Figure 15-b:
The gluon (a), sea quark (b), u valence quark (c), and d valence quark (d) PDFs as a function of $x$ as derived from HERA-I inclusive DIS data alone (dashed line) and in combination with CMS inclusive jet data (full line). The PDFs are determined employing the MC method with data-derived regularisation. The PDFs are shown at the starting scale $Q^2 =$ 1.9 GeV $^2$. Only the total uncertainty in the PDFs is shown (hatched and solid bands). |

png pdf |
Figure 15-c:
The gluon (a), sea quark (b), u valence quark (c), and d valence quark (d) PDFs as a function of $x$ as derived from HERA-I inclusive DIS data alone (dashed line) and in combination with CMS inclusive jet data (full line). The PDFs are determined employing the MC method with data-derived regularisation. The PDFs are shown at the starting scale $Q^2 =$ 1.9 GeV $^2$. Only the total uncertainty in the PDFs is shown (hatched and solid bands). |

png pdf |
Figure 15-d:
The gluon (a), sea quark (b), u valence quark (c), and d valence quark (d) PDFs as a function of $x$ as derived from HERA-I inclusive DIS data alone (dashed line) and in combination with CMS inclusive jet data (full line). The PDFs are determined employing the MC method with data-derived regularisation. The PDFs are shown at the starting scale $Q^2 =$ 1.9 GeV $^2$. Only the total uncertainty in the PDFs is shown (hatched and solid bands). |
png pdf |
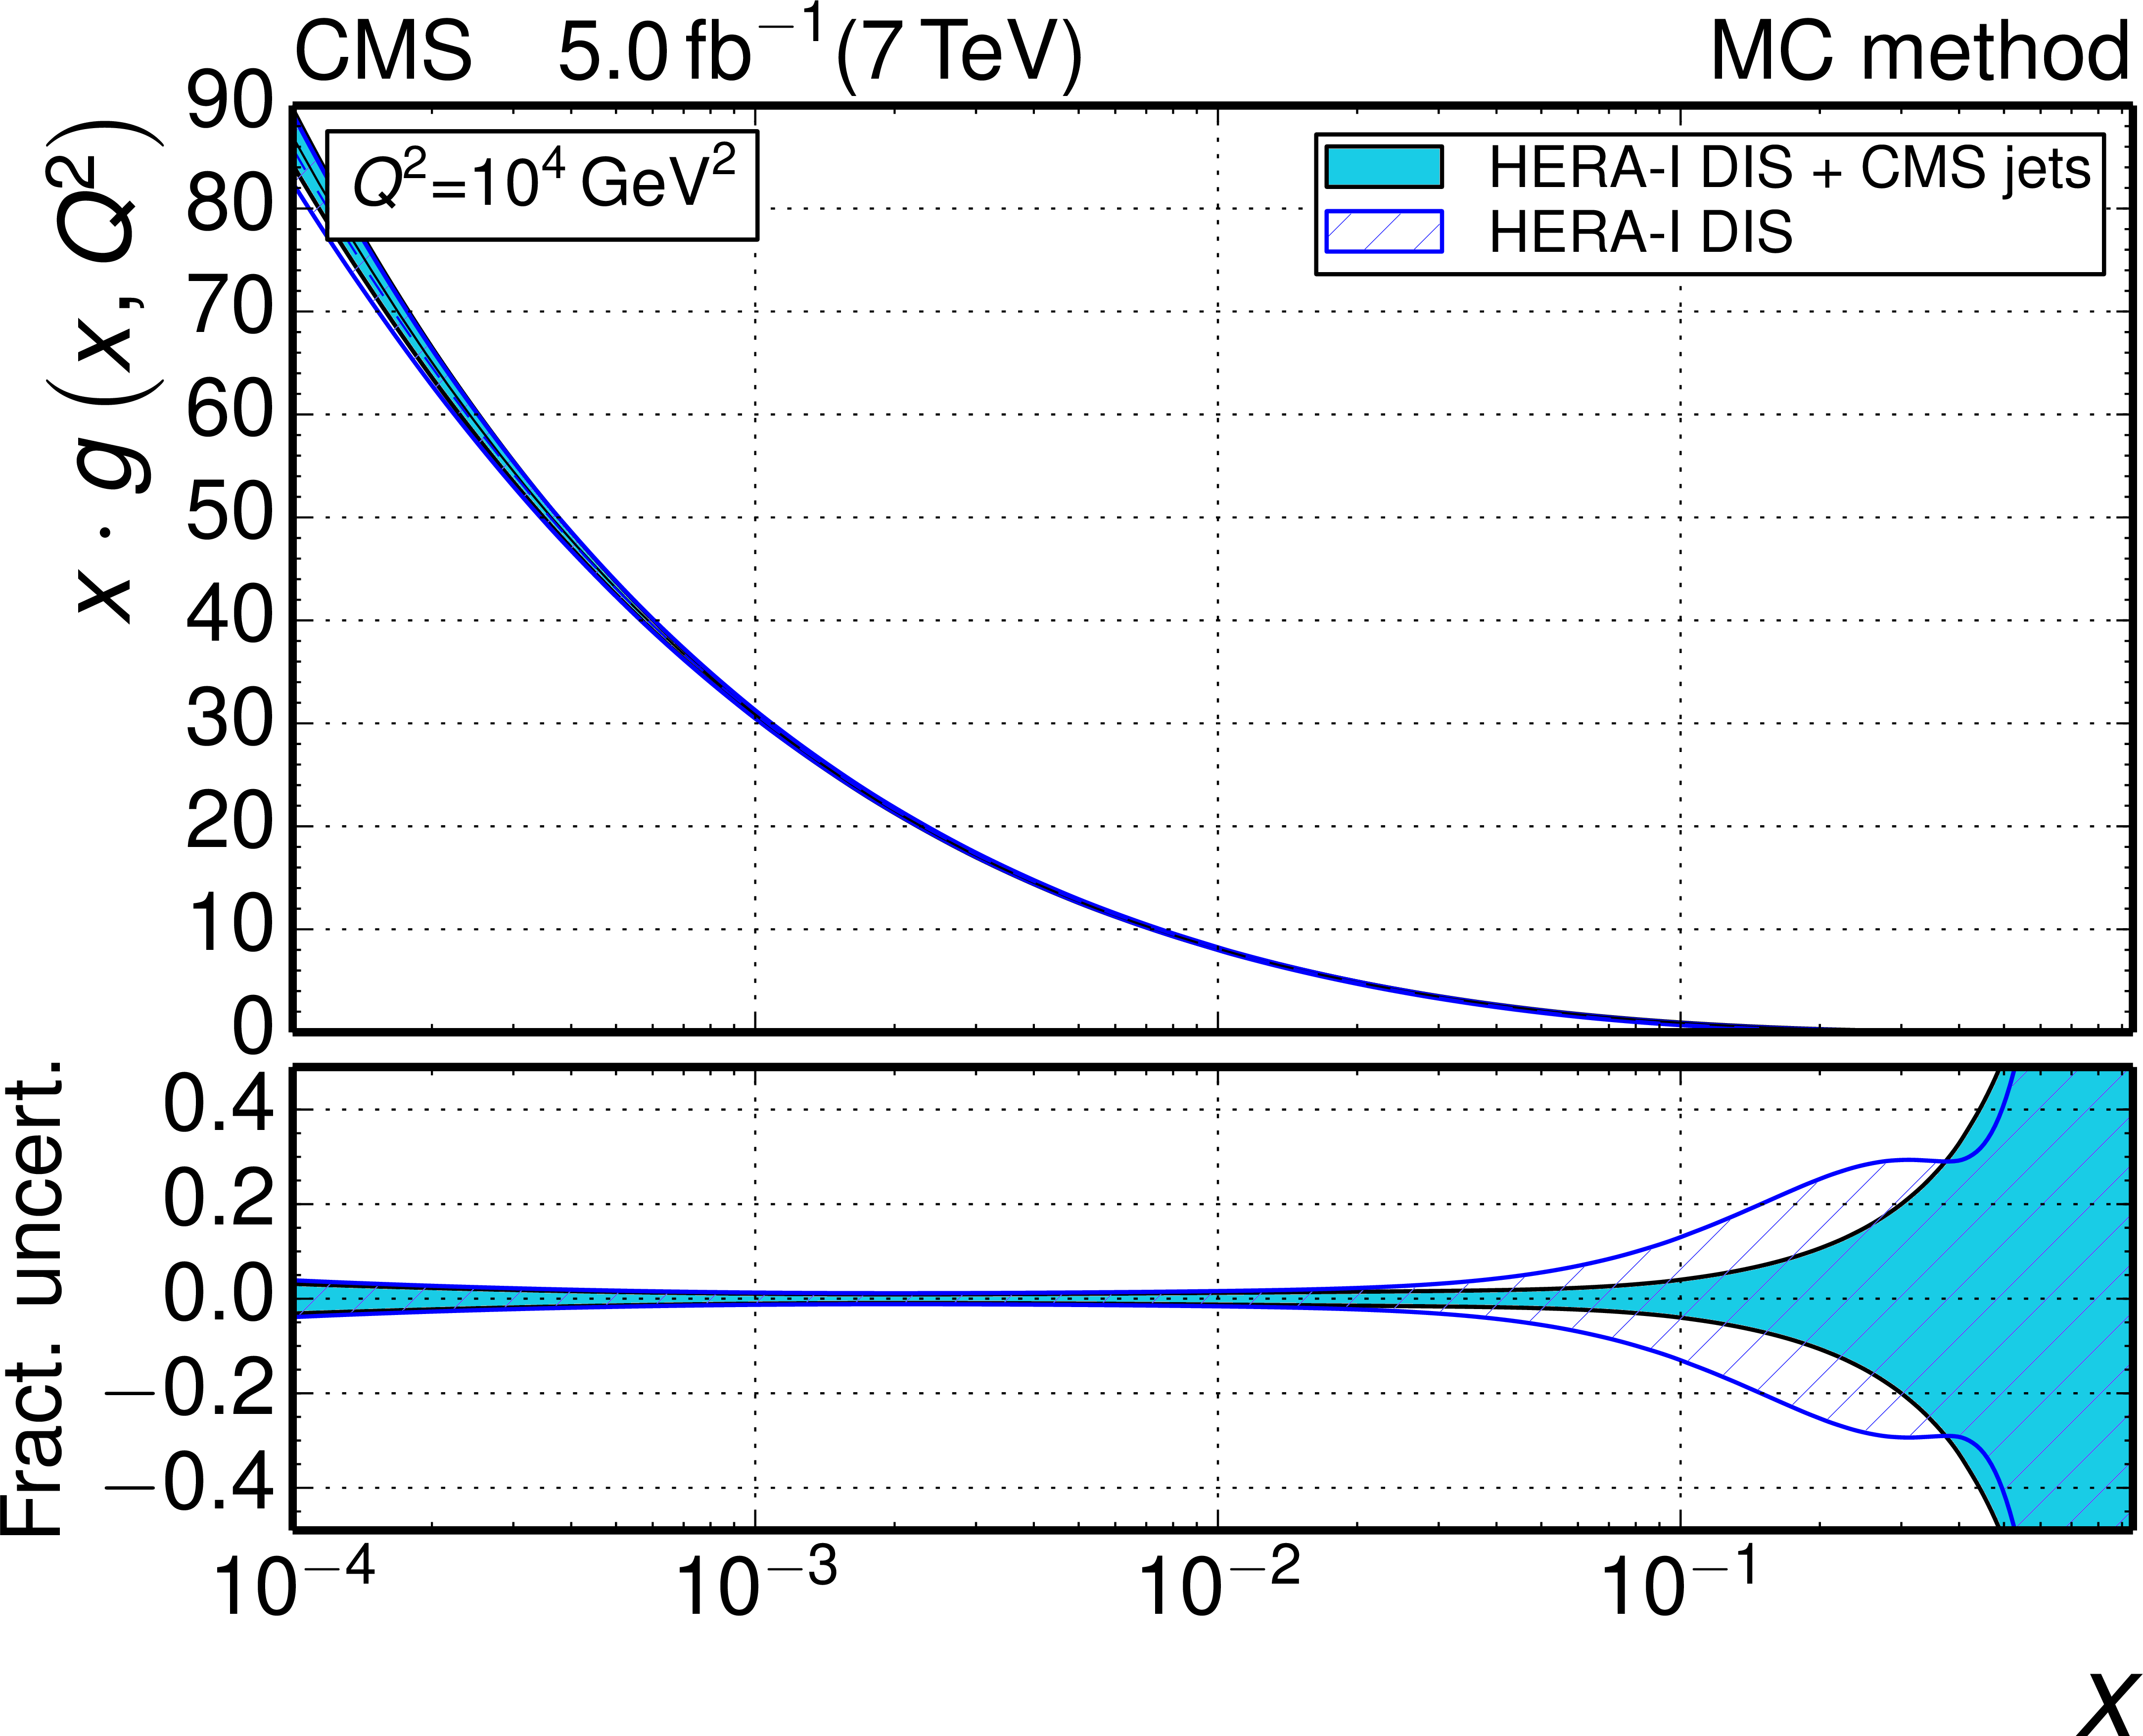
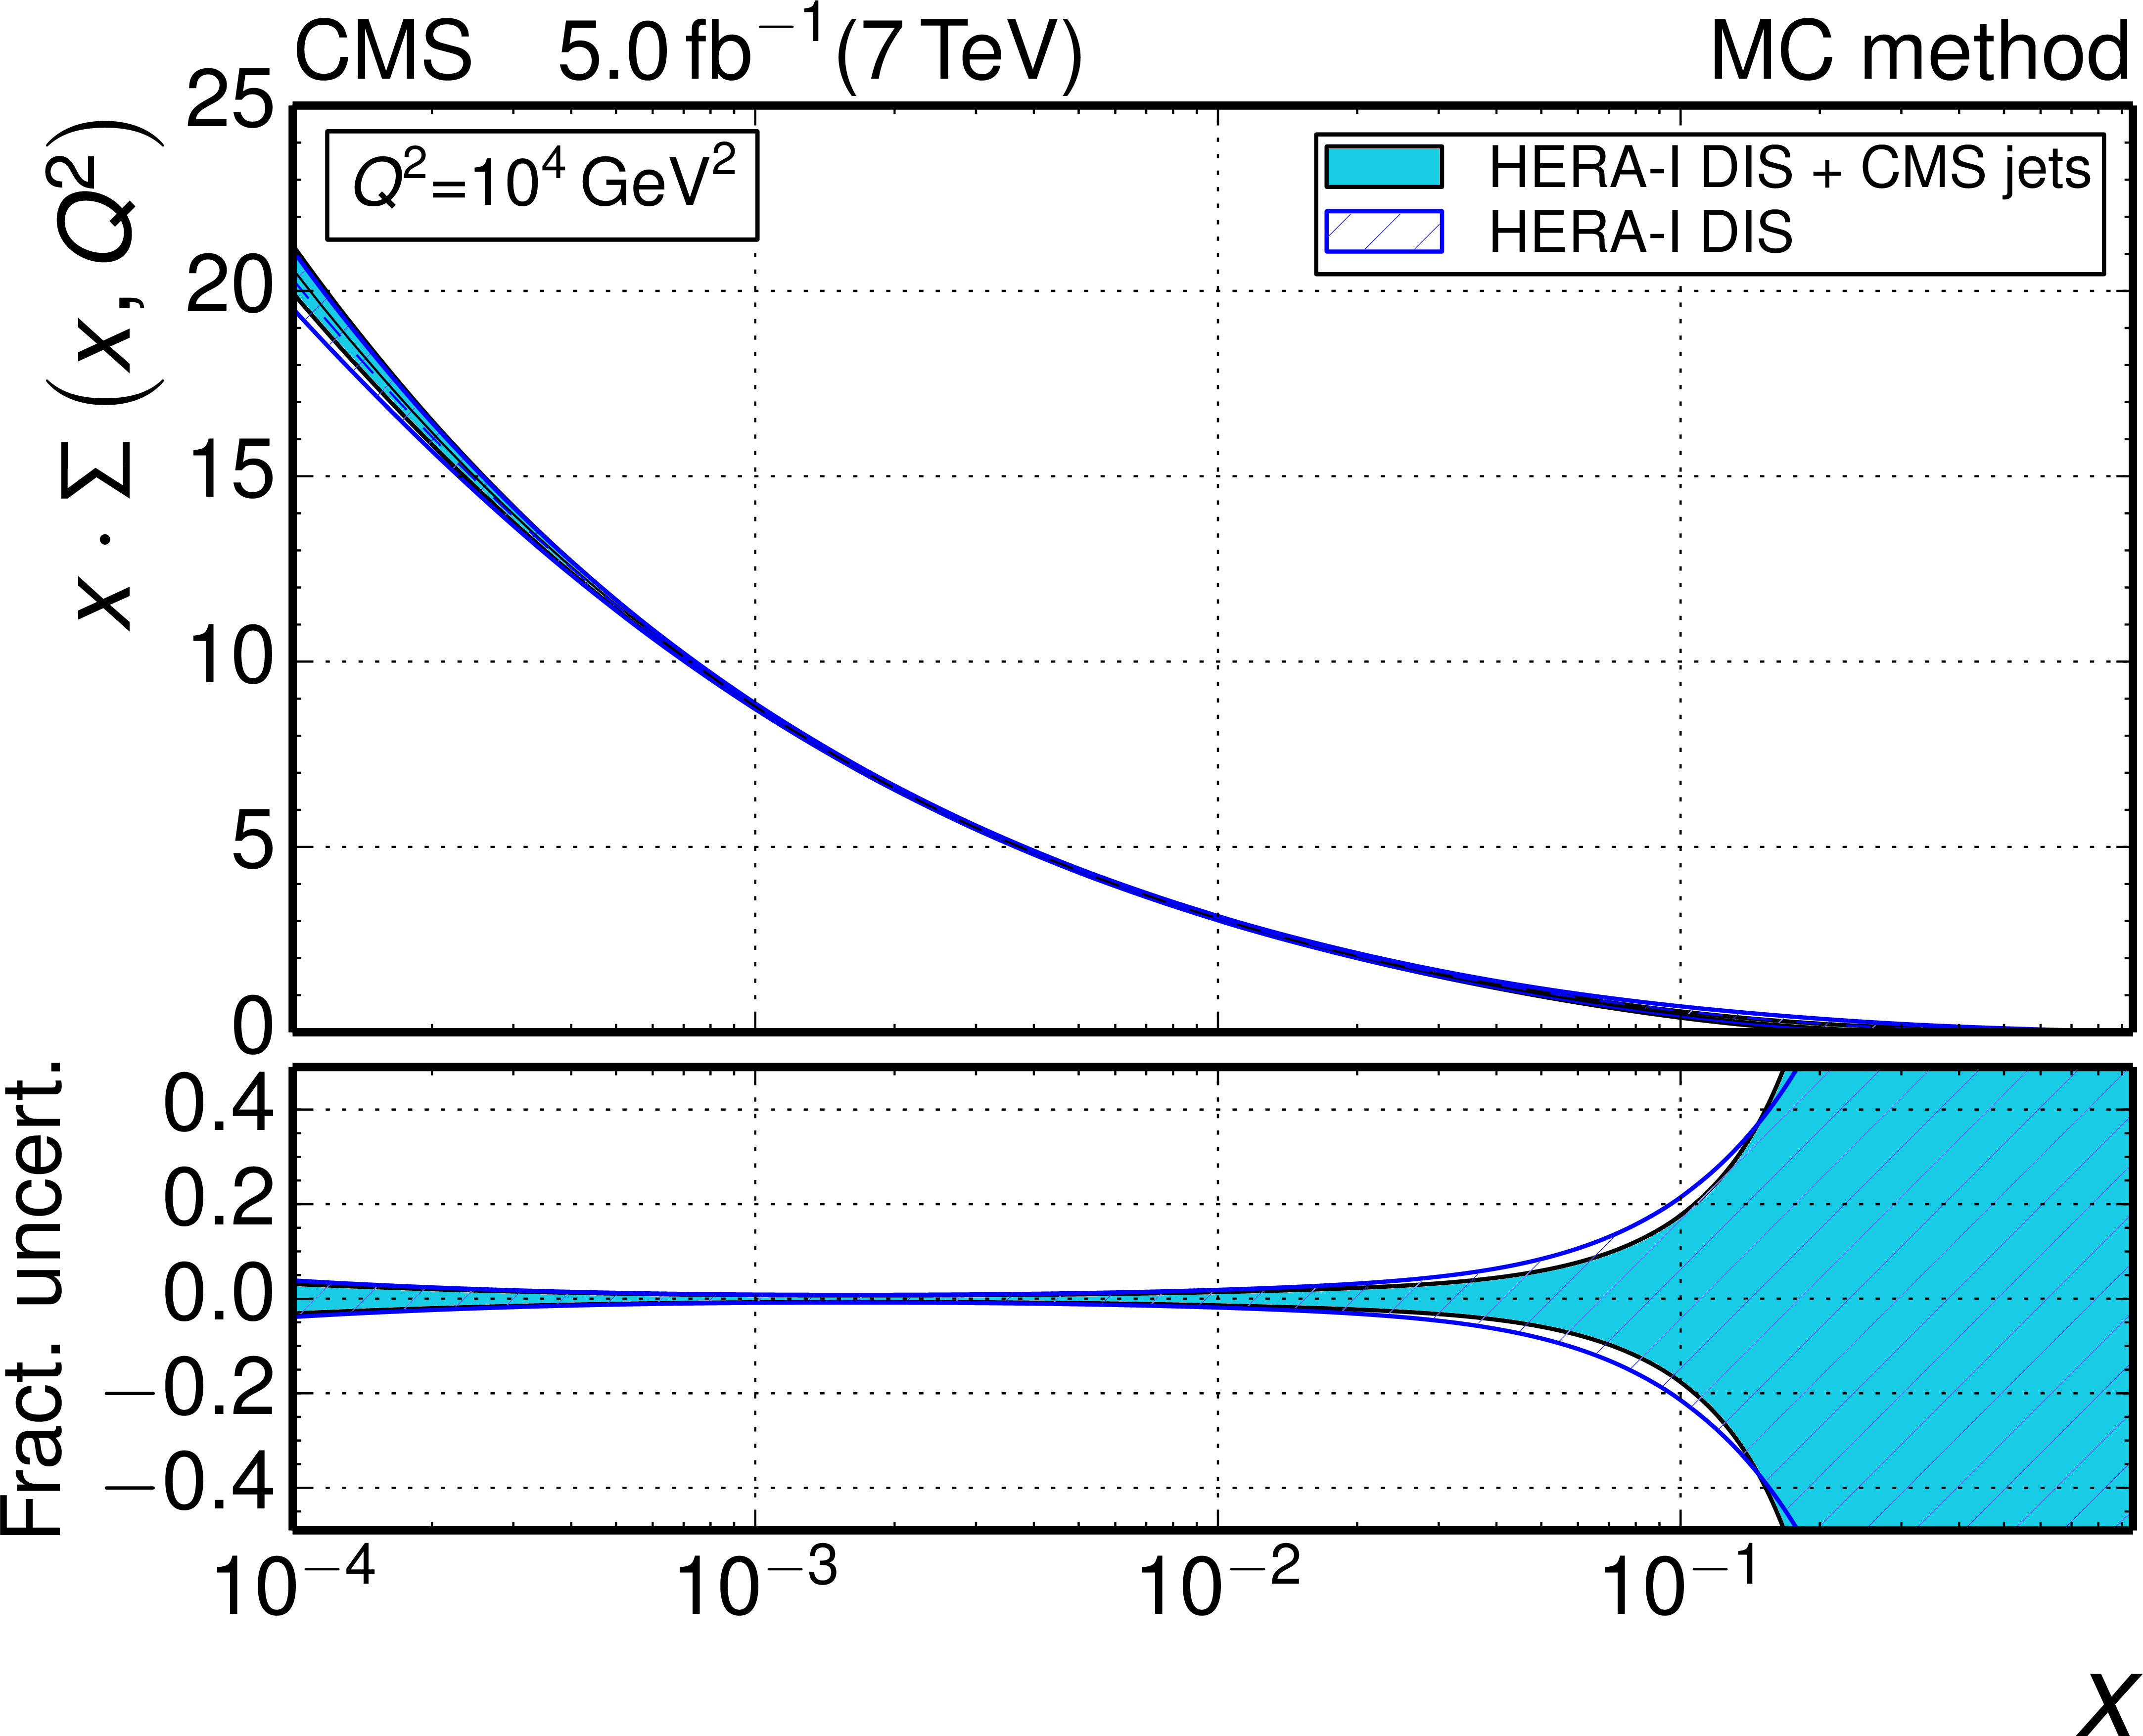
Figure 16-a:
The gluon (a), sea quark (b), u valence quark (c), and d valence quark (d) PDFs as a function of $x$ as derived from HERA-I inclusive DIS data alone (dashed line) and in combination with CMS inclusive jet data (full line). The PDFs are determined employing the MC method with data-derived regularisation. The PDFs are evolved to $Q^2 =$ 10$^4$ GeV$^2$. Only the total uncertainty in the PDFs is shown (hatched and solid bands). |
png pdf |
Figure 16-b:
The gluon (a), sea quark (b), u valence quark (c), and d valence quark (d) PDFs as a function of $x$ as derived from HERA-I inclusive DIS data alone (dashed line) and in combination with CMS inclusive jet data (full line). The PDFs are determined employing the MC method with data-derived regularisation. The PDFs are evolved to $Q^2 =$ 10$^4$ GeV$^2$. Only the total uncertainty in the PDFs is shown (hatched and solid bands). |

png pdf |
Figure 16-c:
The gluon (a), sea quark (b), u valence quark (c), and d valence quark (d) PDFs as a function of $x$ as derived from HERA-I inclusive DIS data alone (dashed line) and in combination with CMS inclusive jet data (full line). The PDFs are determined employing the MC method with data-derived regularisation. The PDFs are evolved to $Q^2 =$ 10$^4$ GeV$^2$. Only the total uncertainty in the PDFs is shown (hatched and solid bands). |

png pdf |
Figure 16-d:
The gluon (a), sea quark (b), u valence quark (c), and d valence quark (d) PDFs as a function of $x$ as derived from HERA-I inclusive DIS data alone (dashed line) and in combination with CMS inclusive jet data (full line). The PDFs are determined employing the MC method with data-derived regularisation. The PDFs are evolved to $Q^2 =$ 10$^4$ GeV$^2$. Only the total uncertainty in the PDFs is shown (hatched and solid bands). |

png pdf |
Figure 17-a:
Overview of the gluon, sea, u valence, and d valence PDFs before (dashed line) and after (full line) including the CMS inclusive jet data into the fit. The plots show the PDF fit outcome from the HERAPDF method (a) and from the MC method with data-derived regularisation (b). The PDFs are shown at the starting scale $Q^2 =$ 1.9 GeV$^2$. The total uncertainty including the CMS inclusive jet data is shown as a band around the central fit result. |

png pdf |
Figure 17-b:
Overview of the gluon, sea, u valence, and d valence PDFs before (dashed line) and after (full line) including the CMS inclusive jet data into the fit. The plots show the PDF fit outcome from the HERAPDF method (a) and from the MC method with data-derived regularisation (b). The PDFs are shown at the starting scale $Q^2 =$ 1.9 GeV$^2$. The total uncertainty including the CMS inclusive jet data is shown as a band around the central fit result. |

png pdf |
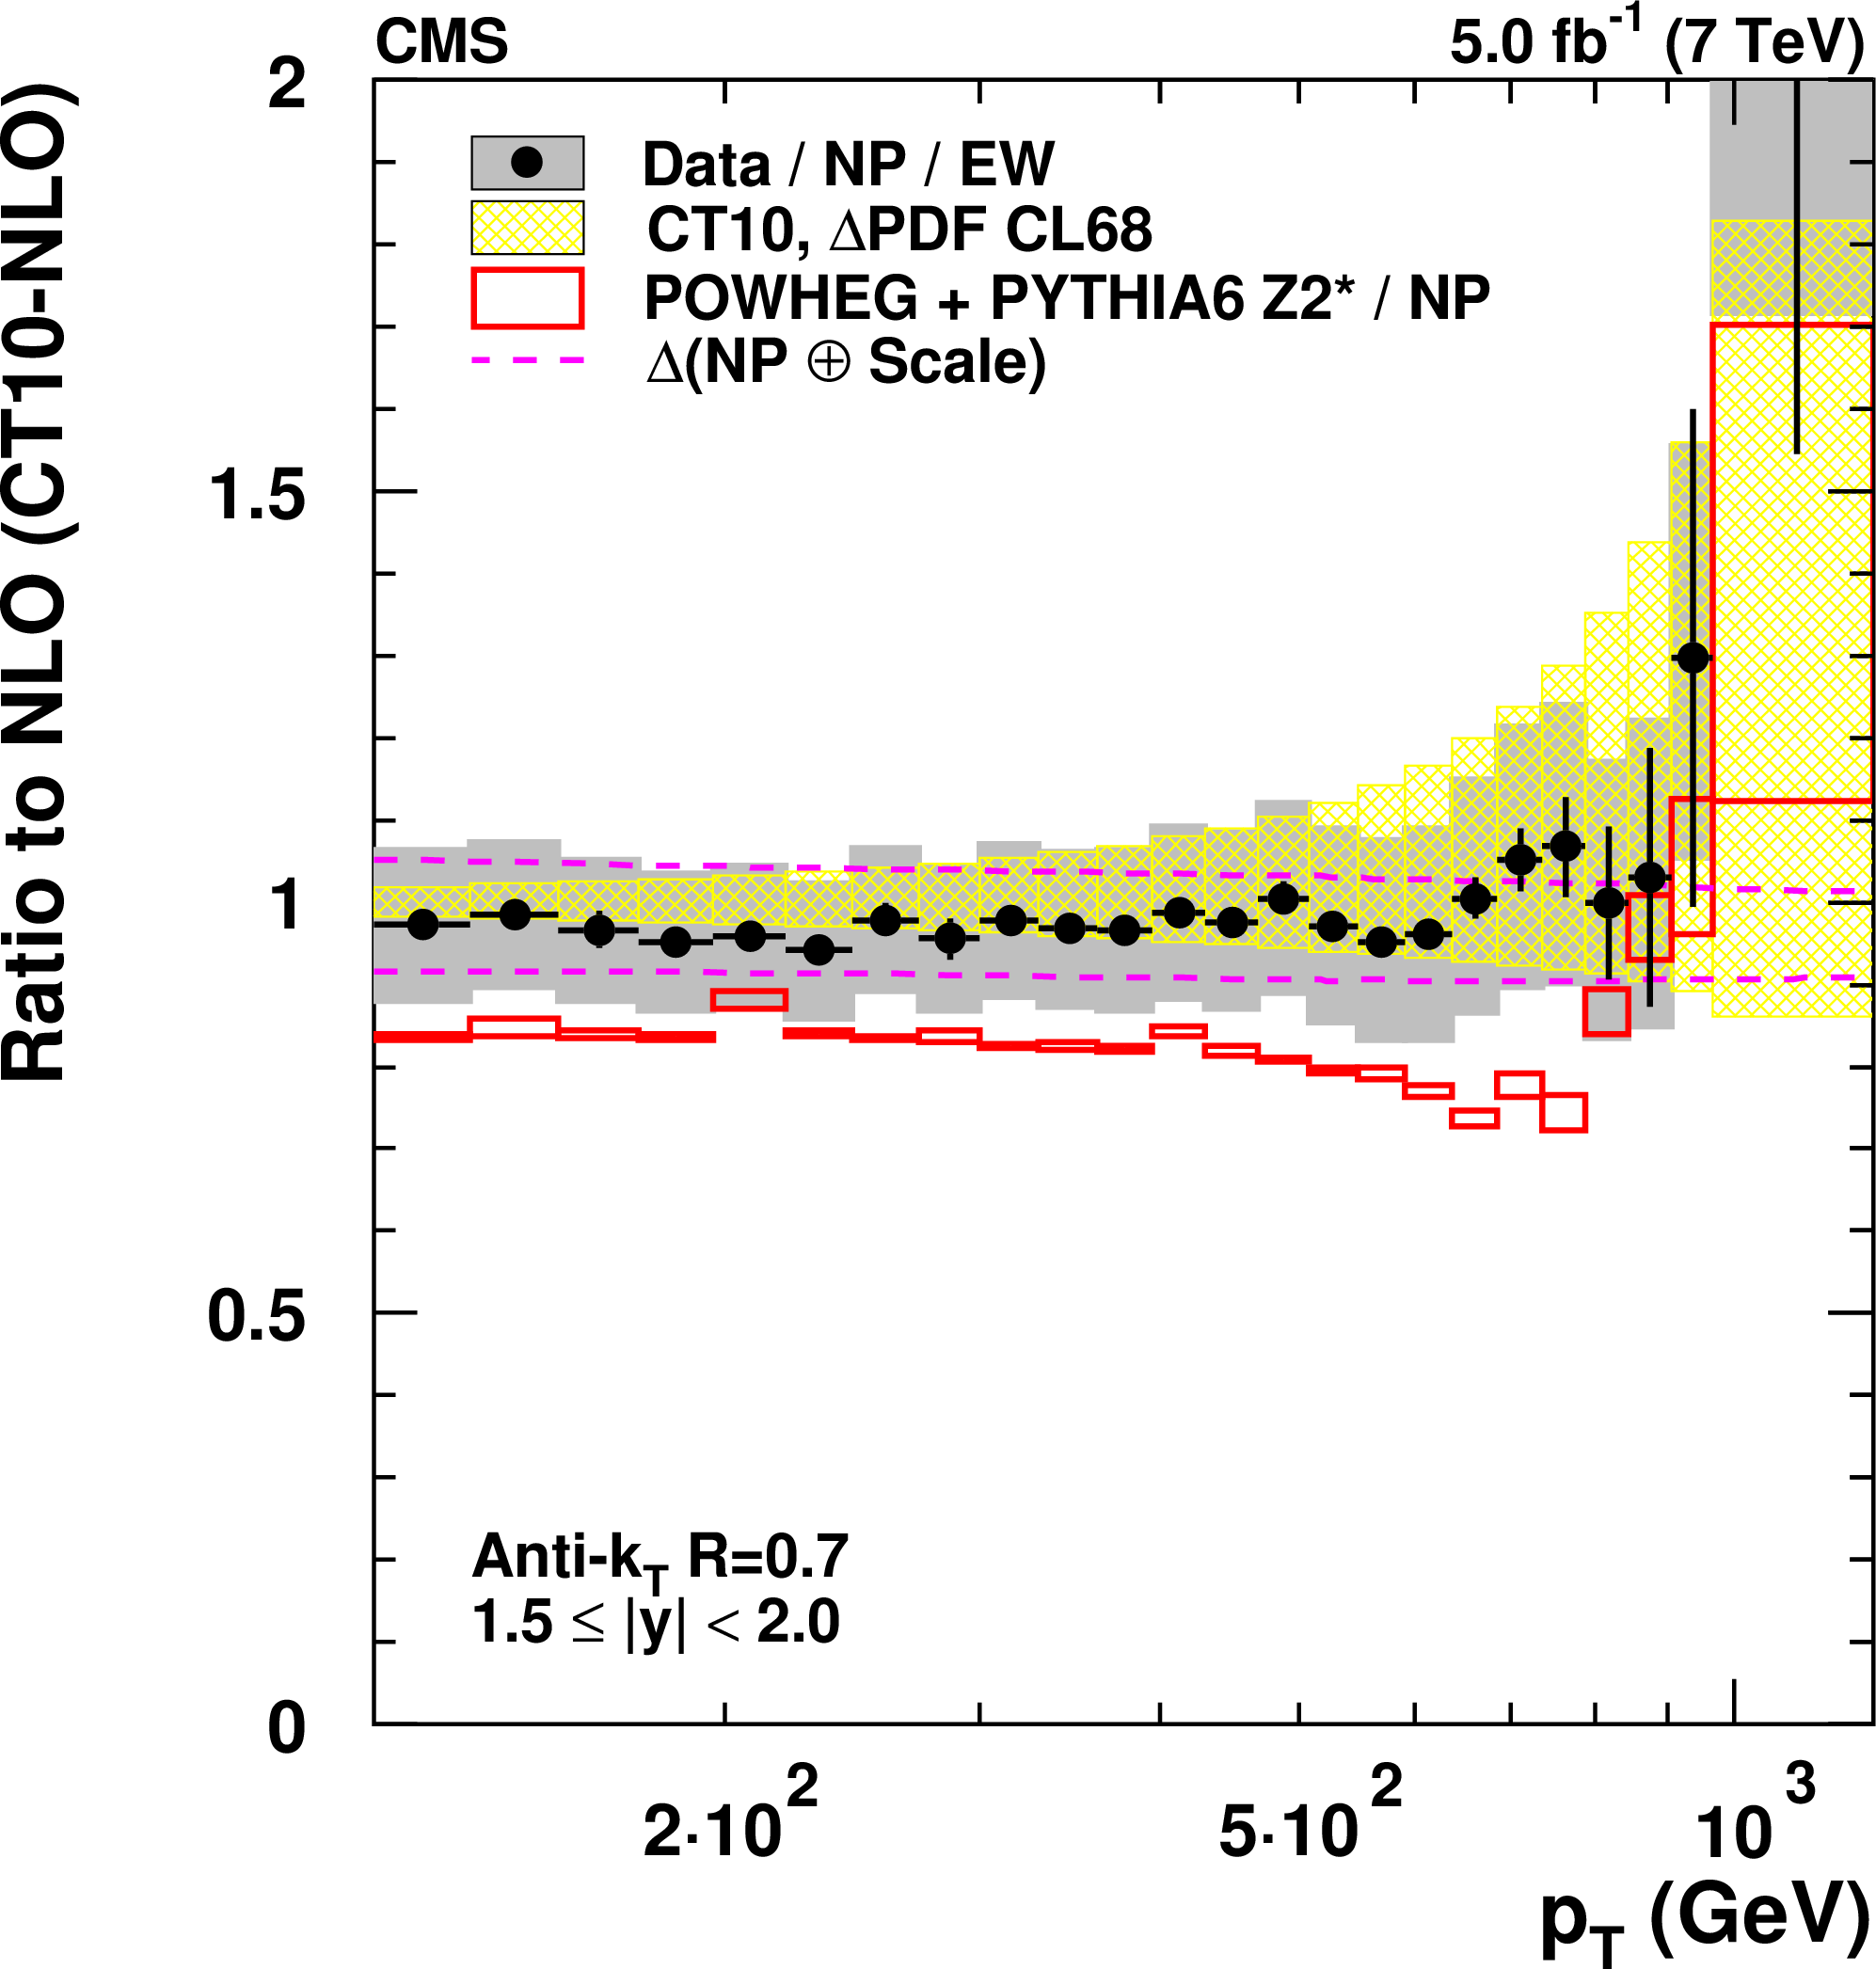
Figure 18-a:
Ratio of data to pQCD at NLO with the CT10-NLO PDF set multiplied by electroweak and NP corrections for the five bins in rapidity together with bands representing the CT10 PDF uncertainty (hatched), and the quadratically added scale and NP uncertainty (dashed lines). In addition, the ratio of the prediction by POWHEG + PYTHIA-6 tune Z2* at particle level is shown with boxes indicating the statistical uncertainty. The error bars and the grey boxes correspond to the statistical and systematic uncertainty in the data. |

png pdf |
Figure 18-b:
Ratio of data to pQCD at NLO with the CT10-NLO PDF set multiplied by electroweak and NP corrections for the five bins in rapidity together with bands representing the CT10 PDF uncertainty (hatched), and the quadratically added scale and NP uncertainty (dashed lines). In addition, the ratio of the prediction by POWHEG + PYTHIA-6 tune Z2* at particle level is shown with boxes indicating the statistical uncertainty. The error bars and the grey boxes correspond to the statistical and systematic uncertainty in the data. |

png pdf |
Figure 18-c:
Ratio of data to pQCD at NLO with the CT10-NLO PDF set multiplied by electroweak and NP corrections for the five bins in rapidity together with bands representing the CT10 PDF uncertainty (hatched), and the quadratically added scale and NP uncertainty (dashed lines). In addition, the ratio of the prediction by POWHEG + PYTHIA-6 tune Z2* at particle level is shown with boxes indicating the statistical uncertainty. The error bars and the grey boxes correspond to the statistical and systematic uncertainty in the data. |
png pdf |
Figure 18-d:
Ratio of data to pQCD at NLO with the CT10-NLO PDF set multiplied by electroweak and NP corrections for the five bins in rapidity together with bands representing the CT10 PDF uncertainty (hatched), and the quadratically added scale and NP uncertainty (dashed lines). In addition, the ratio of the prediction by POWHEG + PYTHIA-6 tune Z2* at particle level is shown with boxes indicating the statistical uncertainty. The error bars and the grey boxes correspond to the statistical and systematic uncertainty in the data. |
png pdf |
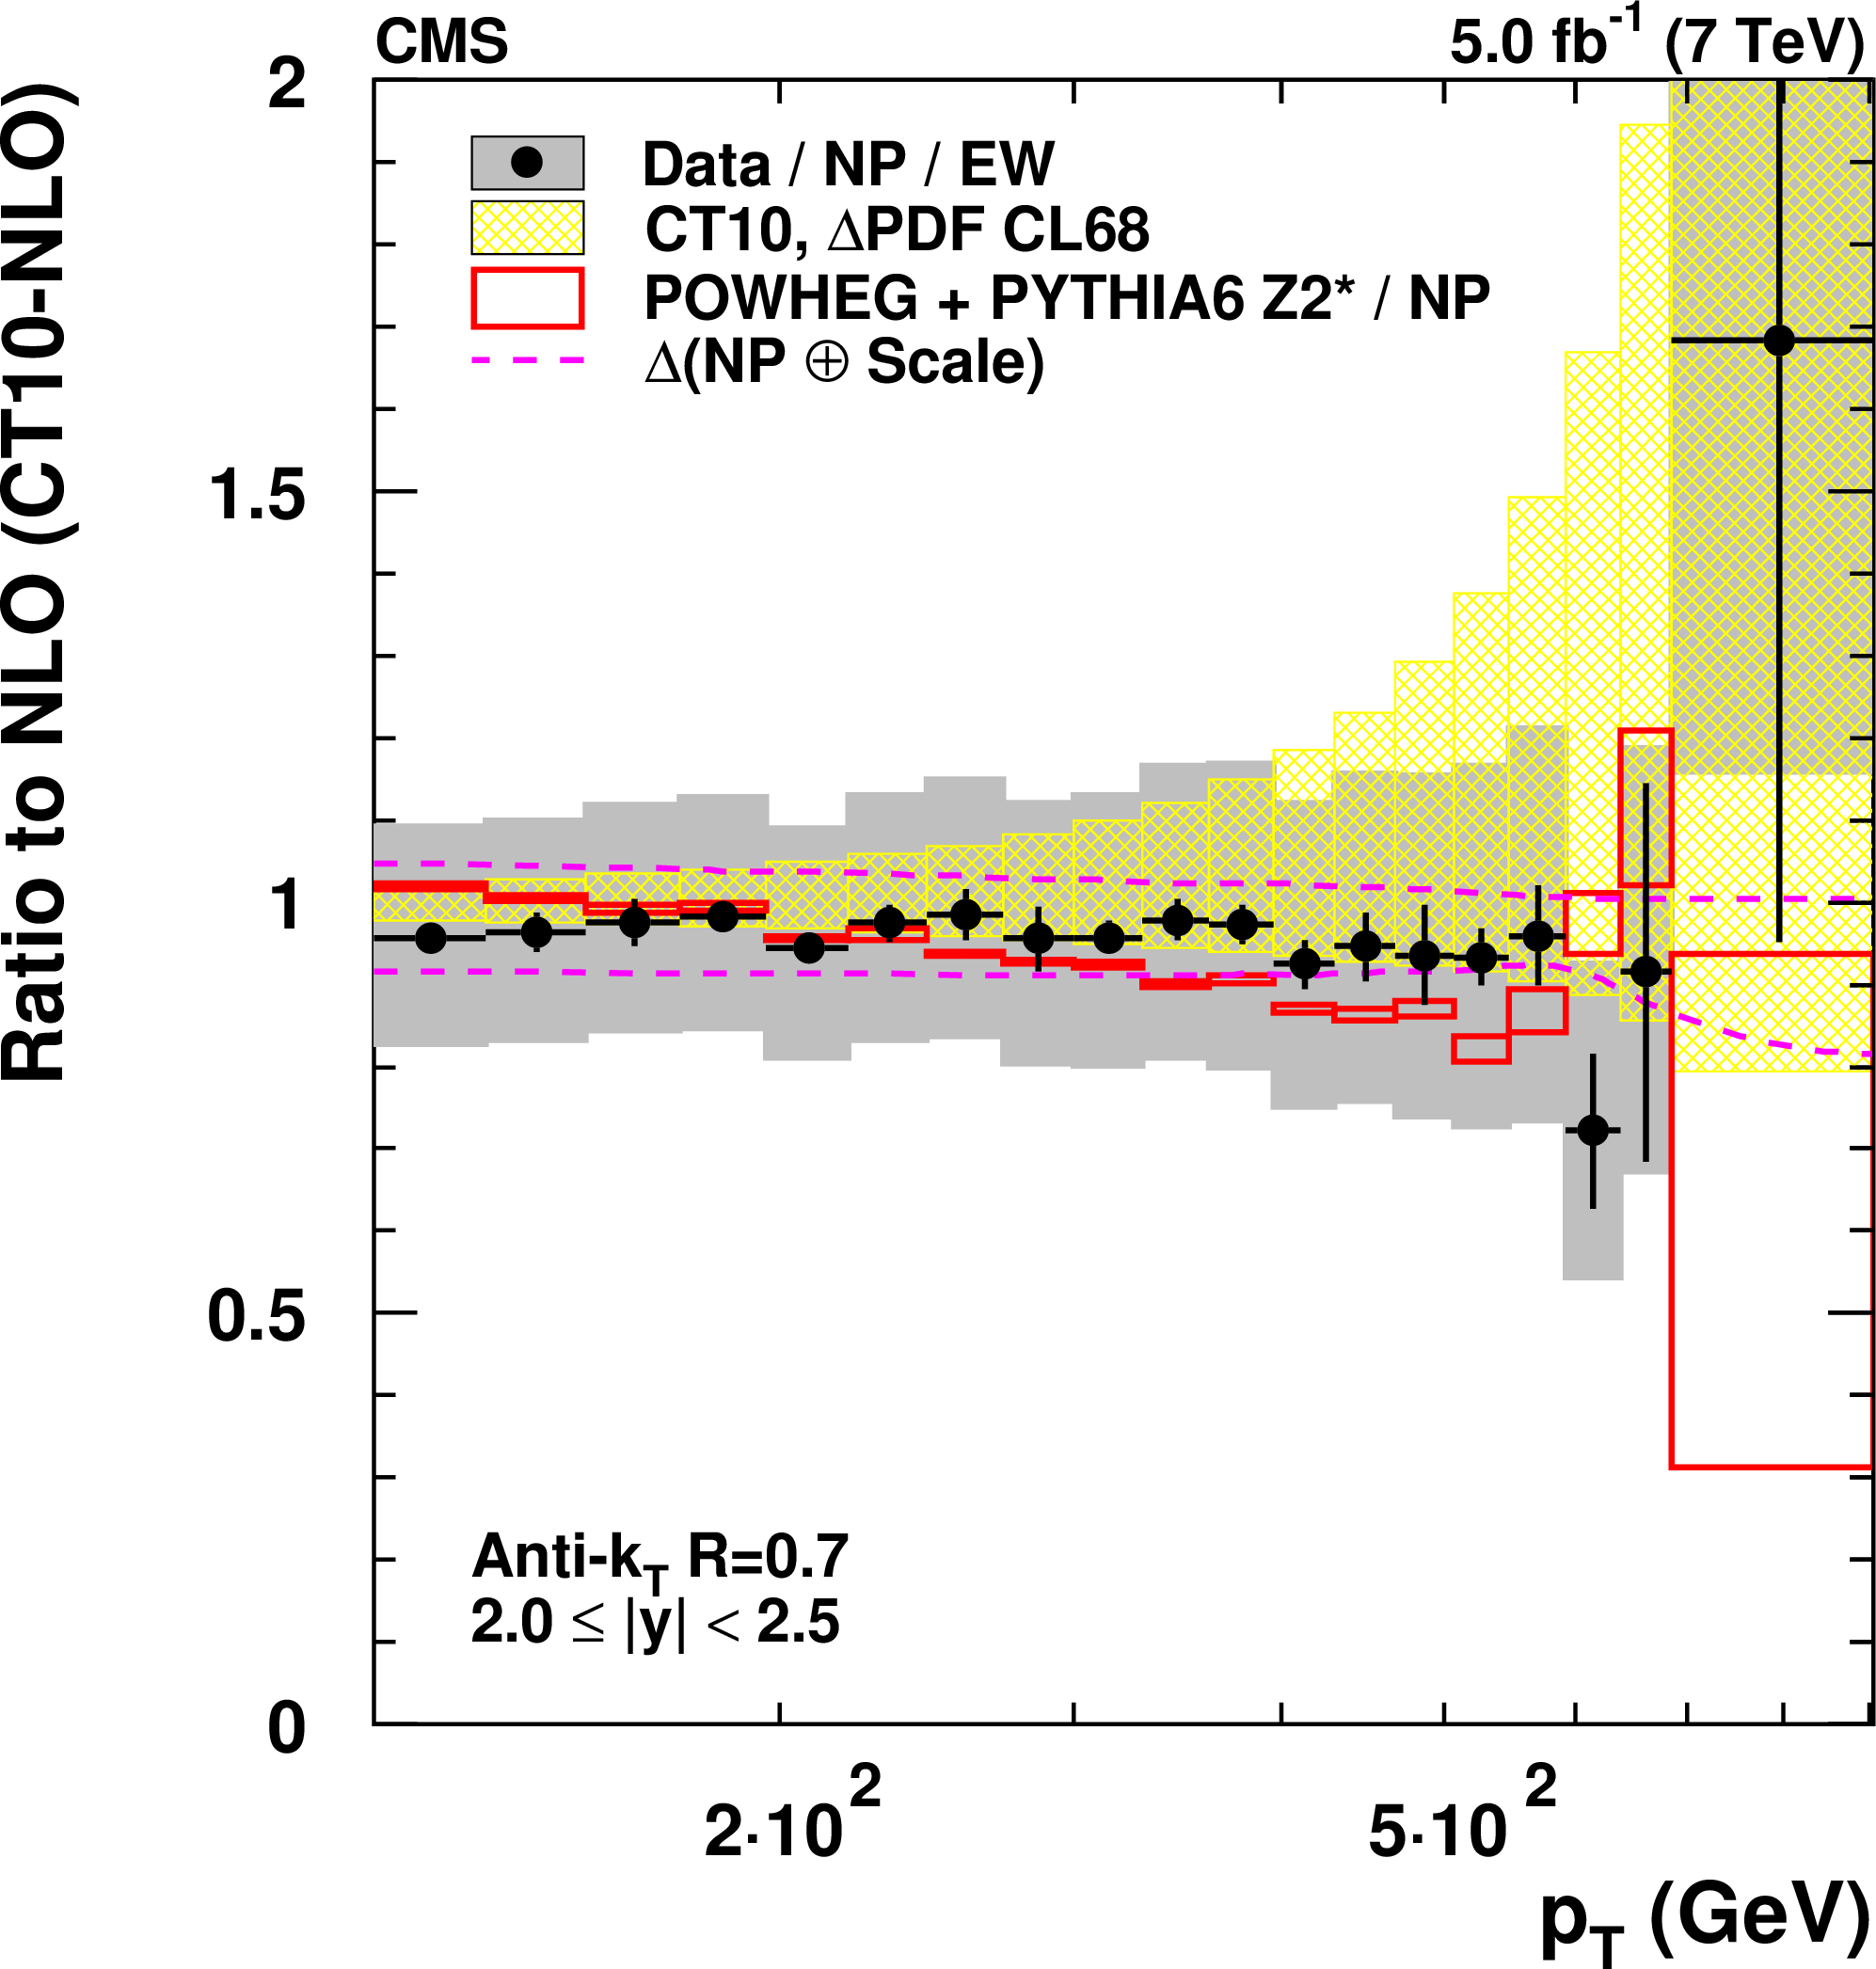
Figure 18-e:
Ratio of data to pQCD at NLO with the CT10-NLO PDF set multiplied by electroweak and NP corrections for the five bins in rapidity together with bands representing the CT10 PDF uncertainty (hatched), and the quadratically added scale and NP uncertainty (dashed lines). In addition, the ratio of the prediction by POWHEG + PYTHIA-6 tune Z2* at particle level is shown with boxes indicating the statistical uncertainty. The error bars and the grey boxes correspond to the statistical and systematic uncertainty in the data. |
|
|
Compact Muon Solenoid LHC, CERN |
|

|

|

|

|

|