

Compact Muon Solenoid
LHC, CERN
| CMS-SUS-10-003 ; CERN-PH-EP-2010-084 | ||
| Search for Supersymmetry in pp Collisions at 7 TeV in Events with Jets and Missing Transverse Energy | ||
| CMS Collaboration | ||
| 9 January 2011 | ||
| Phys. Lett. B 698 (2011) 196-218 | ||
| Abstract: A search for supersymmetry with R-parity conservation in proton-proton collisions at a centre-of-mass energy of 7 TeV is presented. The data correspond to an integrated luminosity of 35 inverse picobarns collected by the CMS experiment at the LHC. The search is performed in events with jets and significant missing transverse energy, characteristic of the decays of heavy, pair-produced squarks and gluinos. The primary background, from standard model multijet production, is reduced by several orders of magnitude to a negligible level by the application of a set of robust kinematic requirements. With this selection, the data are consistent with the standard model backgrounds, namely t t-bar, W + jet and Z + jet production, which are estimated from data control samples. Limits are set on the parameters of the constrained minimal supersymmetric extension of the standard model. These limits extend those set previously by experiments at the Tevatron and LEP colliders. | ||
| Links: e-print arXiv:1101.1628 [hep-ex] (PDF) ; CDS record ; inSPIRE record ; Public twiki page ; CADI line (restricted) ; | ||
| Figures | |

png pdf |
Figure 1:
$H_\text{T}$ distribution after preselection, for data as well as for all standard model backgrounds and two SUSY signal samples with parameter sets LM0 and LM1, normalized to an integrated luminosity of 35pb$^{-1}$. The hatched area corresponds to the uncertainty in the SM estimate as defined in Section 3.1. The SM distributions are only displayed for illustration purposes, as they are the result of Monte Carlo simulation, while the actual estimate of the background from SM processes in this search is based on data, as described in detail in Section 4. |

png pdf |
Figure 2-a:
Distribution of $ {\alpha _{\text {T}}} $ for di-jet events (a) and $\geq 3$-jet events (b), requiring $H_\text {T} >$ 350 GeV. Events with $ {\alpha _{\text {T}}} >$ 1.5 are included in the rightmost bin. In both figures the hatched area corresponds to the uncertainty in the SM estimate as defined in Section 3.1. |

png pdf |
Figure 2-b:
Distribution of $ {\alpha _{\text {T}}} $ for di-jet events (a) and $\geq 3$-jet events (b), requiring $H_\text {T} >$ 350 GeV. Events with $ {\alpha _{\text {T}}} >$ 1.5 are included in the rightmost bin. In both figures the hatched area corresponds to the uncertainty in the SM estimate as defined in Section 3.1. |

png pdf |
Figure 3-a:
Evolution of the ratio $ {R_{ {\alpha _{\text {T}}} }} $ as a function of $H_\text {T}$ for events with $N_{\mathrm {jet}}\geq 2$; (a) for data and SM backgrounds, and two different values of $ {\alpha _{\text {T}}} $, as well as for an independent $ {{\text W} {\rightarrow }\mu \nu }$+ jets control sample (Section 4.2); (b) for the SM backgrounds added to the SUSY signal expected from each of the two benchmark points, LM0 and LM1. Markers are offset horizontally for improved visibility. |

png pdf |
Figure 3-b:
Evolution of the ratio $ {R_{ {\alpha _{\text {T}}} }} $ as a function of $H_\text {T}$ for events with $N_{\mathrm {jet}}\geq 2$; (a) for data and SM backgrounds, and two different values of $ {\alpha _{\text {T}}} $, as well as for an independent $ {{\text W} {\rightarrow }\mu \nu }$+ jets control sample (Section 4.2); (b) for the SM backgrounds added to the SUSY signal expected from each of the two benchmark points, LM0 and LM1. Markers are offset horizontally for improved visibility. |

png pdf |
Figure 4-a:
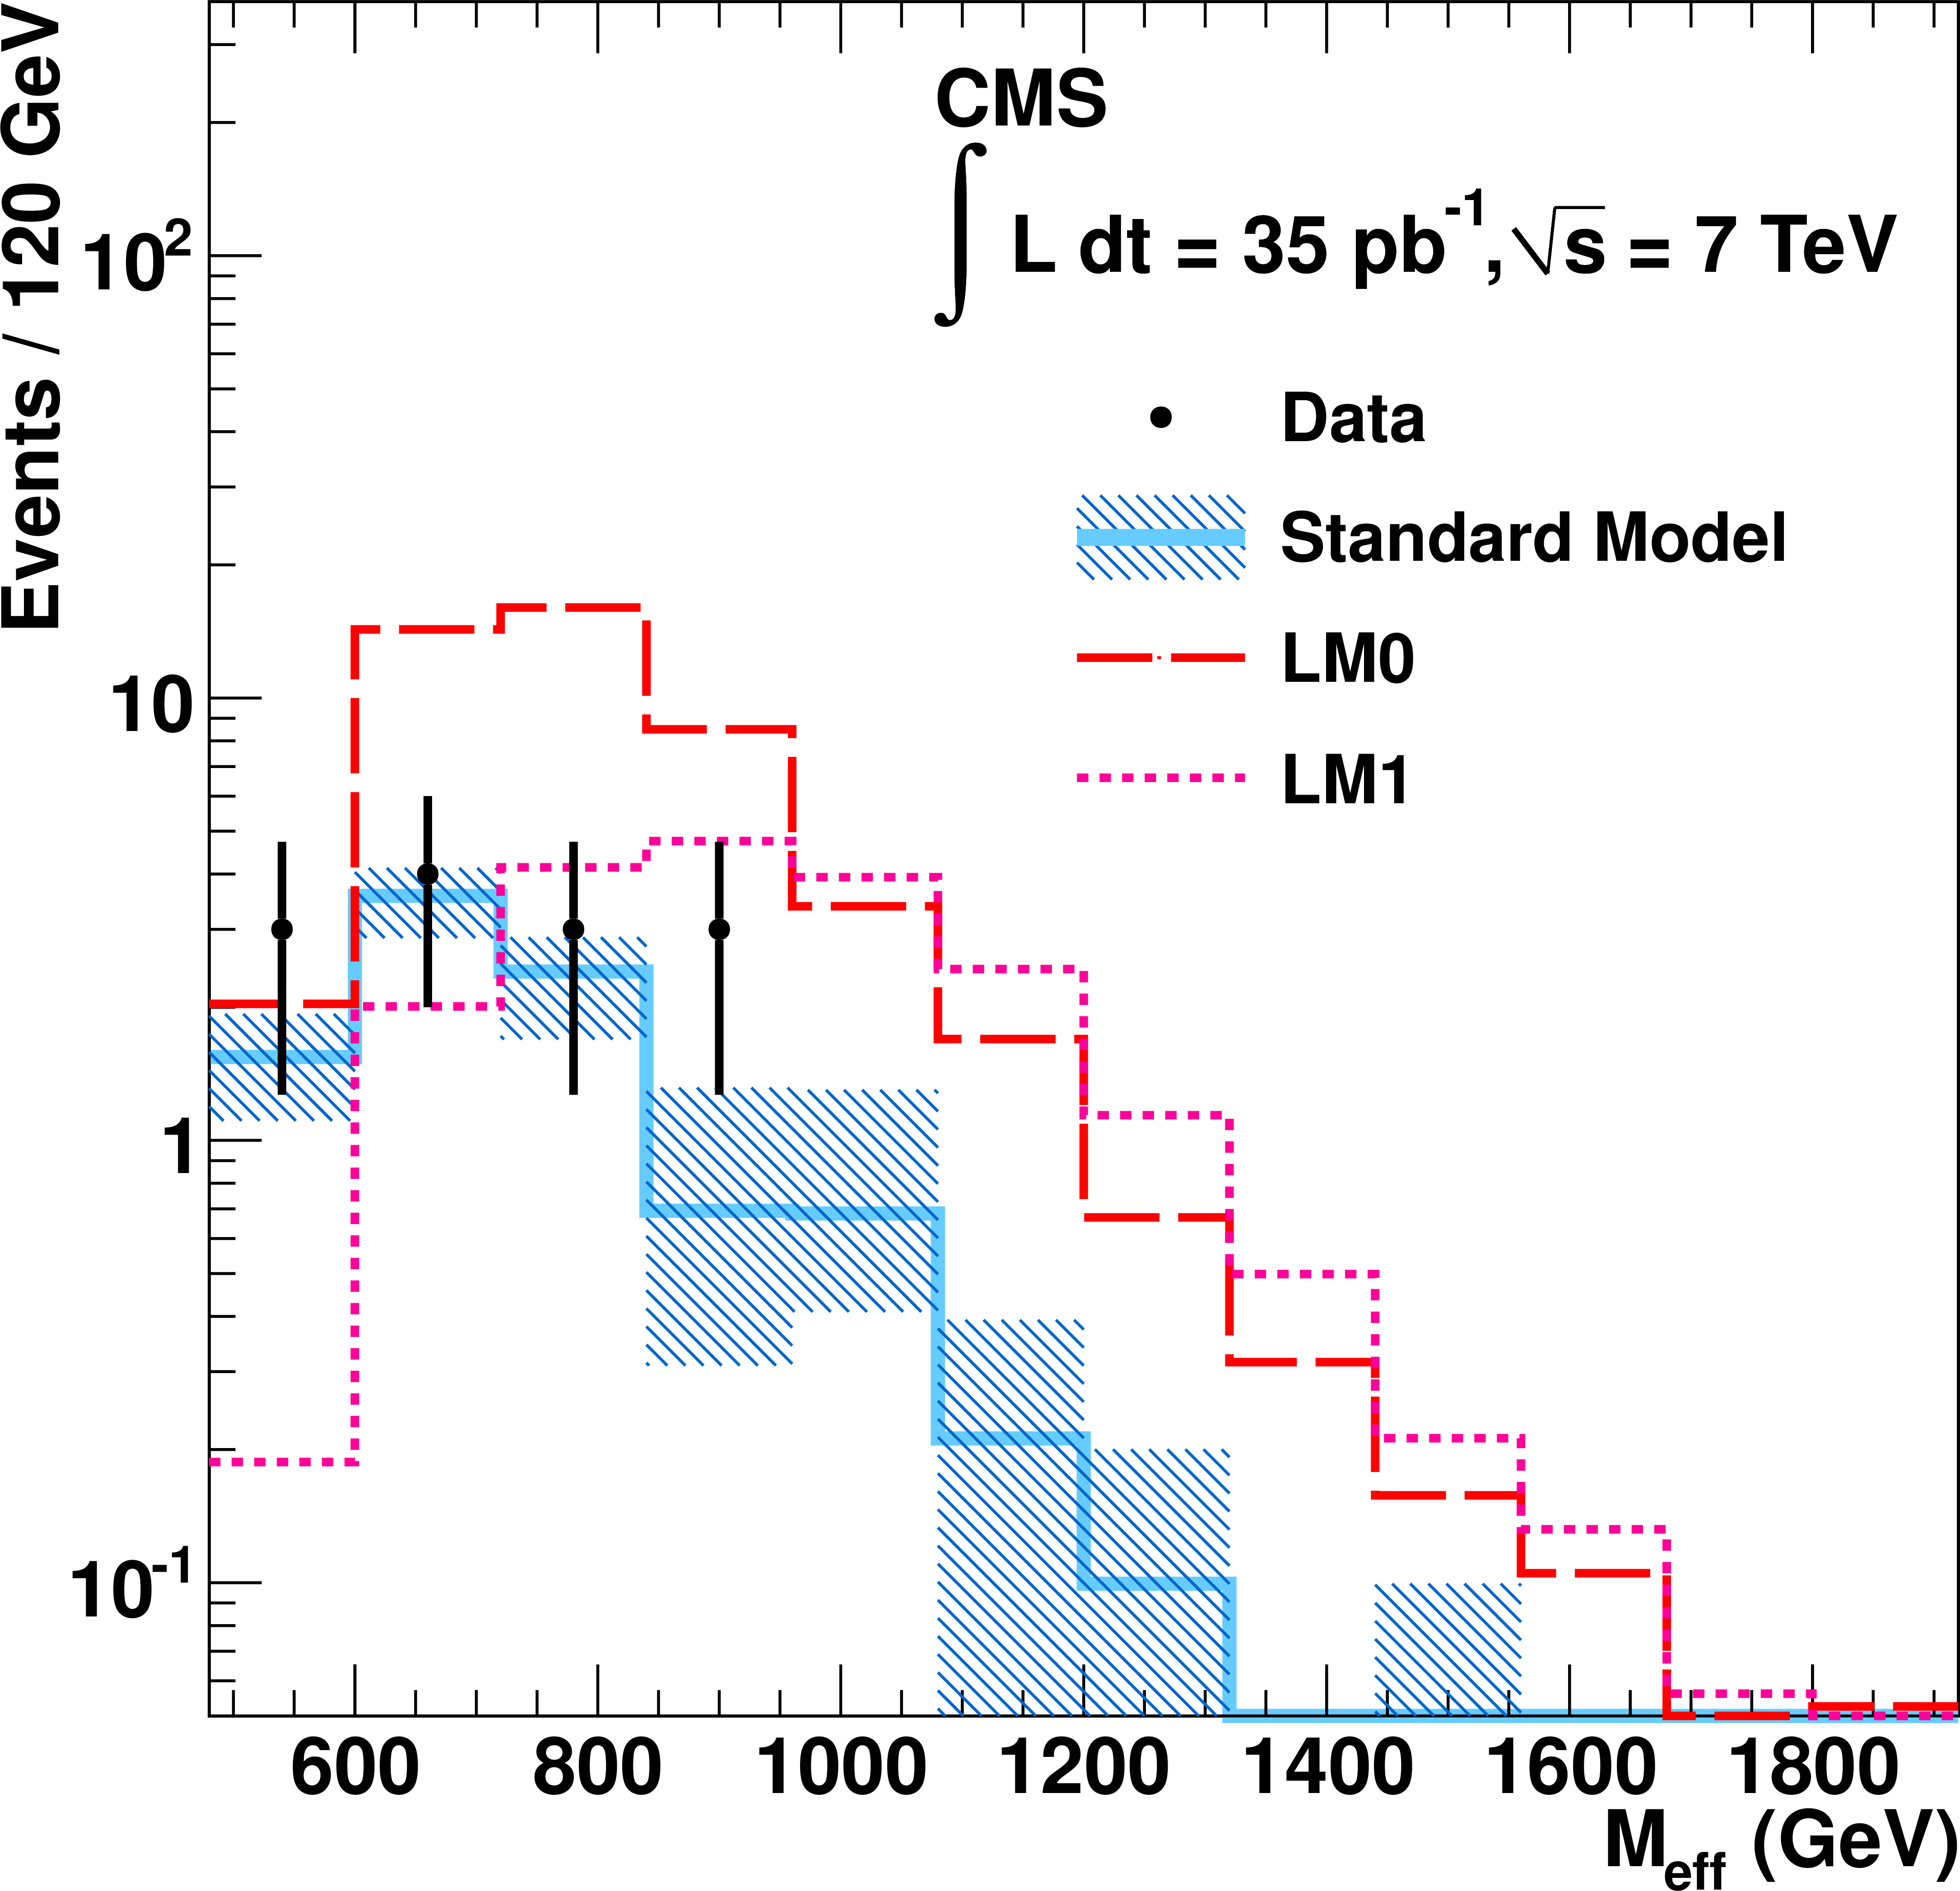
a: the $ {\Delta \phi }^*$ distribution after all selection requirements. b: the effective mass $M_{\rm eff}$ distribution after all selection requirements for SM processes and two low mass SUSY benchmark points. In both figures the hatched area corresponds to the uncertainty in the SM estimate as defined in Section 3.1. |
png pdf |
Figure 4-b:
a: the $ {\Delta \phi }^*$ distribution after all selection requirements. b: the effective mass $M_{\rm eff}$ distribution after all selection requirements for SM processes and two low mass SUSY benchmark points. In both figures the hatched area corresponds to the uncertainty in the SM estimate as defined in Section 3.1. |

png pdf |
Figure 5:
Measured (red line) and expected (dashed blue line) 95% CL exclusion contour at NLO in the CMSSM $(m_0, m_{1/2})$ plane for $\tan\beta = 3$, $A_0 = 0$ and $\text{ sign } (\mu ) > 0$. The measured LO exclusion contour is shown as well (dot-dashed green line). The area below the curves is excluded by this measurement. Exclusion limits obtained from previous experiments are presented as filled areas in the plot. Grey lines correspond to constant squark and gluino masses. The plot also shows the two benchmark points LM0 and LM1 for comparison. |
|
|
Compact Muon Solenoid LHC, CERN |
|

|

|

|

|

|