

Compact Muon Solenoid
LHC, CERN
| CMS-SUS-12-028 ; CERN-PH-EP-2013-037 | ||
| Search for supersymmetry in hadronic final states with missing transverse energy using the variables $\alpha_T$ and b-quark multiplicity in pp collisions at $\sqrt{s}$ = 8 TeV | ||
| CMS Collaboration | ||
| 12 March 2013 | ||
| Eur. Phys. J. C 73 (2013) 2568 | ||
| Abstract: An inclusive search for supersymmetric processes that produce final states with jets and missing transverse energy is performed in pp collisions at a centre-of-mass energy of 8 TeV. The data sample corresponds to an integrated luminosity of 11.7 inverse femtobarns collected by the CMS experiment at the LHC. In this search, a dimensionless kinematic variable, $\alpha_T$, is used to discriminate between events with genuine and misreconstructed missing transverse energy. The search is based on an examination of the number of reconstructed jets per event, the scalar sum of transverse energies of these jets, and the number of these jets identified as originating from bottom quarks. No significant excess of events over the standard model expectation is found. Exclusion limits are set in the parameter space of simplified models, with a special emphasis on both compressed-spectrum scenarios and direct or gluino-induced production of third-generation squarks. | ||
| Links: e-print arXiv:1303.2985 [hep-ex] (PDF) ; CDS record ; inSPIRE record ; Public twiki page ; CADI line (restricted) ; | ||
| Figures | |
png pdf |
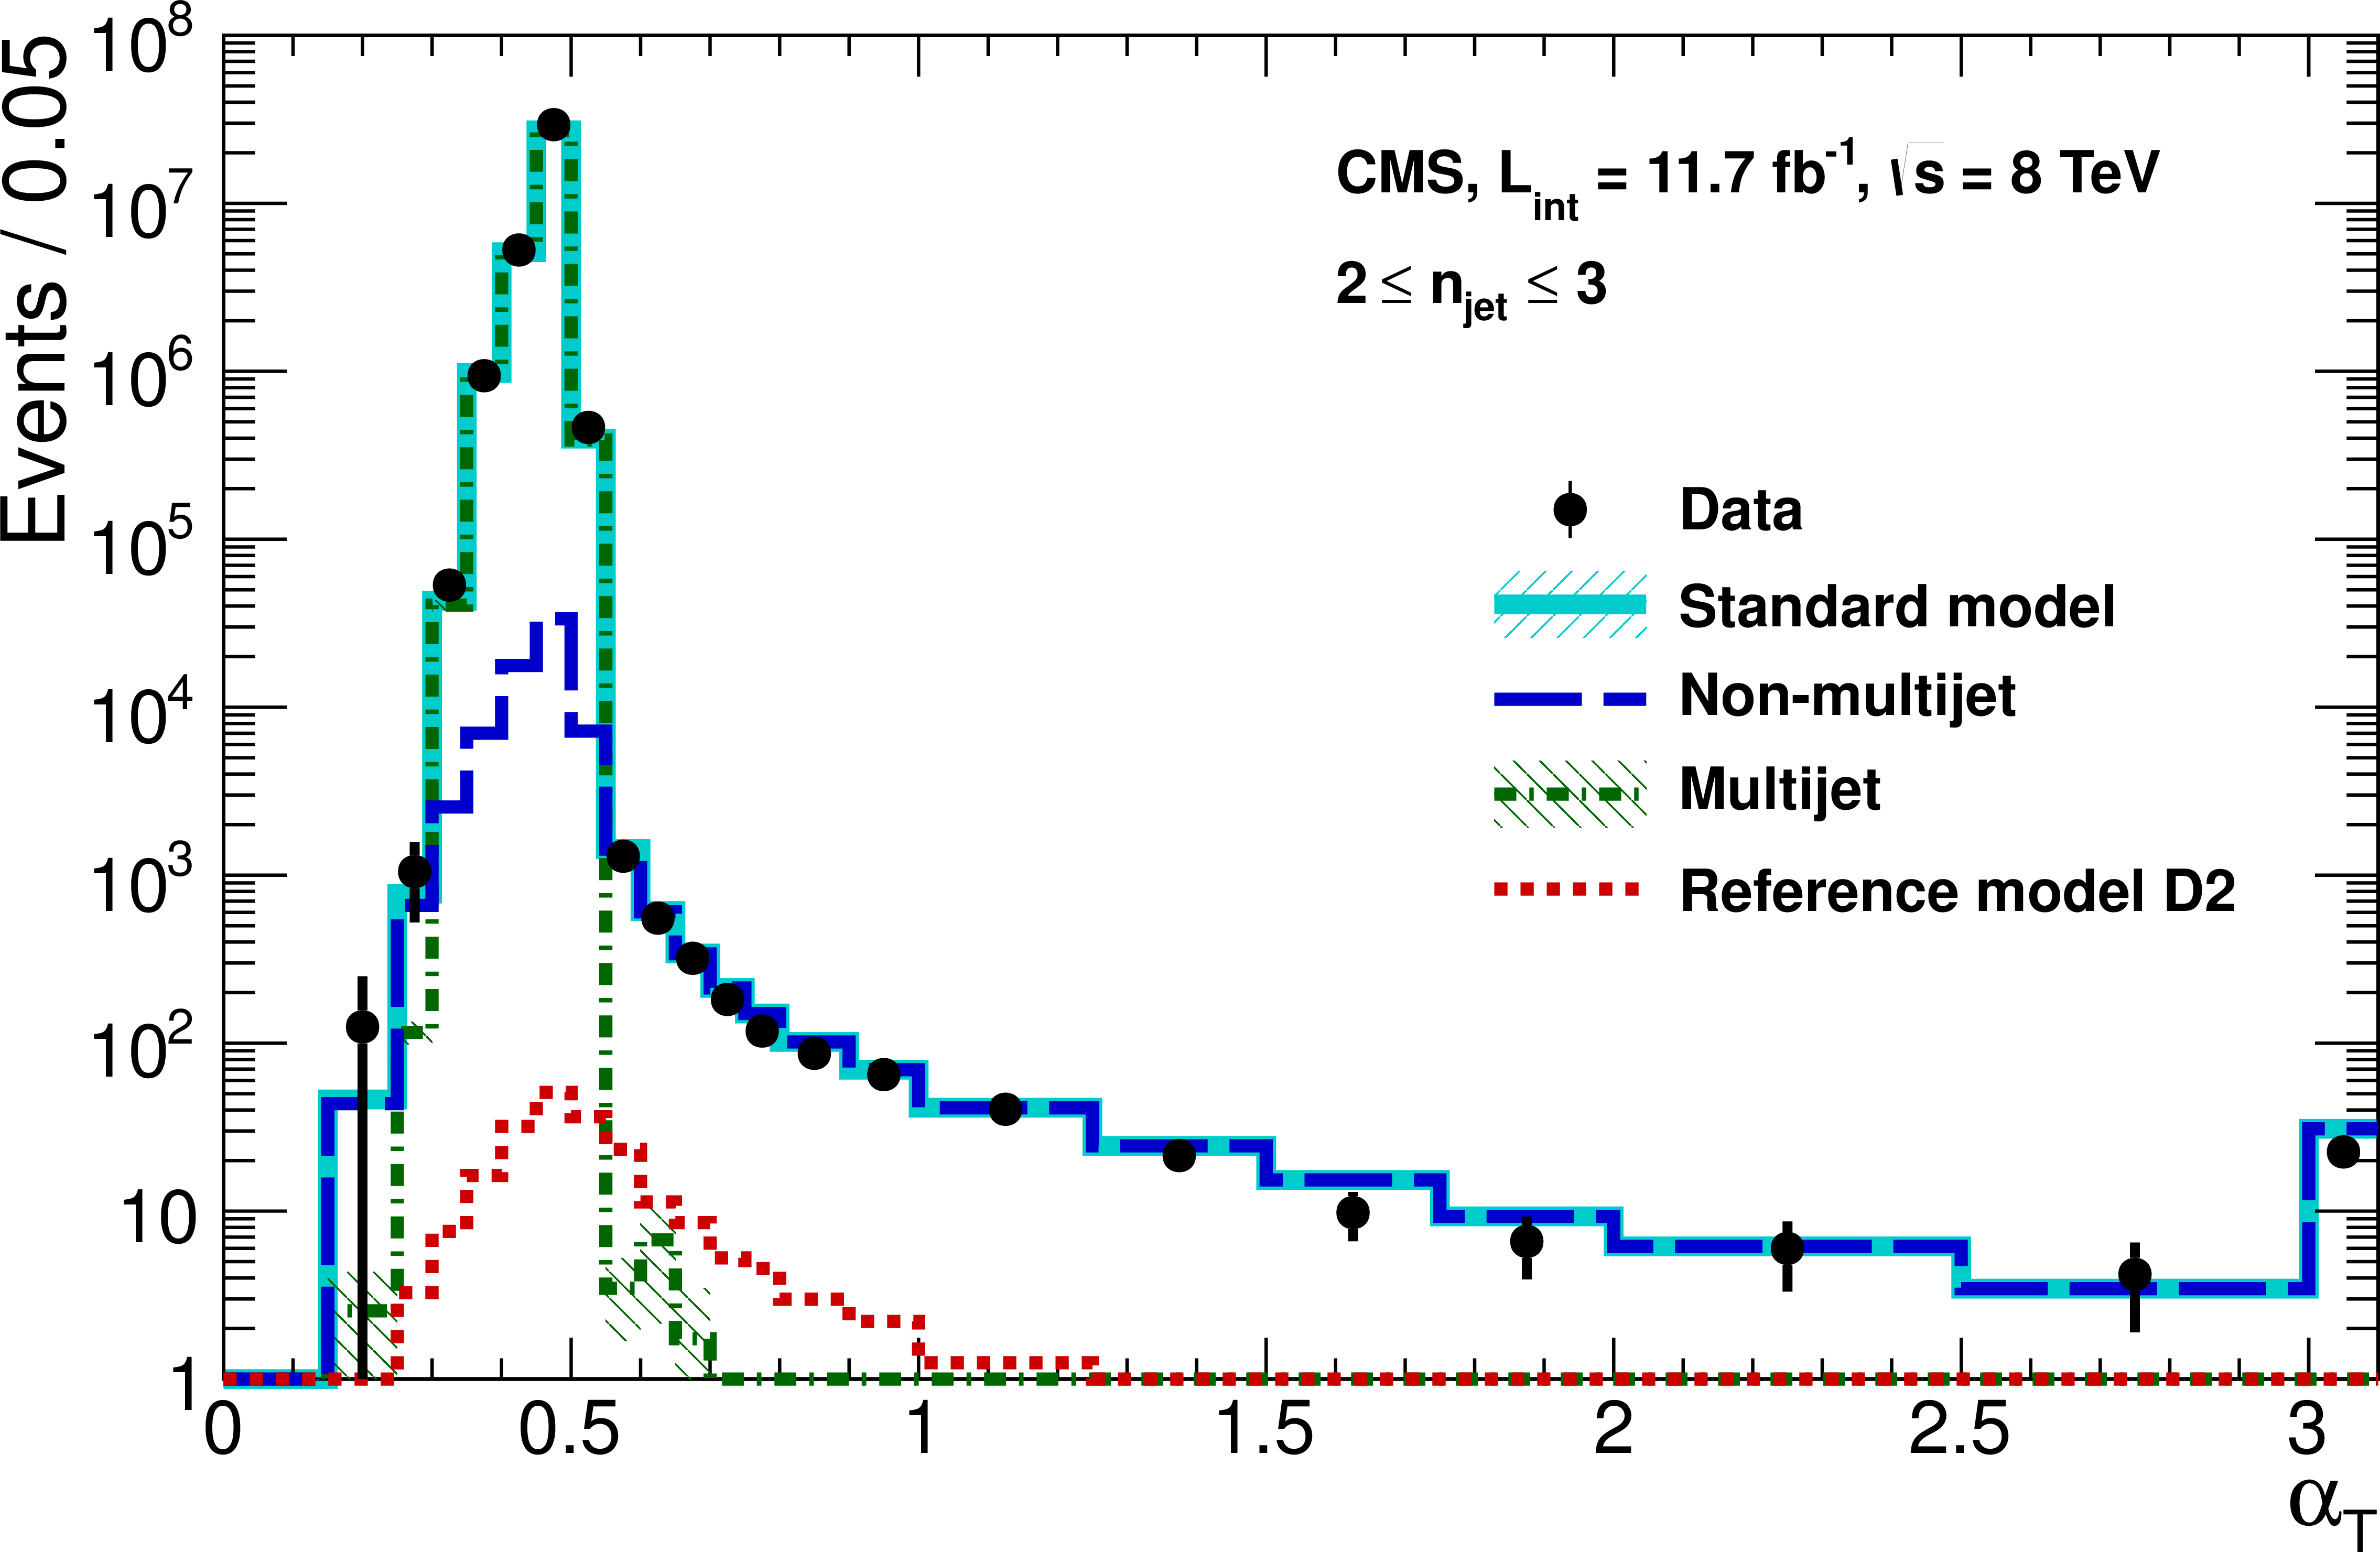
Figure 1-a:
The $ {\alpha _{\text {T}}} $ distributions of events with $H_\text {T} >$ 375 GeV that satisfy all the selection criteria described above except the $ {\alpha _{\text {T}}} $ requirement, categorised according to $ {2 \leq {n_{\text {jet}}} \leq 3} $ (a) and $ { {n_{\text {jet}}} \geq 4} $ (b). An inclusive set of trigger conditions is used to collect the events in data (black solid circles with error bars). Expected yields as given by simulation are also shown for multijet events (green dash-dotted line), non-multijet backgrounds with genuine $ {E_{\mathrm {T}}} $ as described in Section 5 (blue long-dashed line), the sum of all aforementioned SM processes (cyan solid line) and the reference signal model $\texttt {D2} $ (a, red dotted line) or $\texttt {G2} $ (b, red dotted line). The statistical uncertainties for the multijet and SM expectations are represented by the hatched areas (visible only for statistically limited bins). The final bin contains all events with $ {\alpha _{\text {T}}} > $ 3. |

png pdf |
Figure 1-b:
The $ {\alpha _{\text {T}}} $ distributions of events with $H_\text {T} >$ 375 GeV that satisfy all the selection criteria described above except the $ {\alpha _{\text {T}}} $ requirement, categorised according to $ {2 \leq {n_{\text {jet}}} \leq 3} $ (a) and $ { {n_{\text {jet}}} \geq 4} $ (b). An inclusive set of trigger conditions is used to collect the events in data (black solid circles with error bars). Expected yields as given by simulation are also shown for multijet events (green dash-dotted line), non-multijet backgrounds with genuine $ {E_{\mathrm {T}}} $ as described in Section 5 (blue long-dashed line), the sum of all aforementioned SM processes (cyan solid line) and the reference signal model $\texttt {D2} $ (a, red dotted line) or $\texttt {G2} $ (b, red dotted line). The statistical uncertainties for the multijet and SM expectations are represented by the hatched areas (visible only for statistically limited bins). The final bin contains all events with $ {\alpha _{\text {T}}} > $ 3. |

png pdf |
Figure 2-a:
Sets of closure tests that probe for possible $H_\text {T}$-dependent biases associated with the transfer factors obtained from simulation, for the two event categories satisfying $ {2 \leq {n_{\text {jet}}} \leq 3} $ (a) and $ { {n_{\text {jet}}} \geq 4} $ (b). Also shown are shaded bands that represent $H_\text {T}$-dependent systematic uncertainties. |

png pdf |
Figure 2-b:
Sets of closure tests that probe for possible $H_\text {T}$-dependent biases associated with the transfer factors obtained from simulation, for the two event categories satisfying $ {2 \leq {n_{\text {jet}}} \leq 3} $ (a) and $ { {n_{\text {jet}}} \geq 4} $ (b). Also shown are shaded bands that represent $H_\text {T}$-dependent systematic uncertainties. |
png pdf |
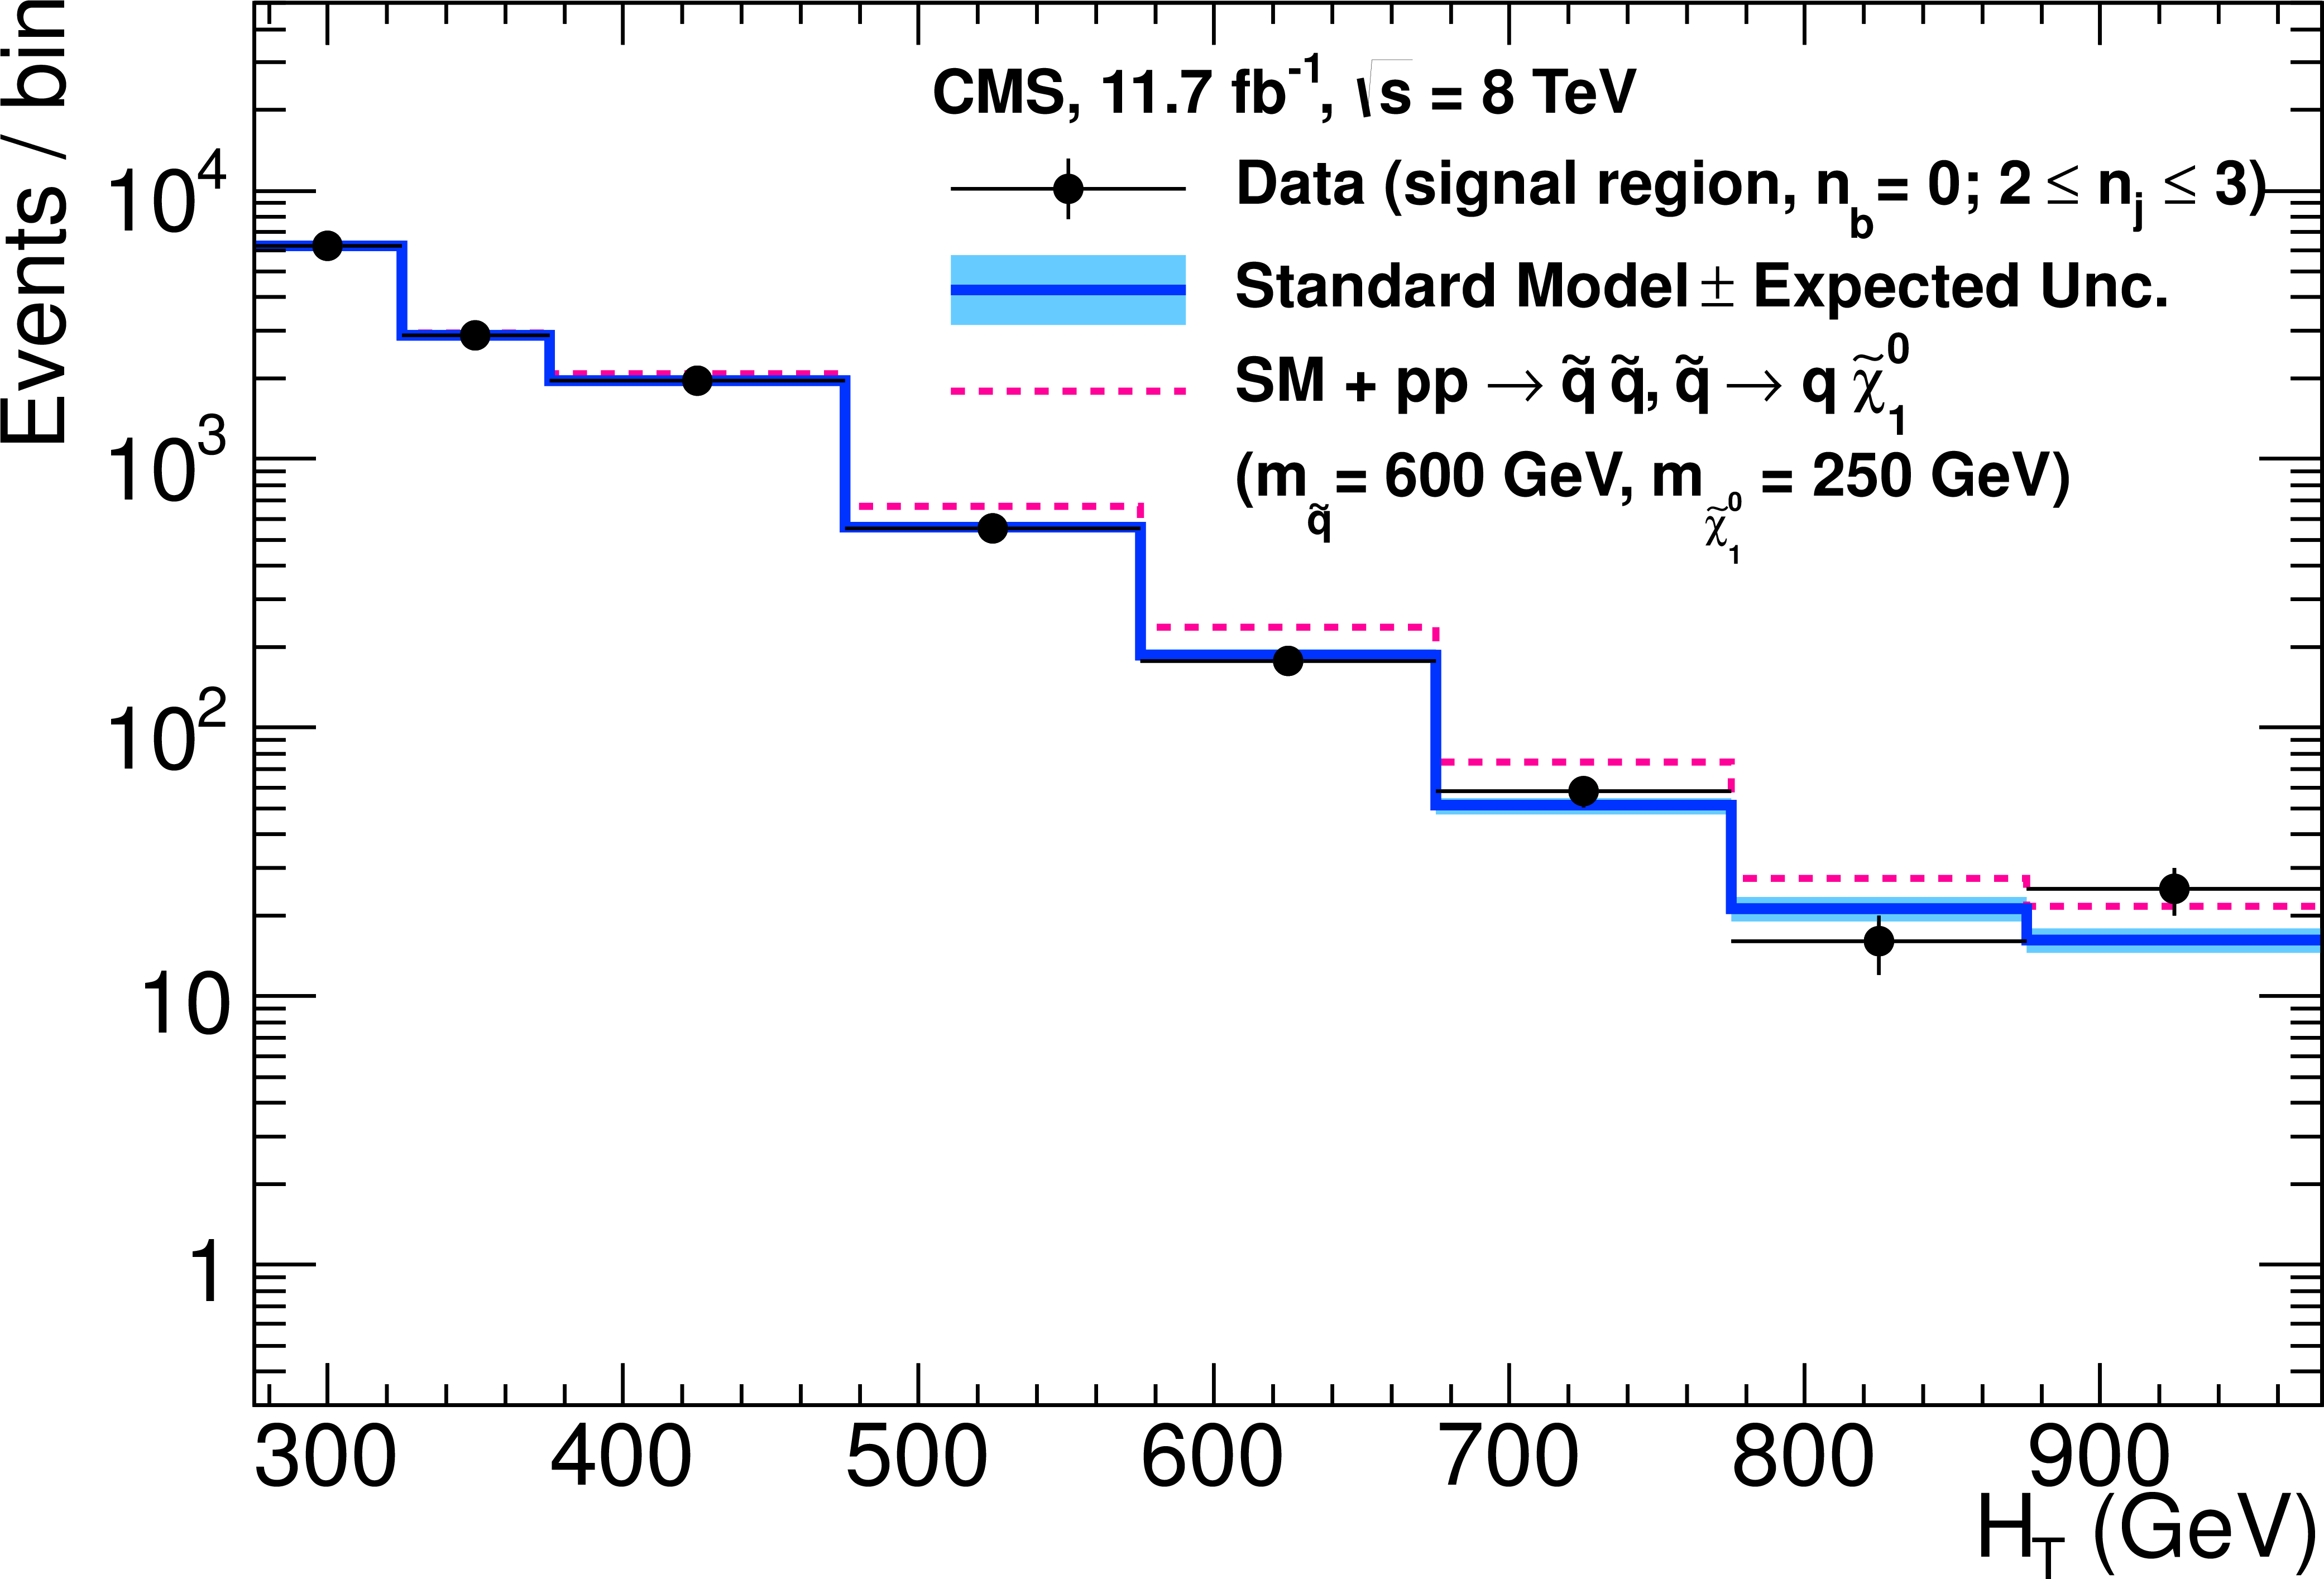
Figure 3-a:
Event yields observed in data (solid circles) and SM expectations with their associated uncertainties (solid lines with bands) in bins of $H_\text {T}$ for the signal region when requiring exactly zero b-quark jets and $ {2 \leq {n_{\text {jet}}} \leq 3} $ (a) or $ { {n_{\text {jet}}} \geq 4} $ (b). For illustration only, the expectations for the reference mass points of the signal models $\texttt {D1} $ (a, red dashed line) and $\texttt {G1} $ (b, red dashed line) are superimposed on the SM-only expectations. |
png pdf |
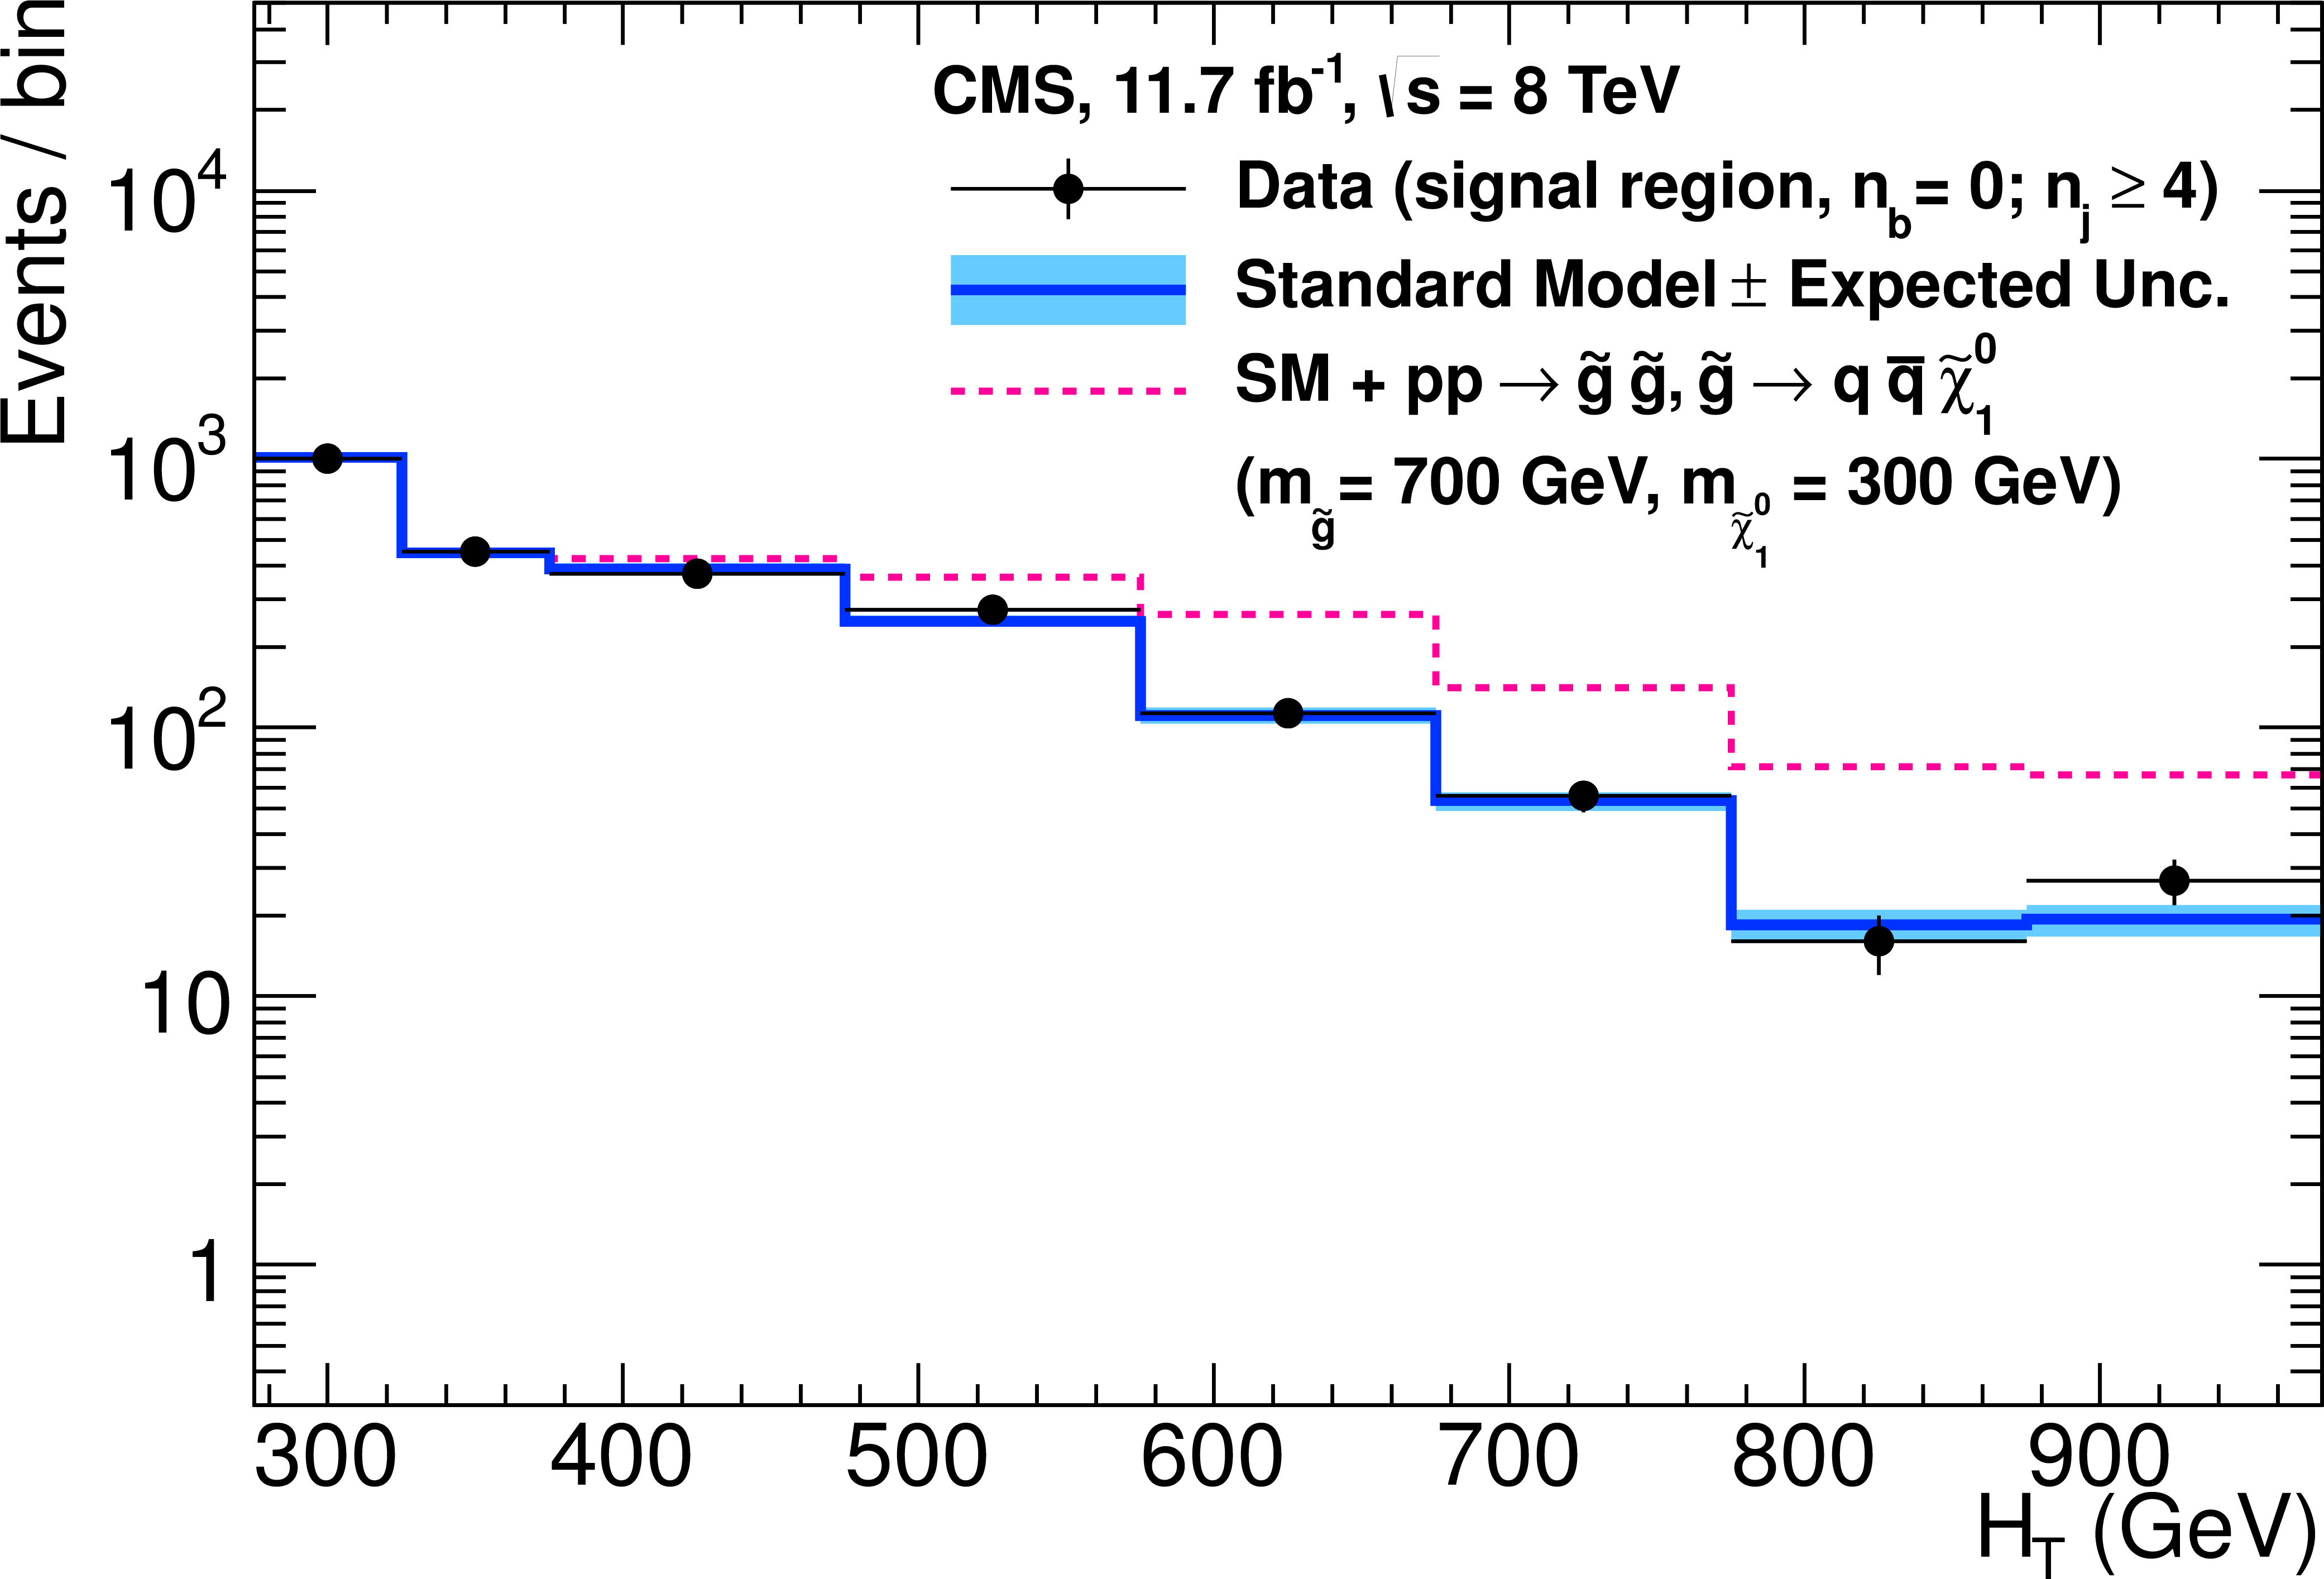
Figure 3-b:
Event yields observed in data (solid circles) and SM expectations with their associated uncertainties (solid lines with bands) in bins of $H_\text {T}$ for the signal region when requiring exactly zero b-quark jets and $ {2 \leq {n_{\text {jet}}} \leq 3} $ (a) or $ { {n_{\text {jet}}} \geq 4} $ (b). For illustration only, the expectations for the reference mass points of the signal models $\texttt {D1} $ (a, red dashed line) and $\texttt {G1} $ (b, red dashed line) are superimposed on the SM-only expectations. |
png pdf |
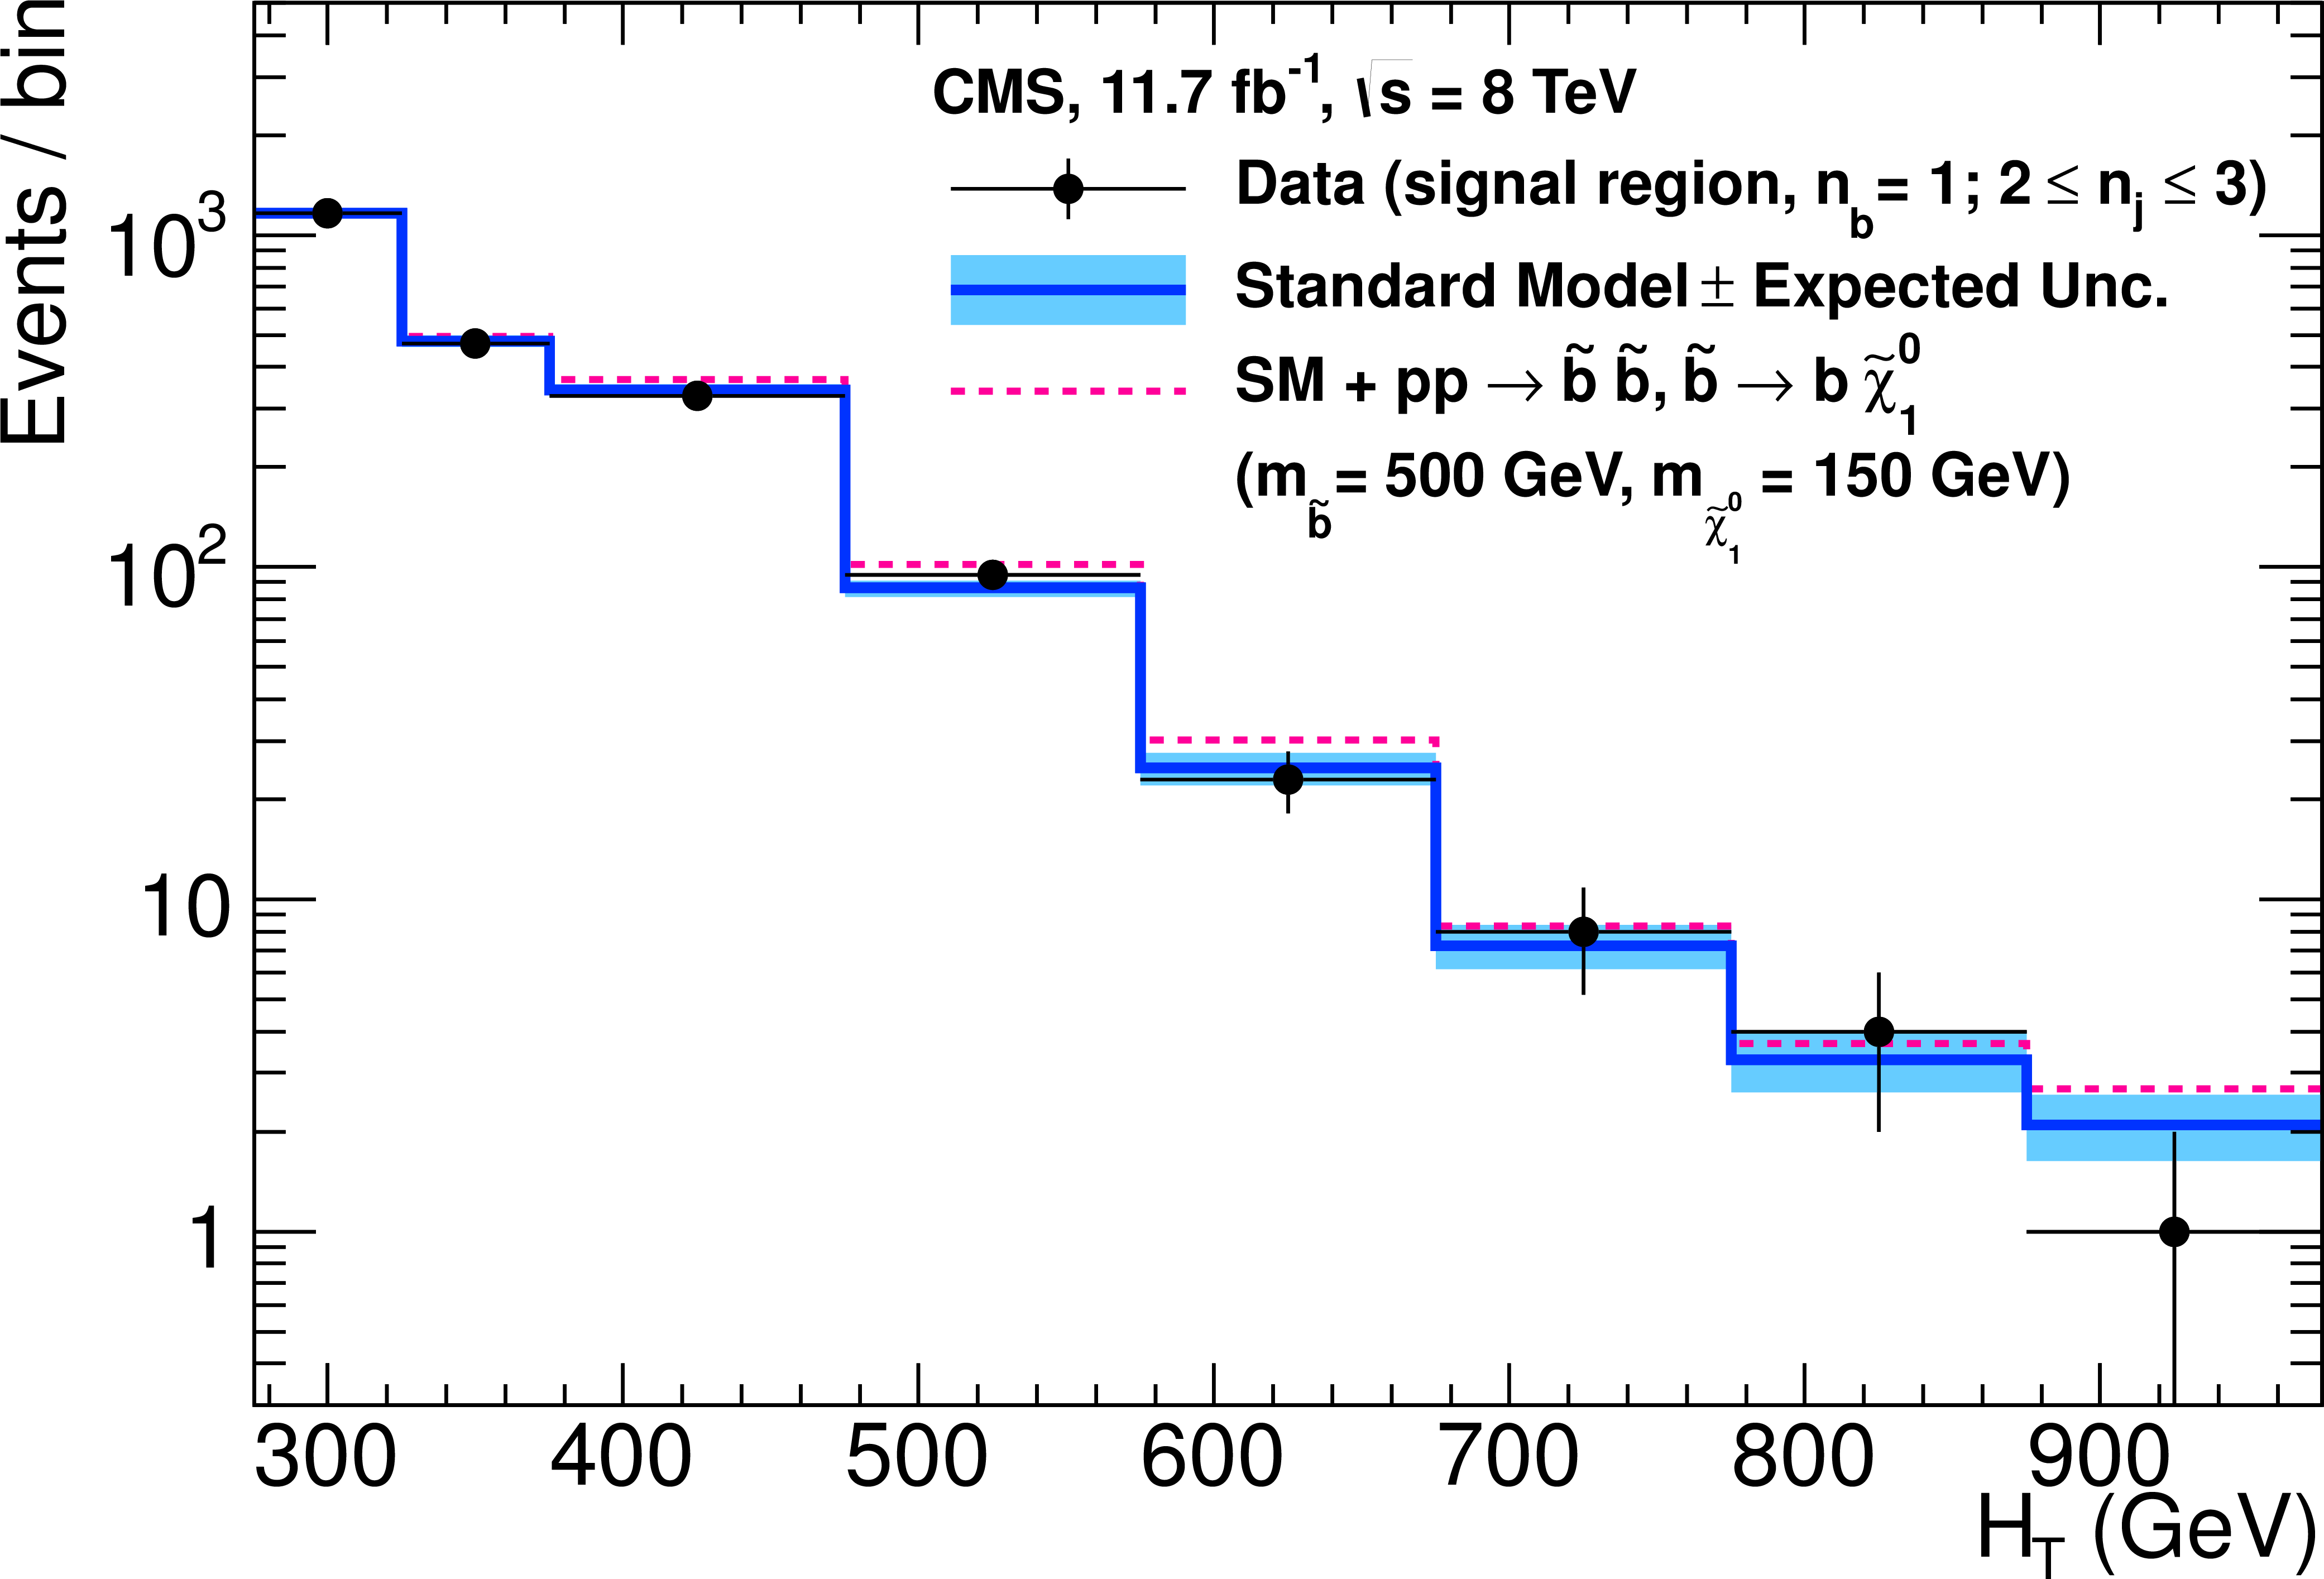
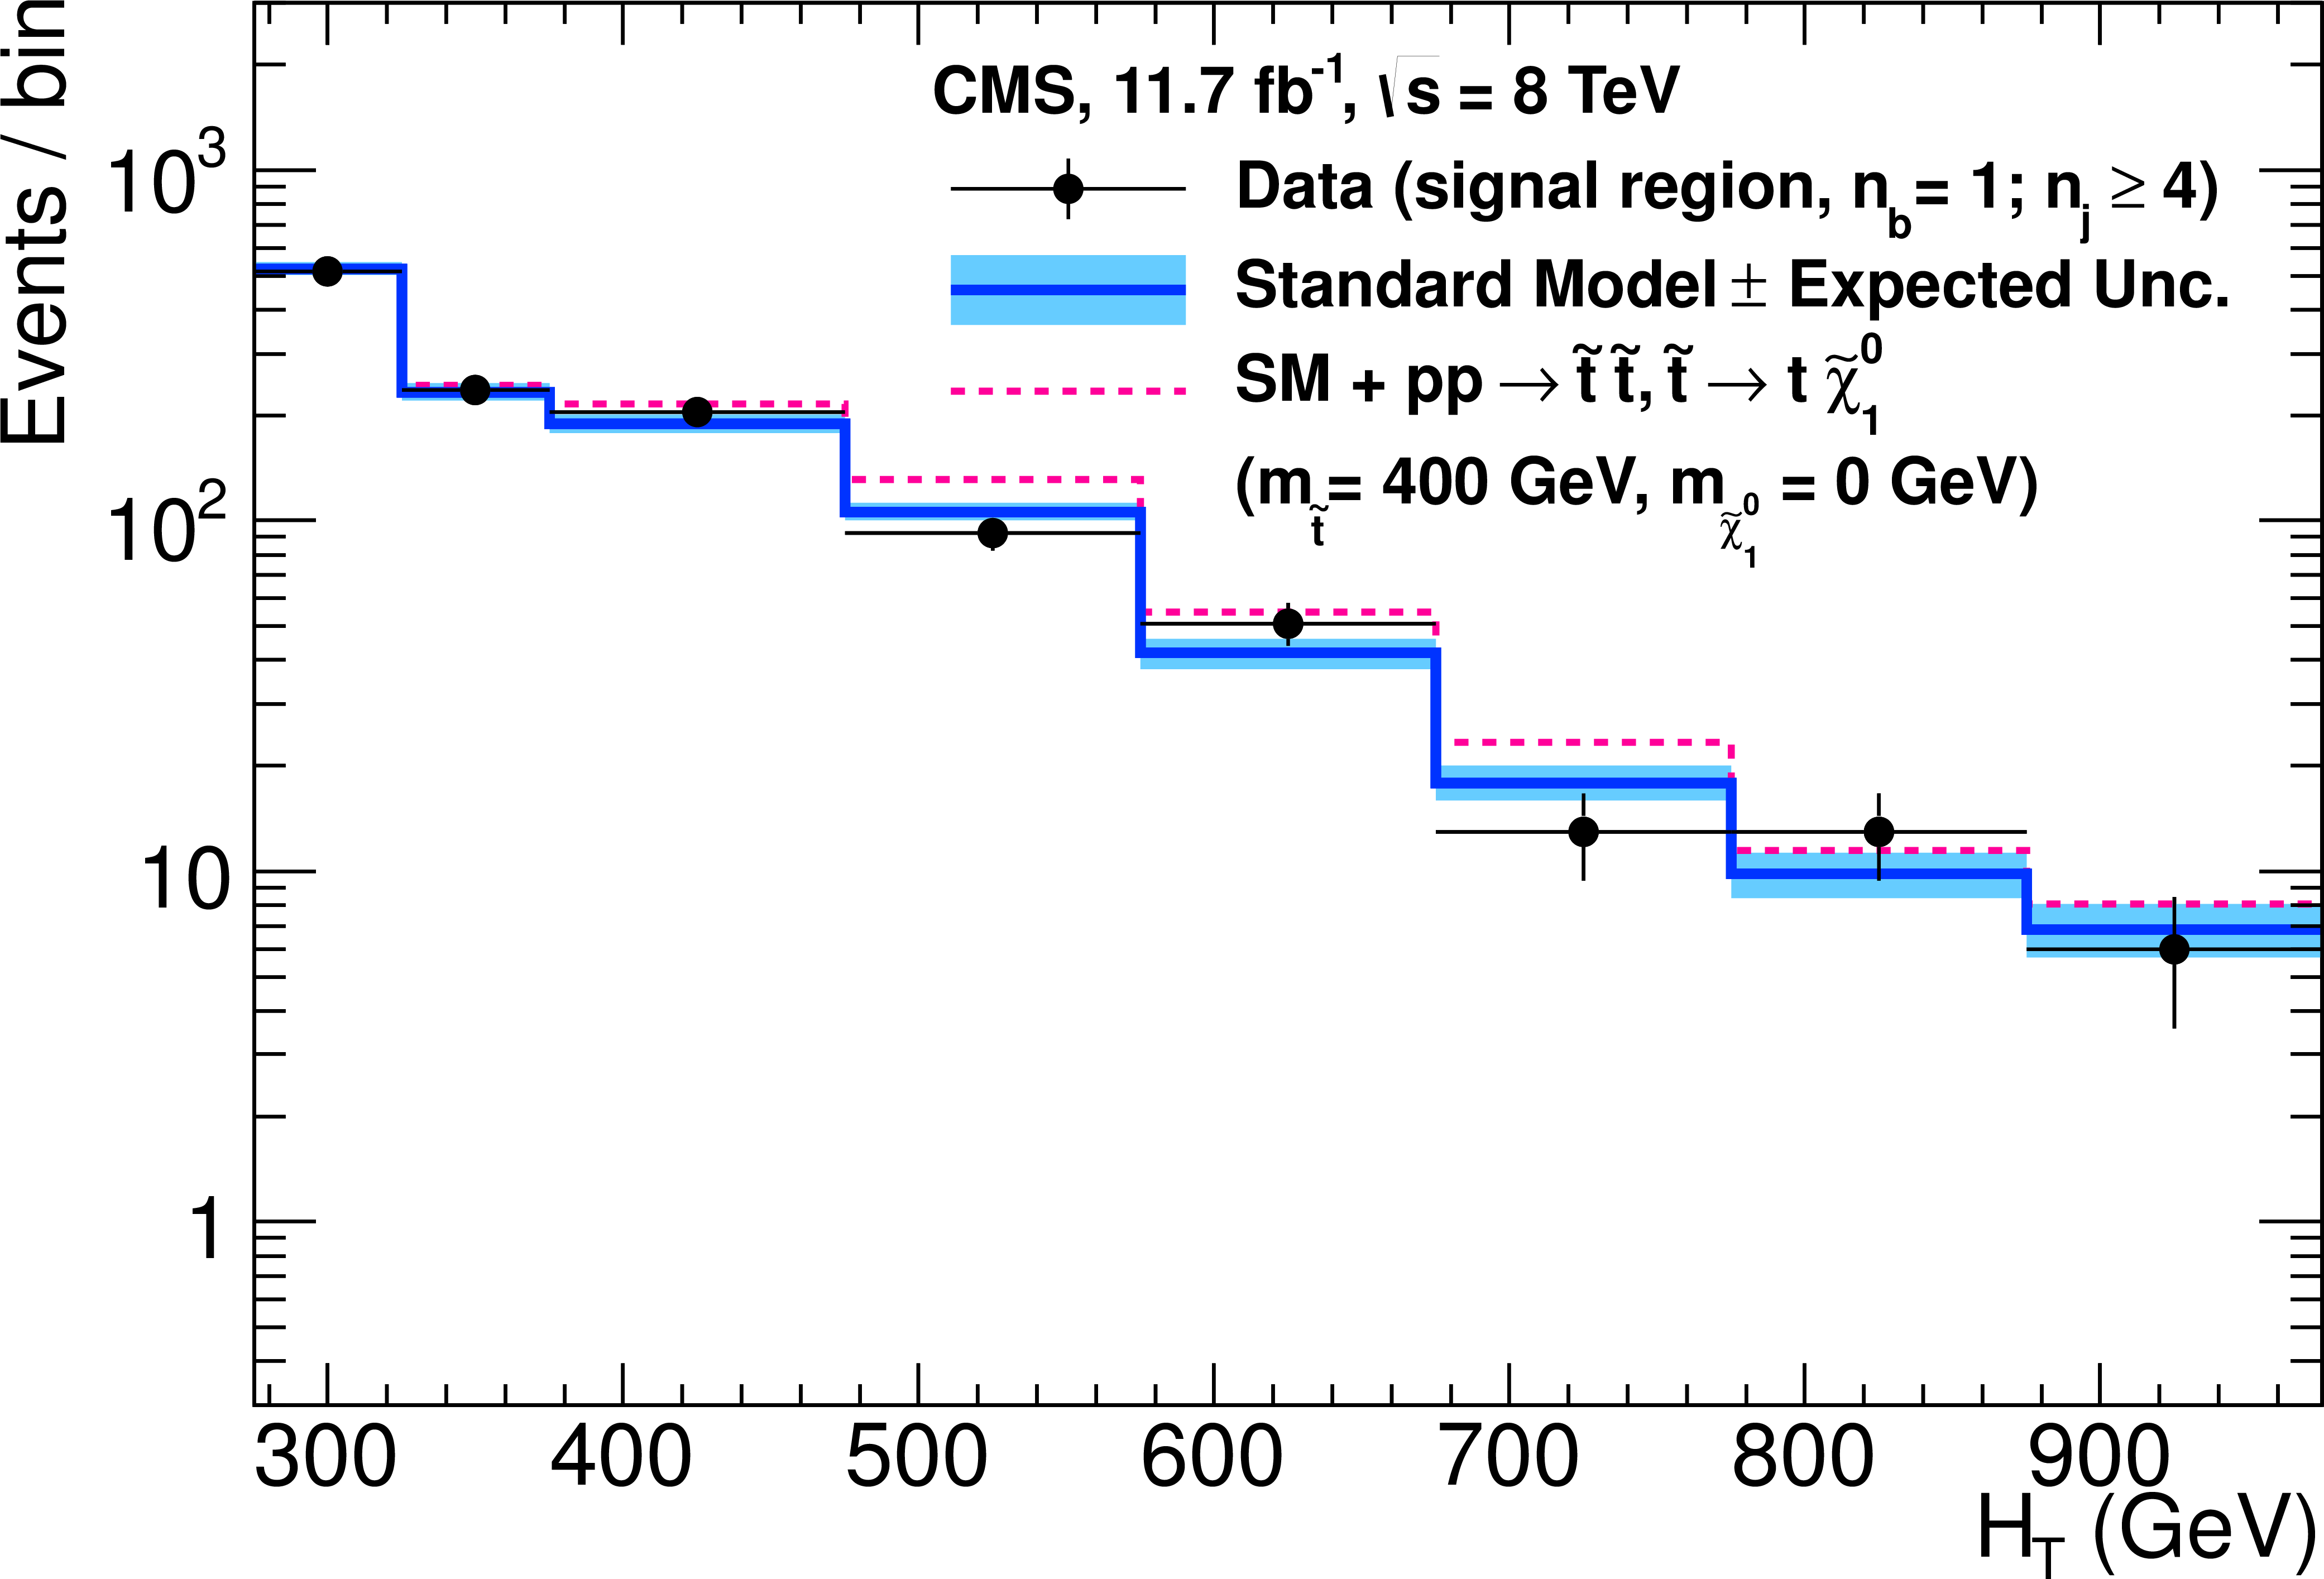
Figure 4-a:
As for Fig. 3, but requiring exactly one b-quark jet and $ {2 \leq {n_{\text {jet}}} \leq 3} $ (a) or $ { {n_{\text {jet}}} \geq 4} $ (b). Example signal yields are for the reference mass points of the signal models $\texttt {D2} $ (a, red dashed line) and $\texttt {D3} $ (b, red dashed line). |
png pdf |
Figure 4-b:
As for Fig. 3, but requiring exactly one b-quark jet and $ {2 \leq {n_{\text {jet}}} \leq 3} $ (a) or $ { {n_{\text {jet}}} \geq 4} $ (b). Example signal yields are for the reference mass points of the signal models $\texttt {D2} $ (a, red dashed line) and $\texttt {D3} $ (b, red dashed line). |
png pdf |
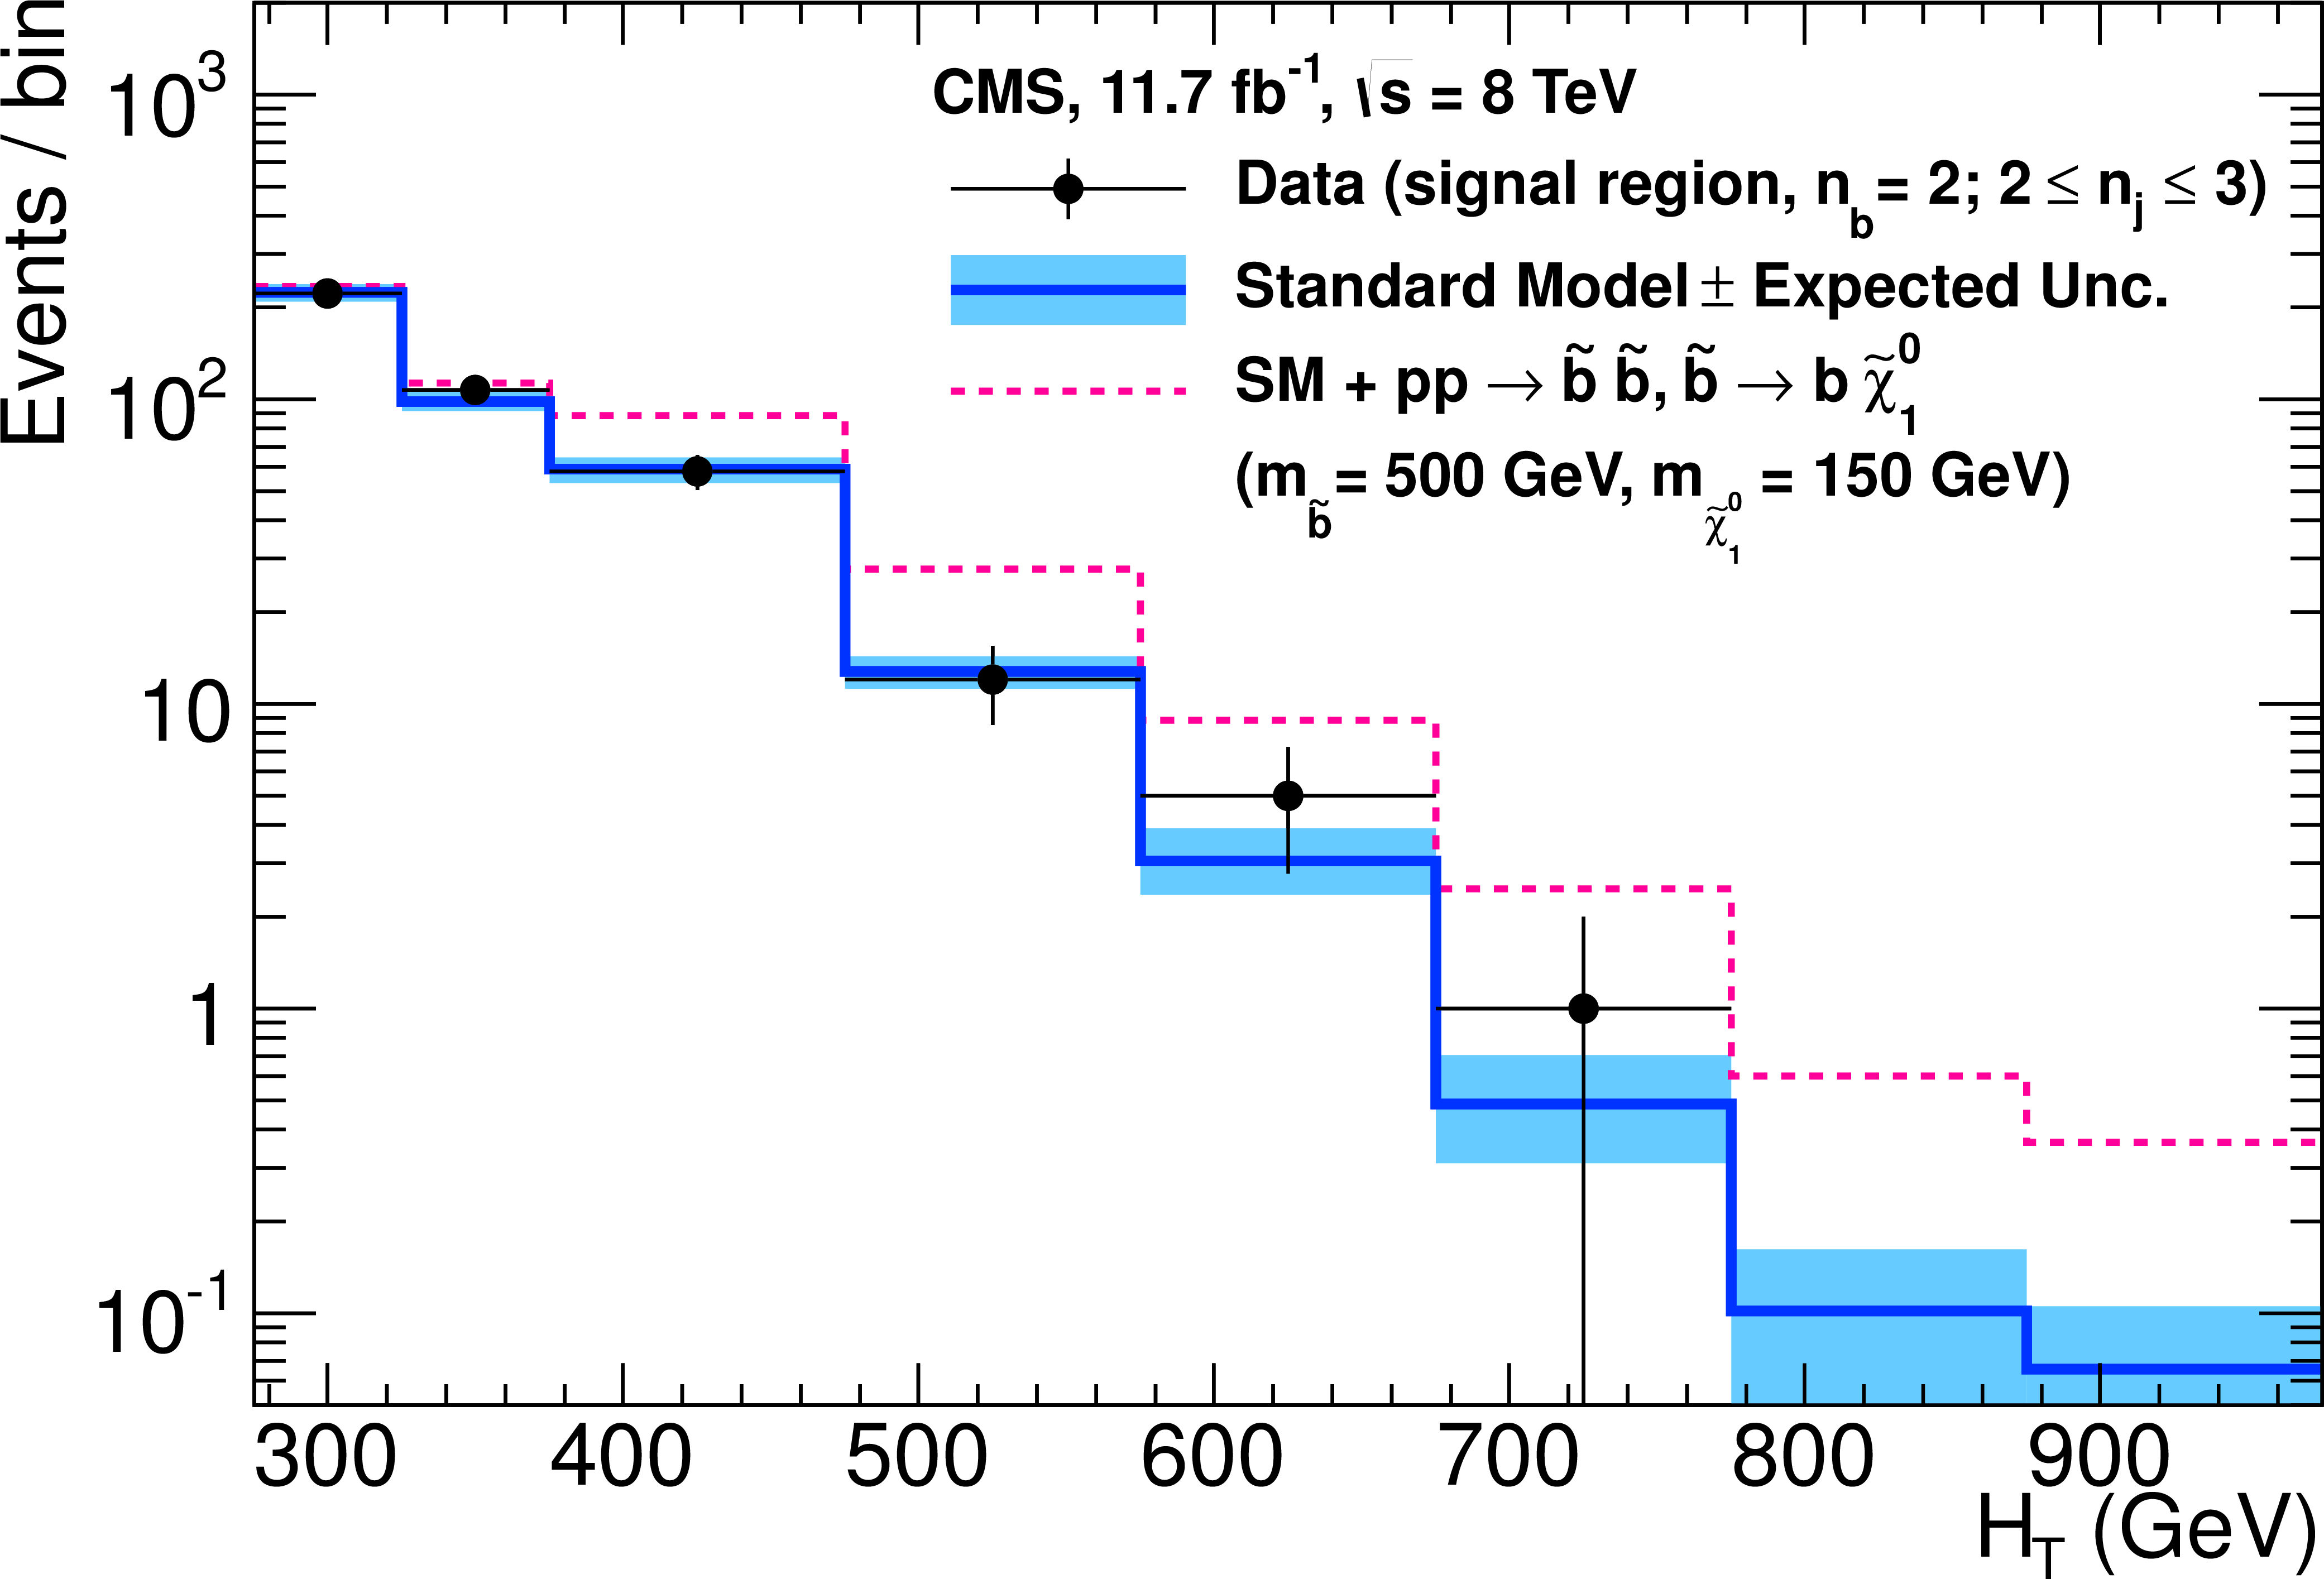
Figure 5-a:
As for Fig. 3, but requiring exactly two b-quark jets and $ {2 \leq {n_{\text {jet}}} \leq 3} $ (a) or $ { {n_{\text {jet}}} \geq 4} $ (b). Example signal yields are for the reference mass points of the signal models $\texttt {D2} $ (a, red dashed line) and $\texttt {D3} $ (b, red dashed line). |
png pdf |
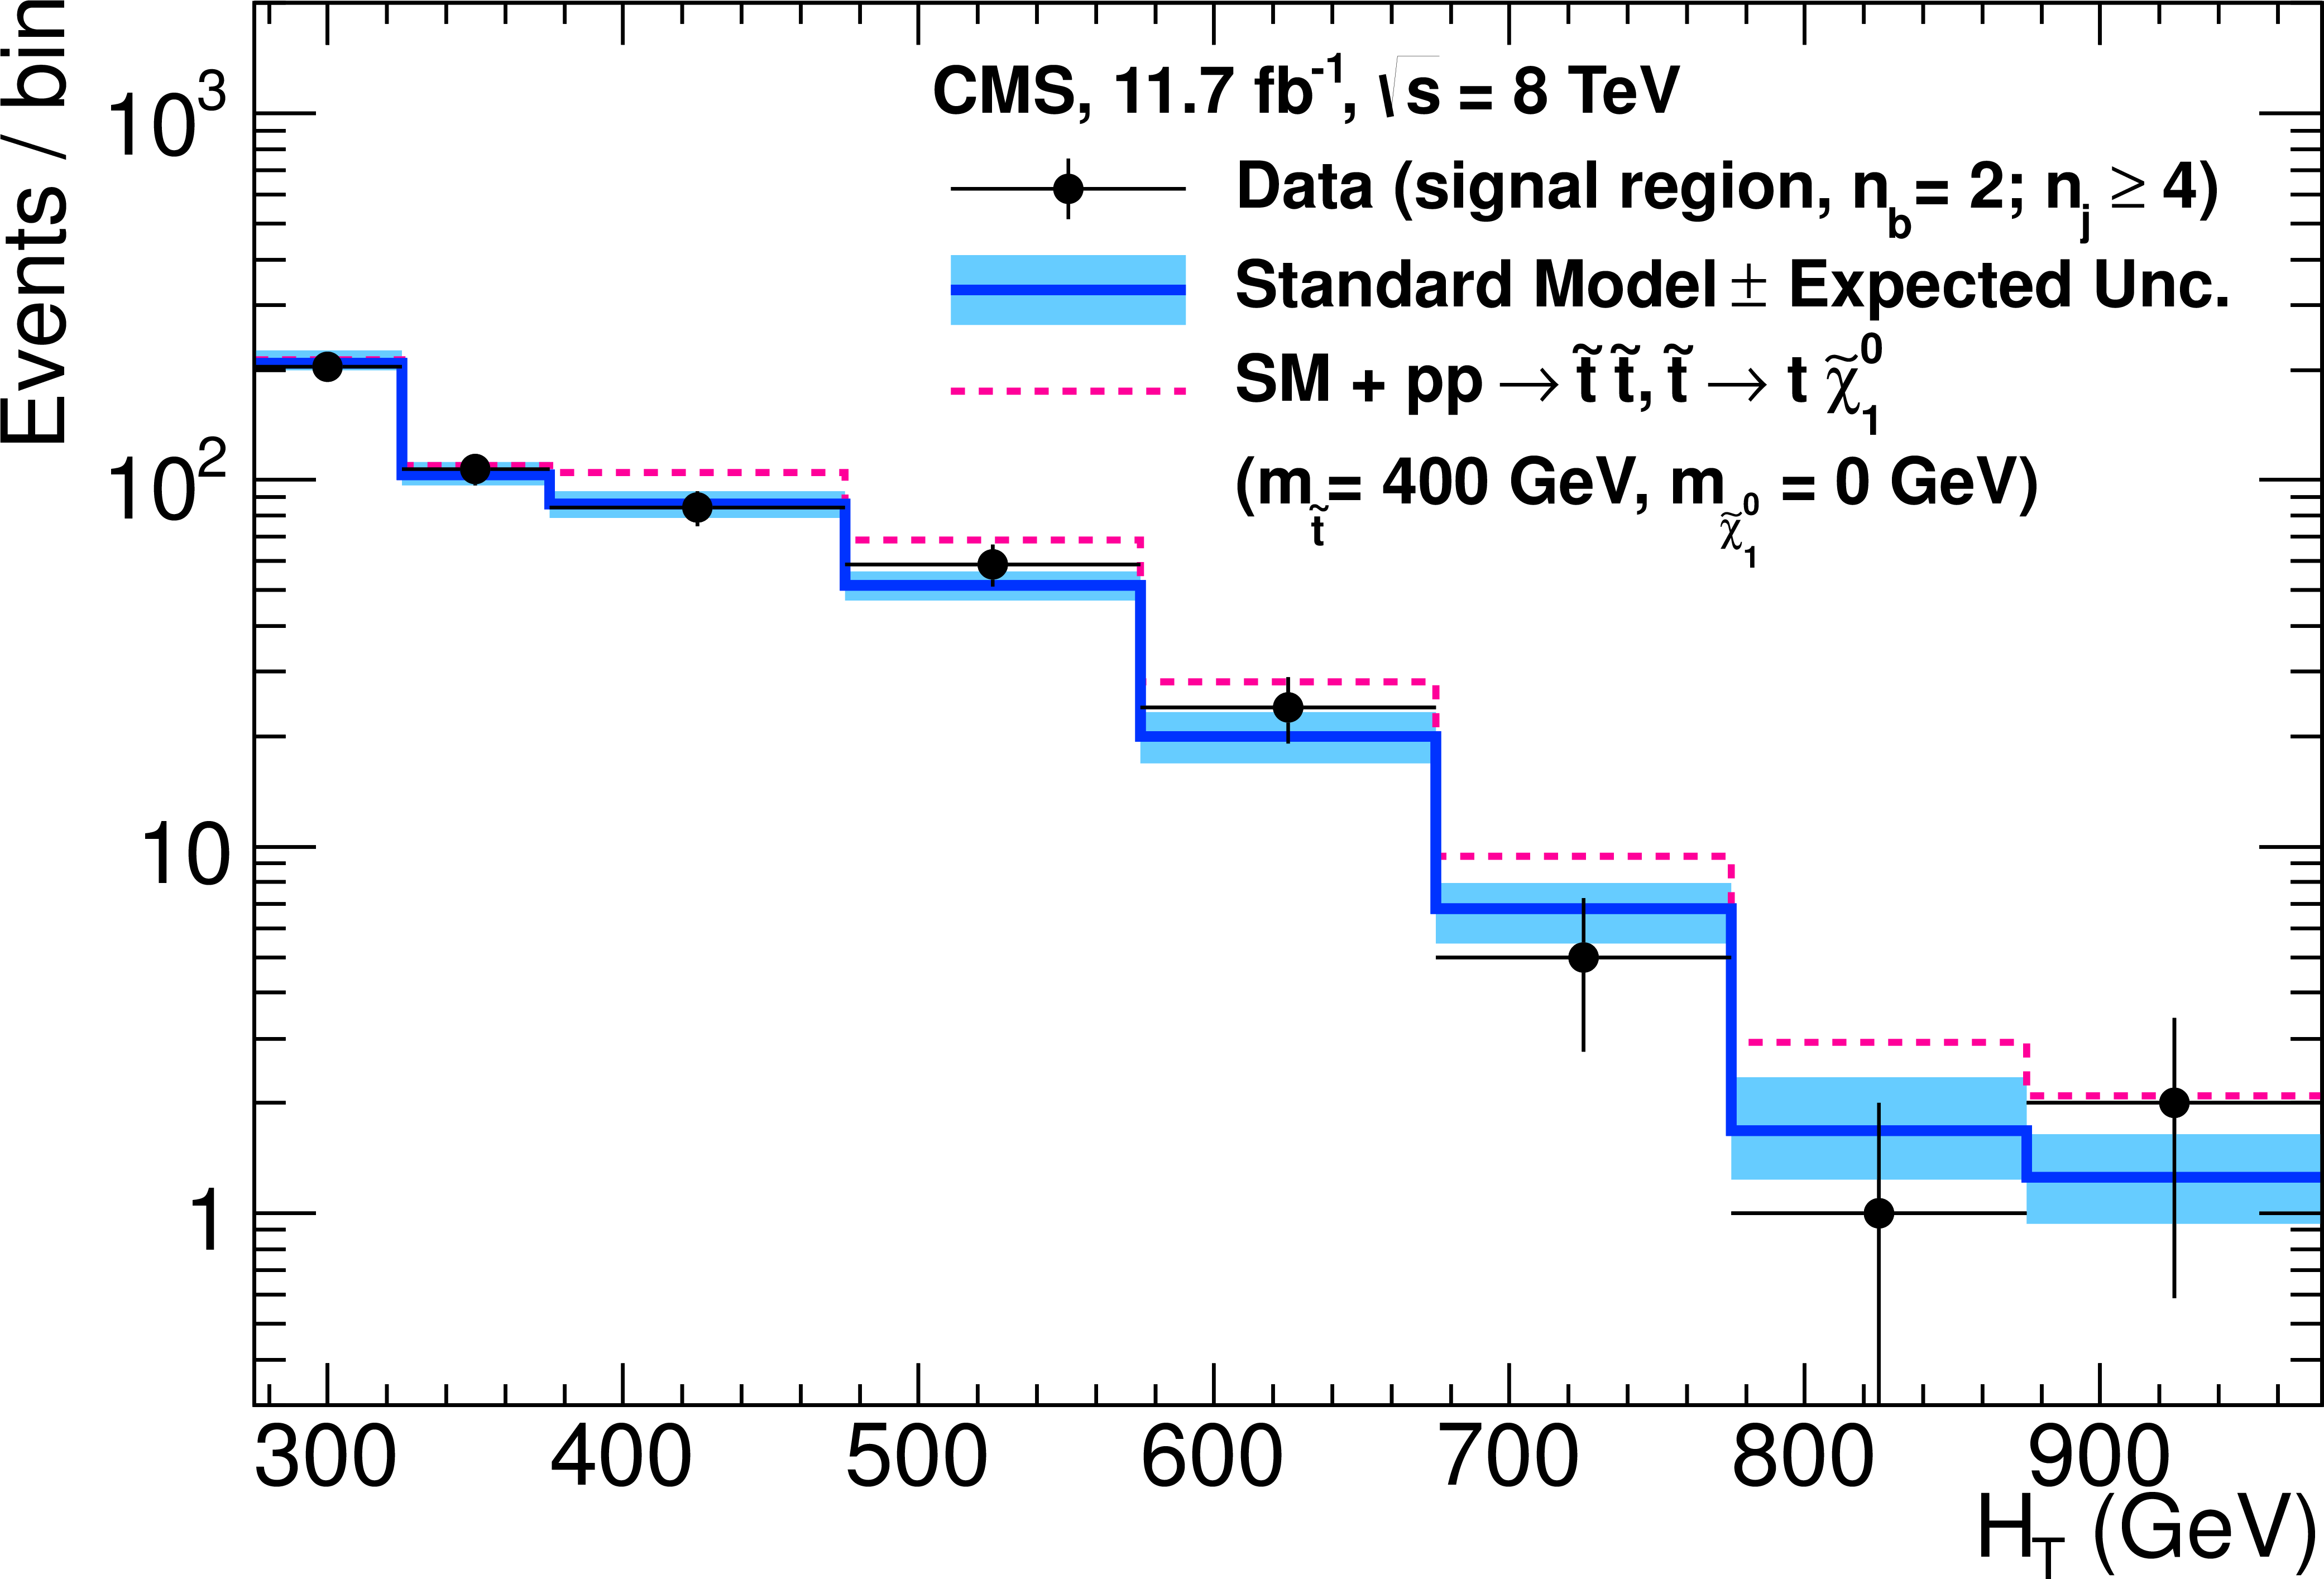
Figure 5-b:
As for Fig. 3, but requiring exactly two b-quark jets and $ {2 \leq {n_{\text {jet}}} \leq 3} $ (a) or $ { {n_{\text {jet}}} \geq 4} $ (b). Example signal yields are for the reference mass points of the signal models $\texttt {D2} $ (a, red dashed line) and $\texttt {D3} $ (b, red dashed line). |
png pdf |
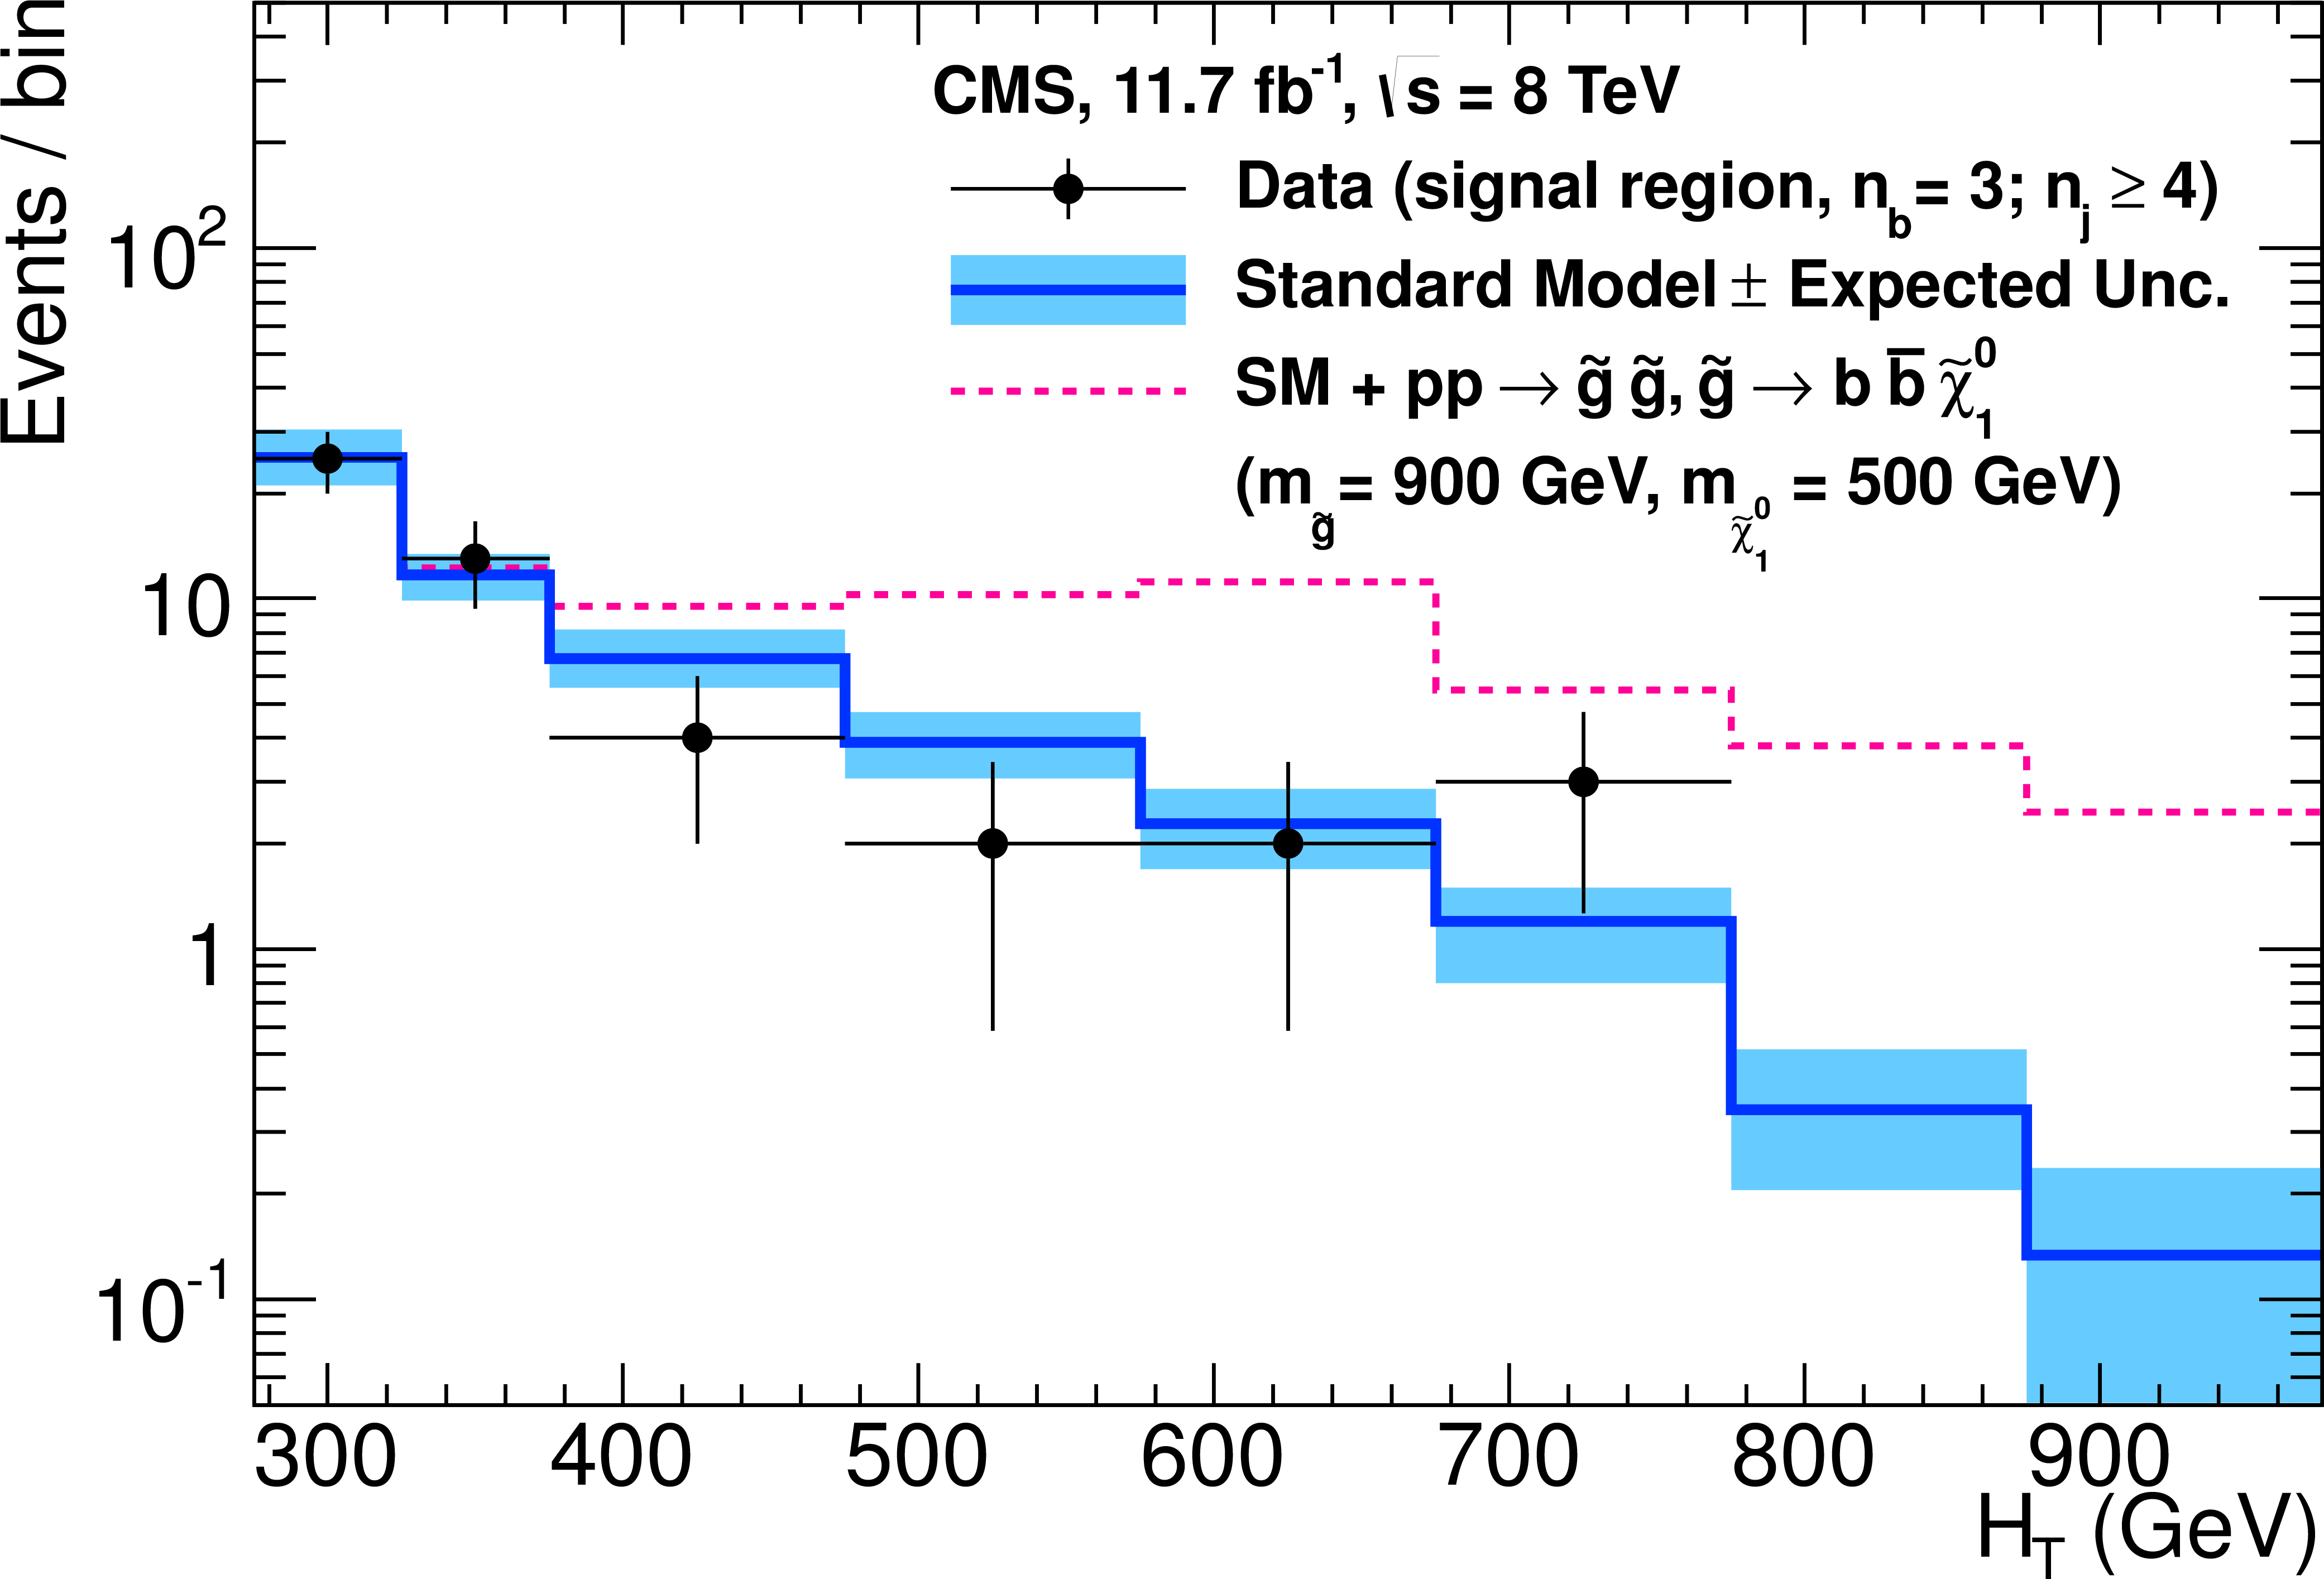
Figure 6-a:
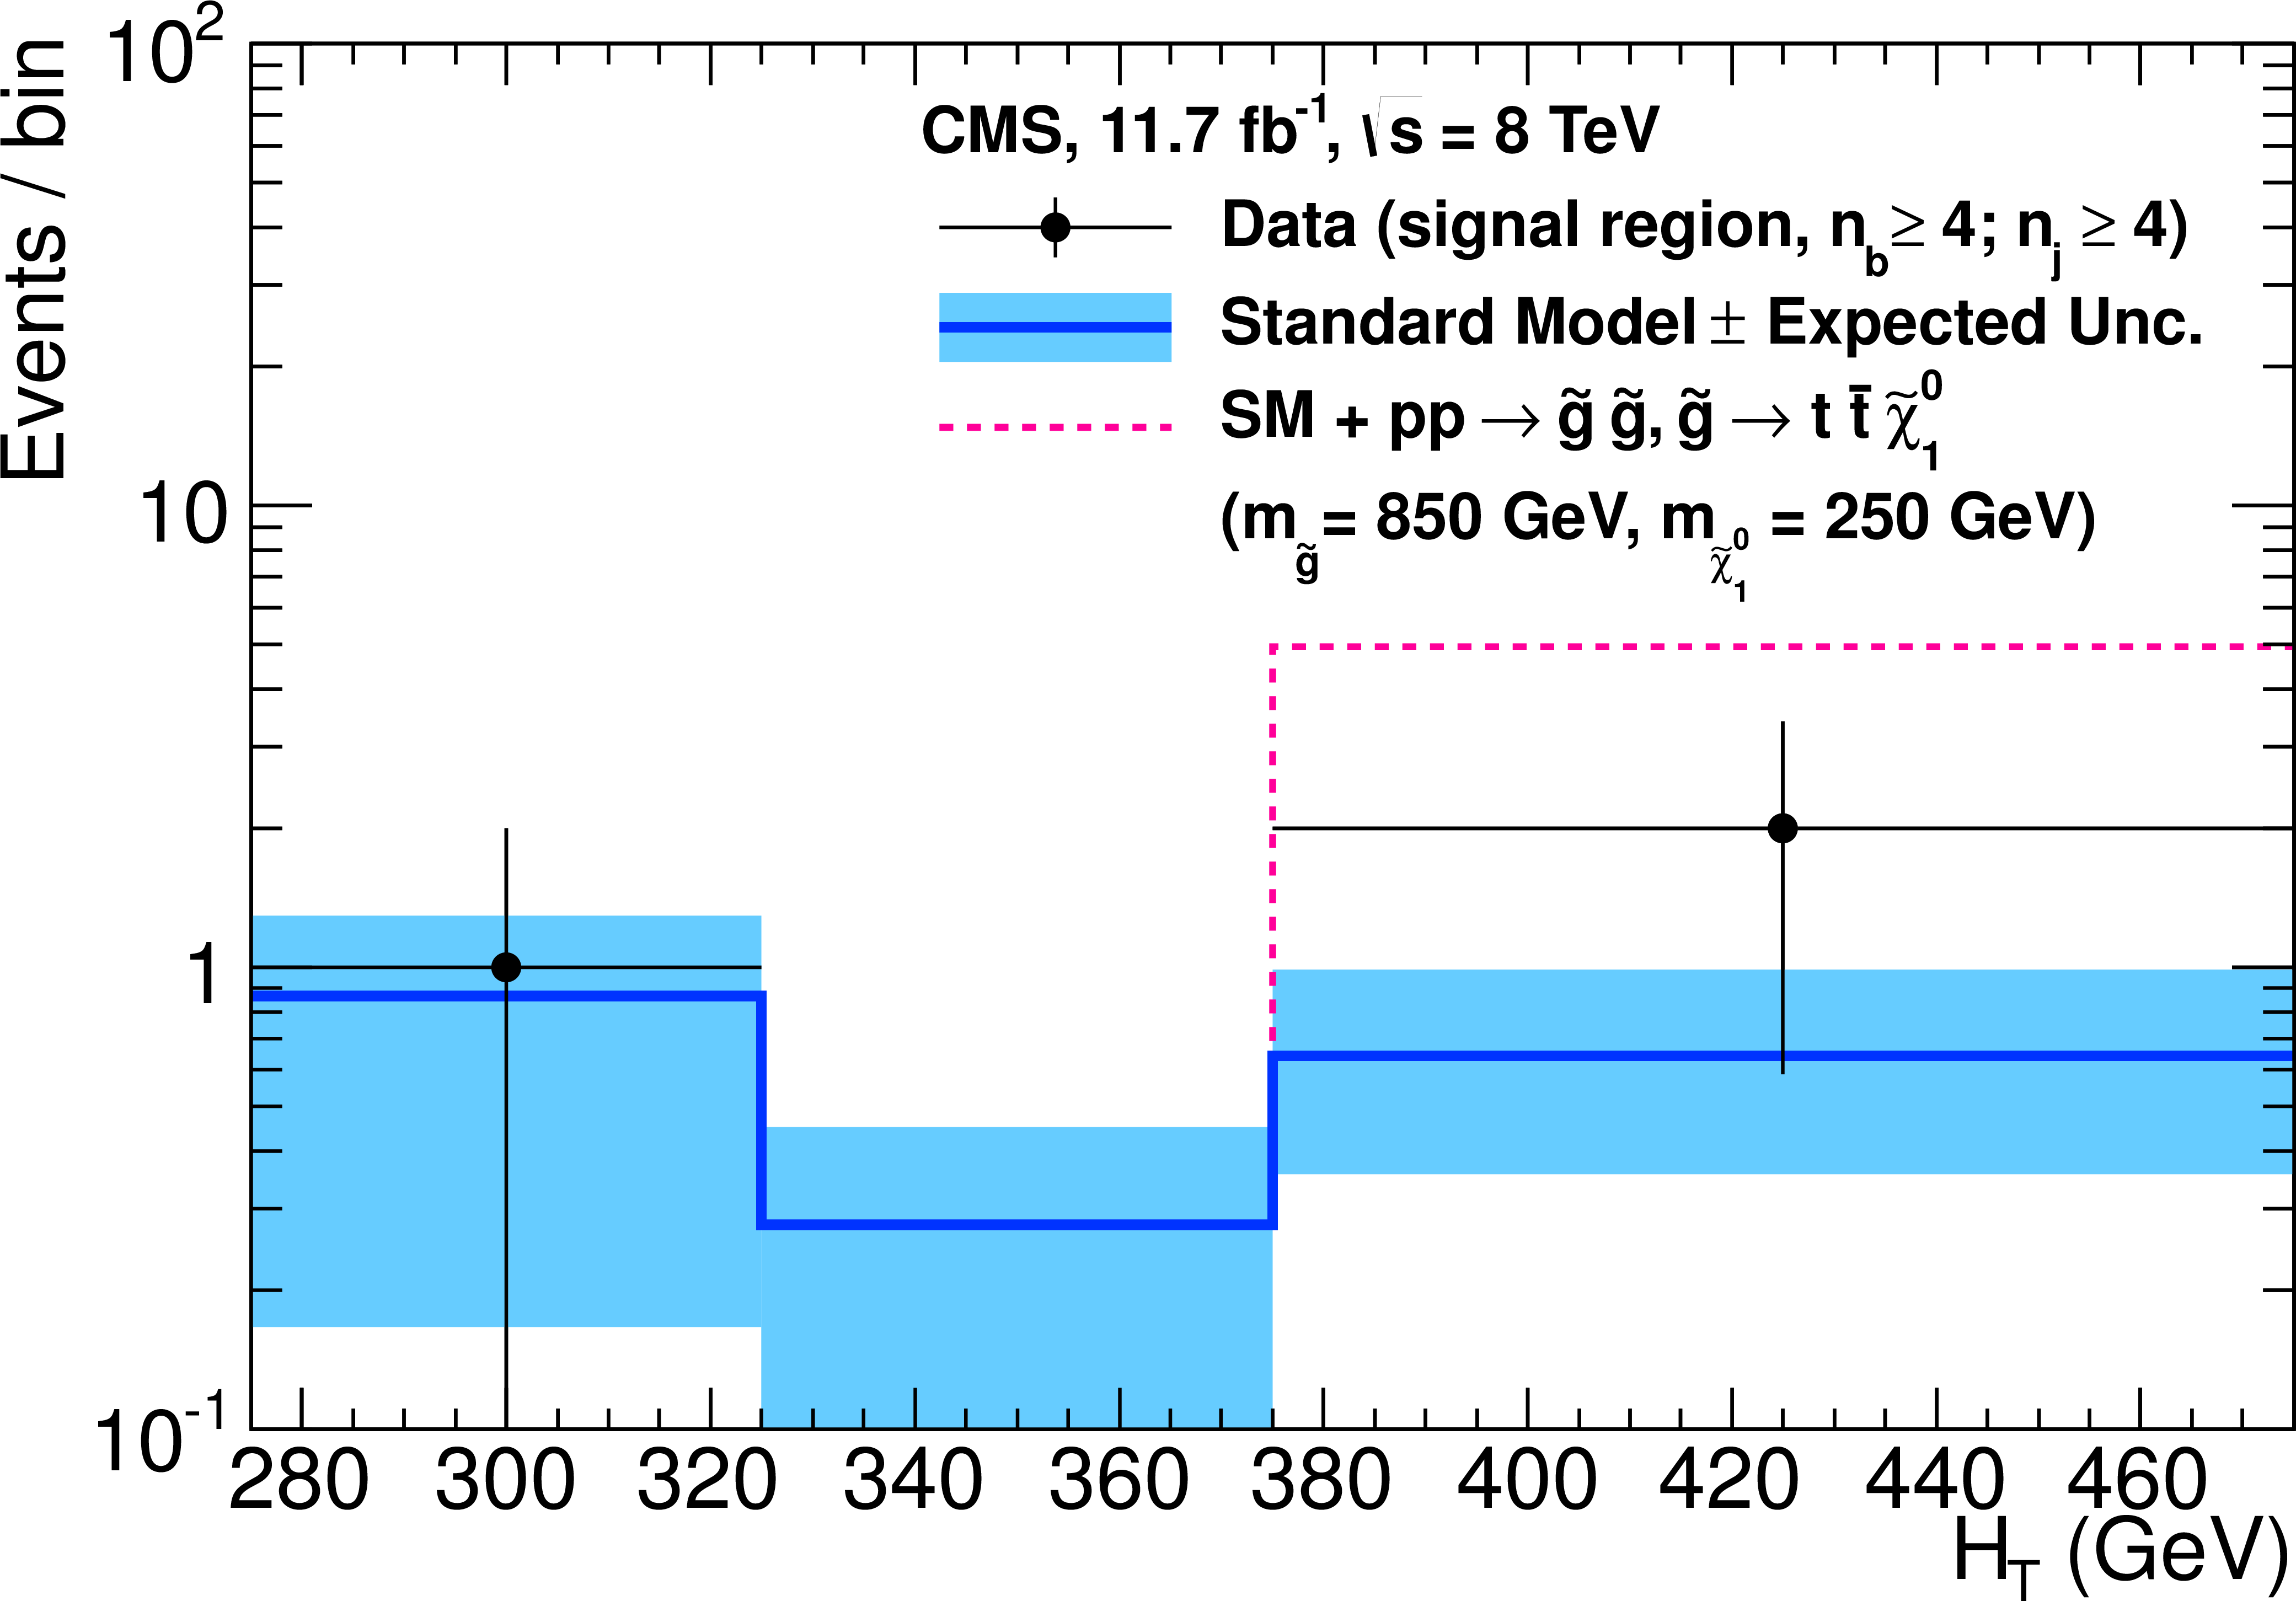
As for Fig. 3, but requiring $ { {n_{\text {jet}}} \geq 4} $ and exactly three (a) or at least four (b) b-quark jets. Example signal yields are for the reference mass points of the signal models $\texttt {G2} $ (a, red dashed line) and $\texttt {G3} $ (b, red dashed line). |
png pdf |
Figure 6-b:
As for Fig. 3, but requiring $ { {n_{\text {jet}}} \geq 4} $ and exactly three (a) or at least four (b) b-quark jets. Example signal yields are for the reference mass points of the signal models $\texttt {G2} $ (a, red dashed line) and $\texttt {G3} $ (b, red dashed line). |
png pdf |
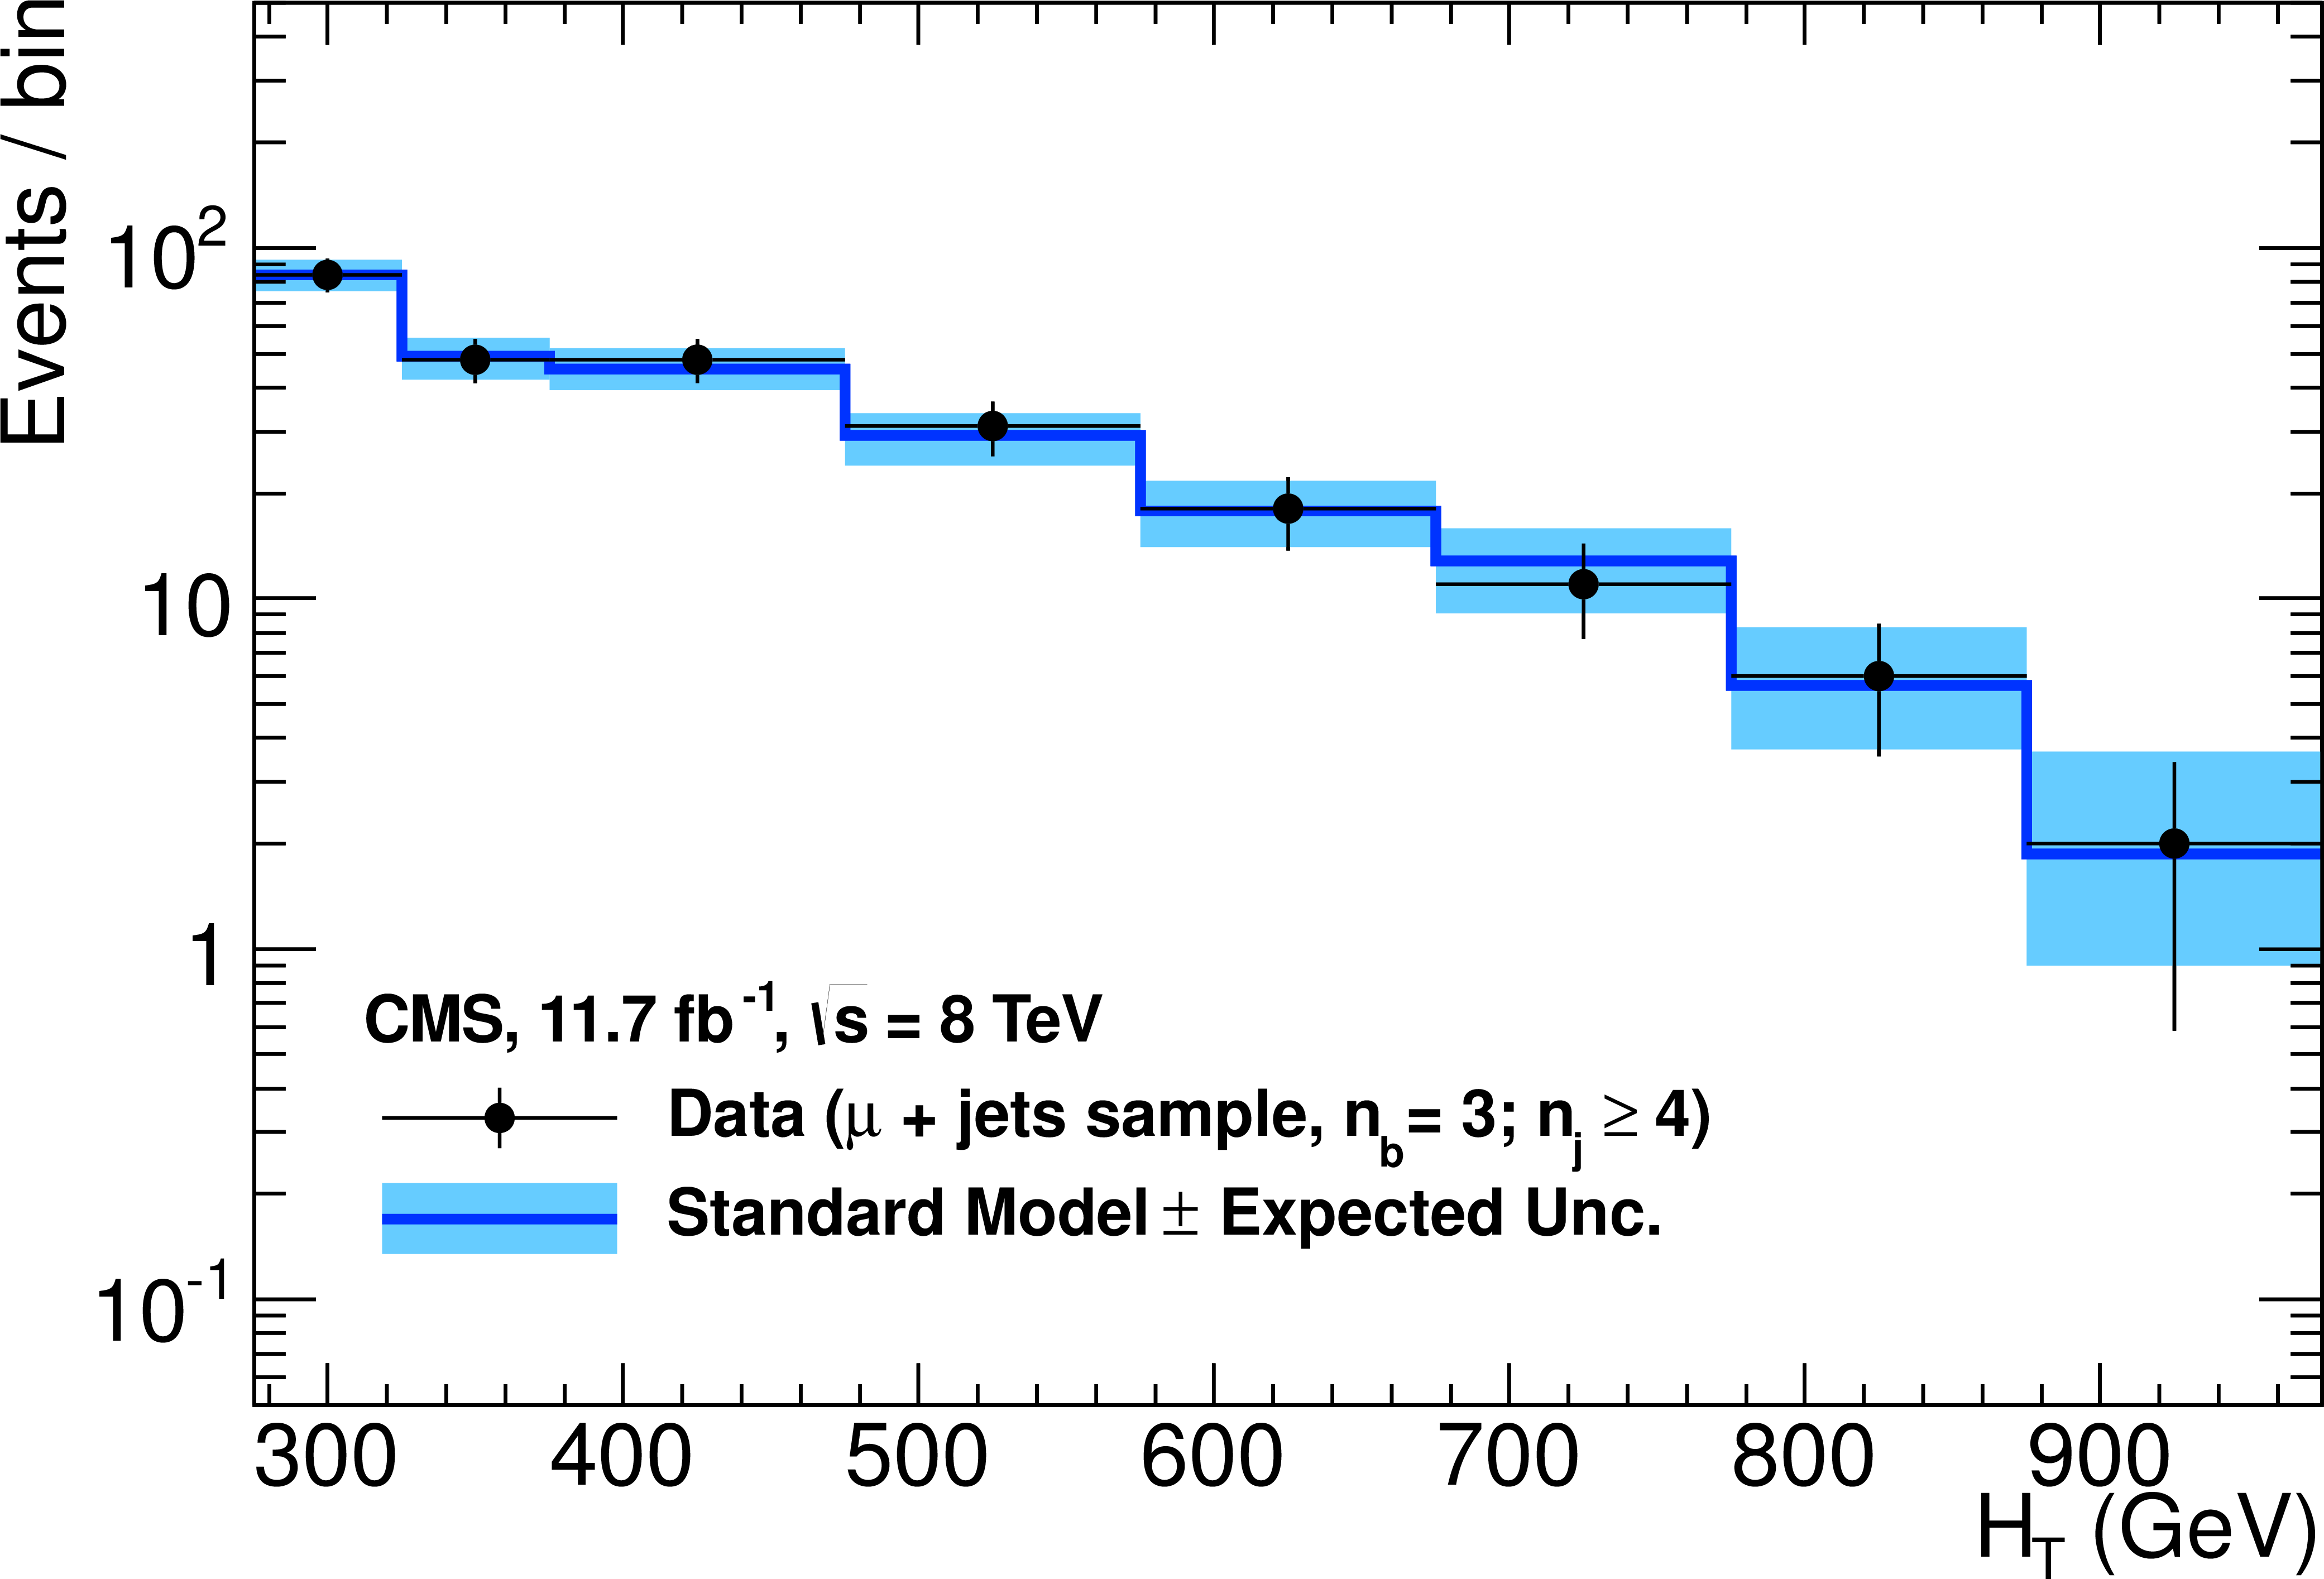
Figure 7-a:
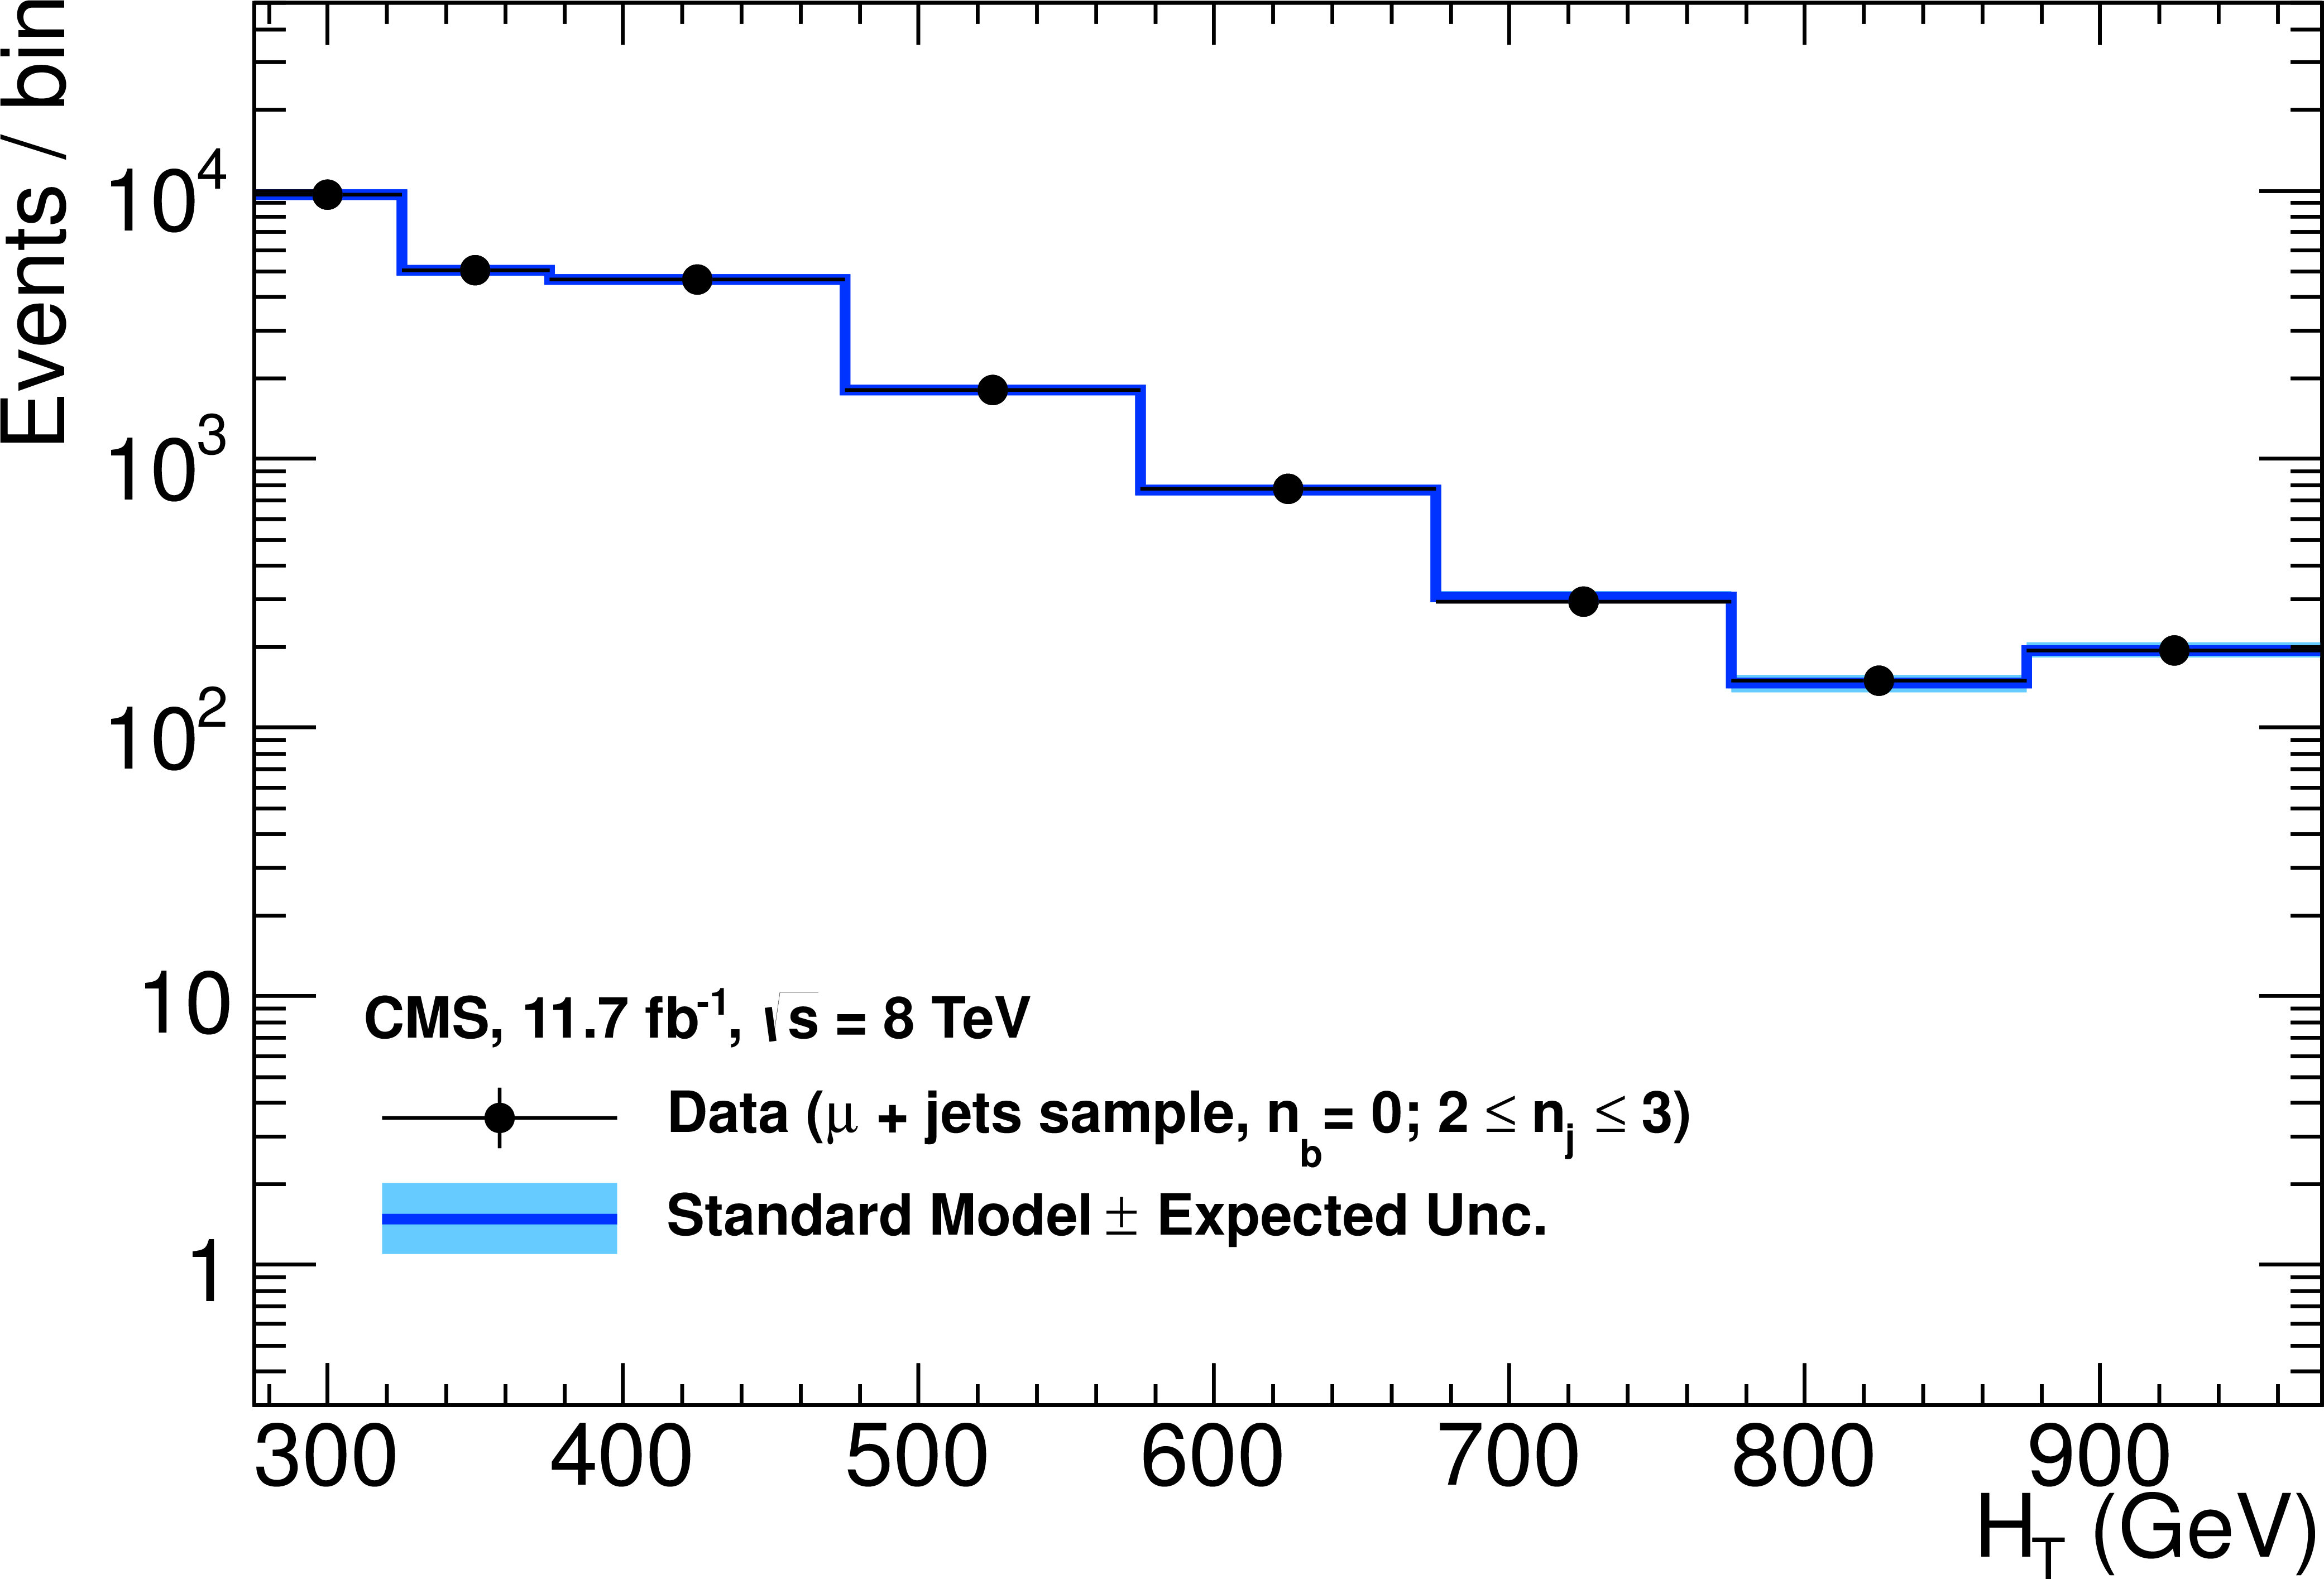
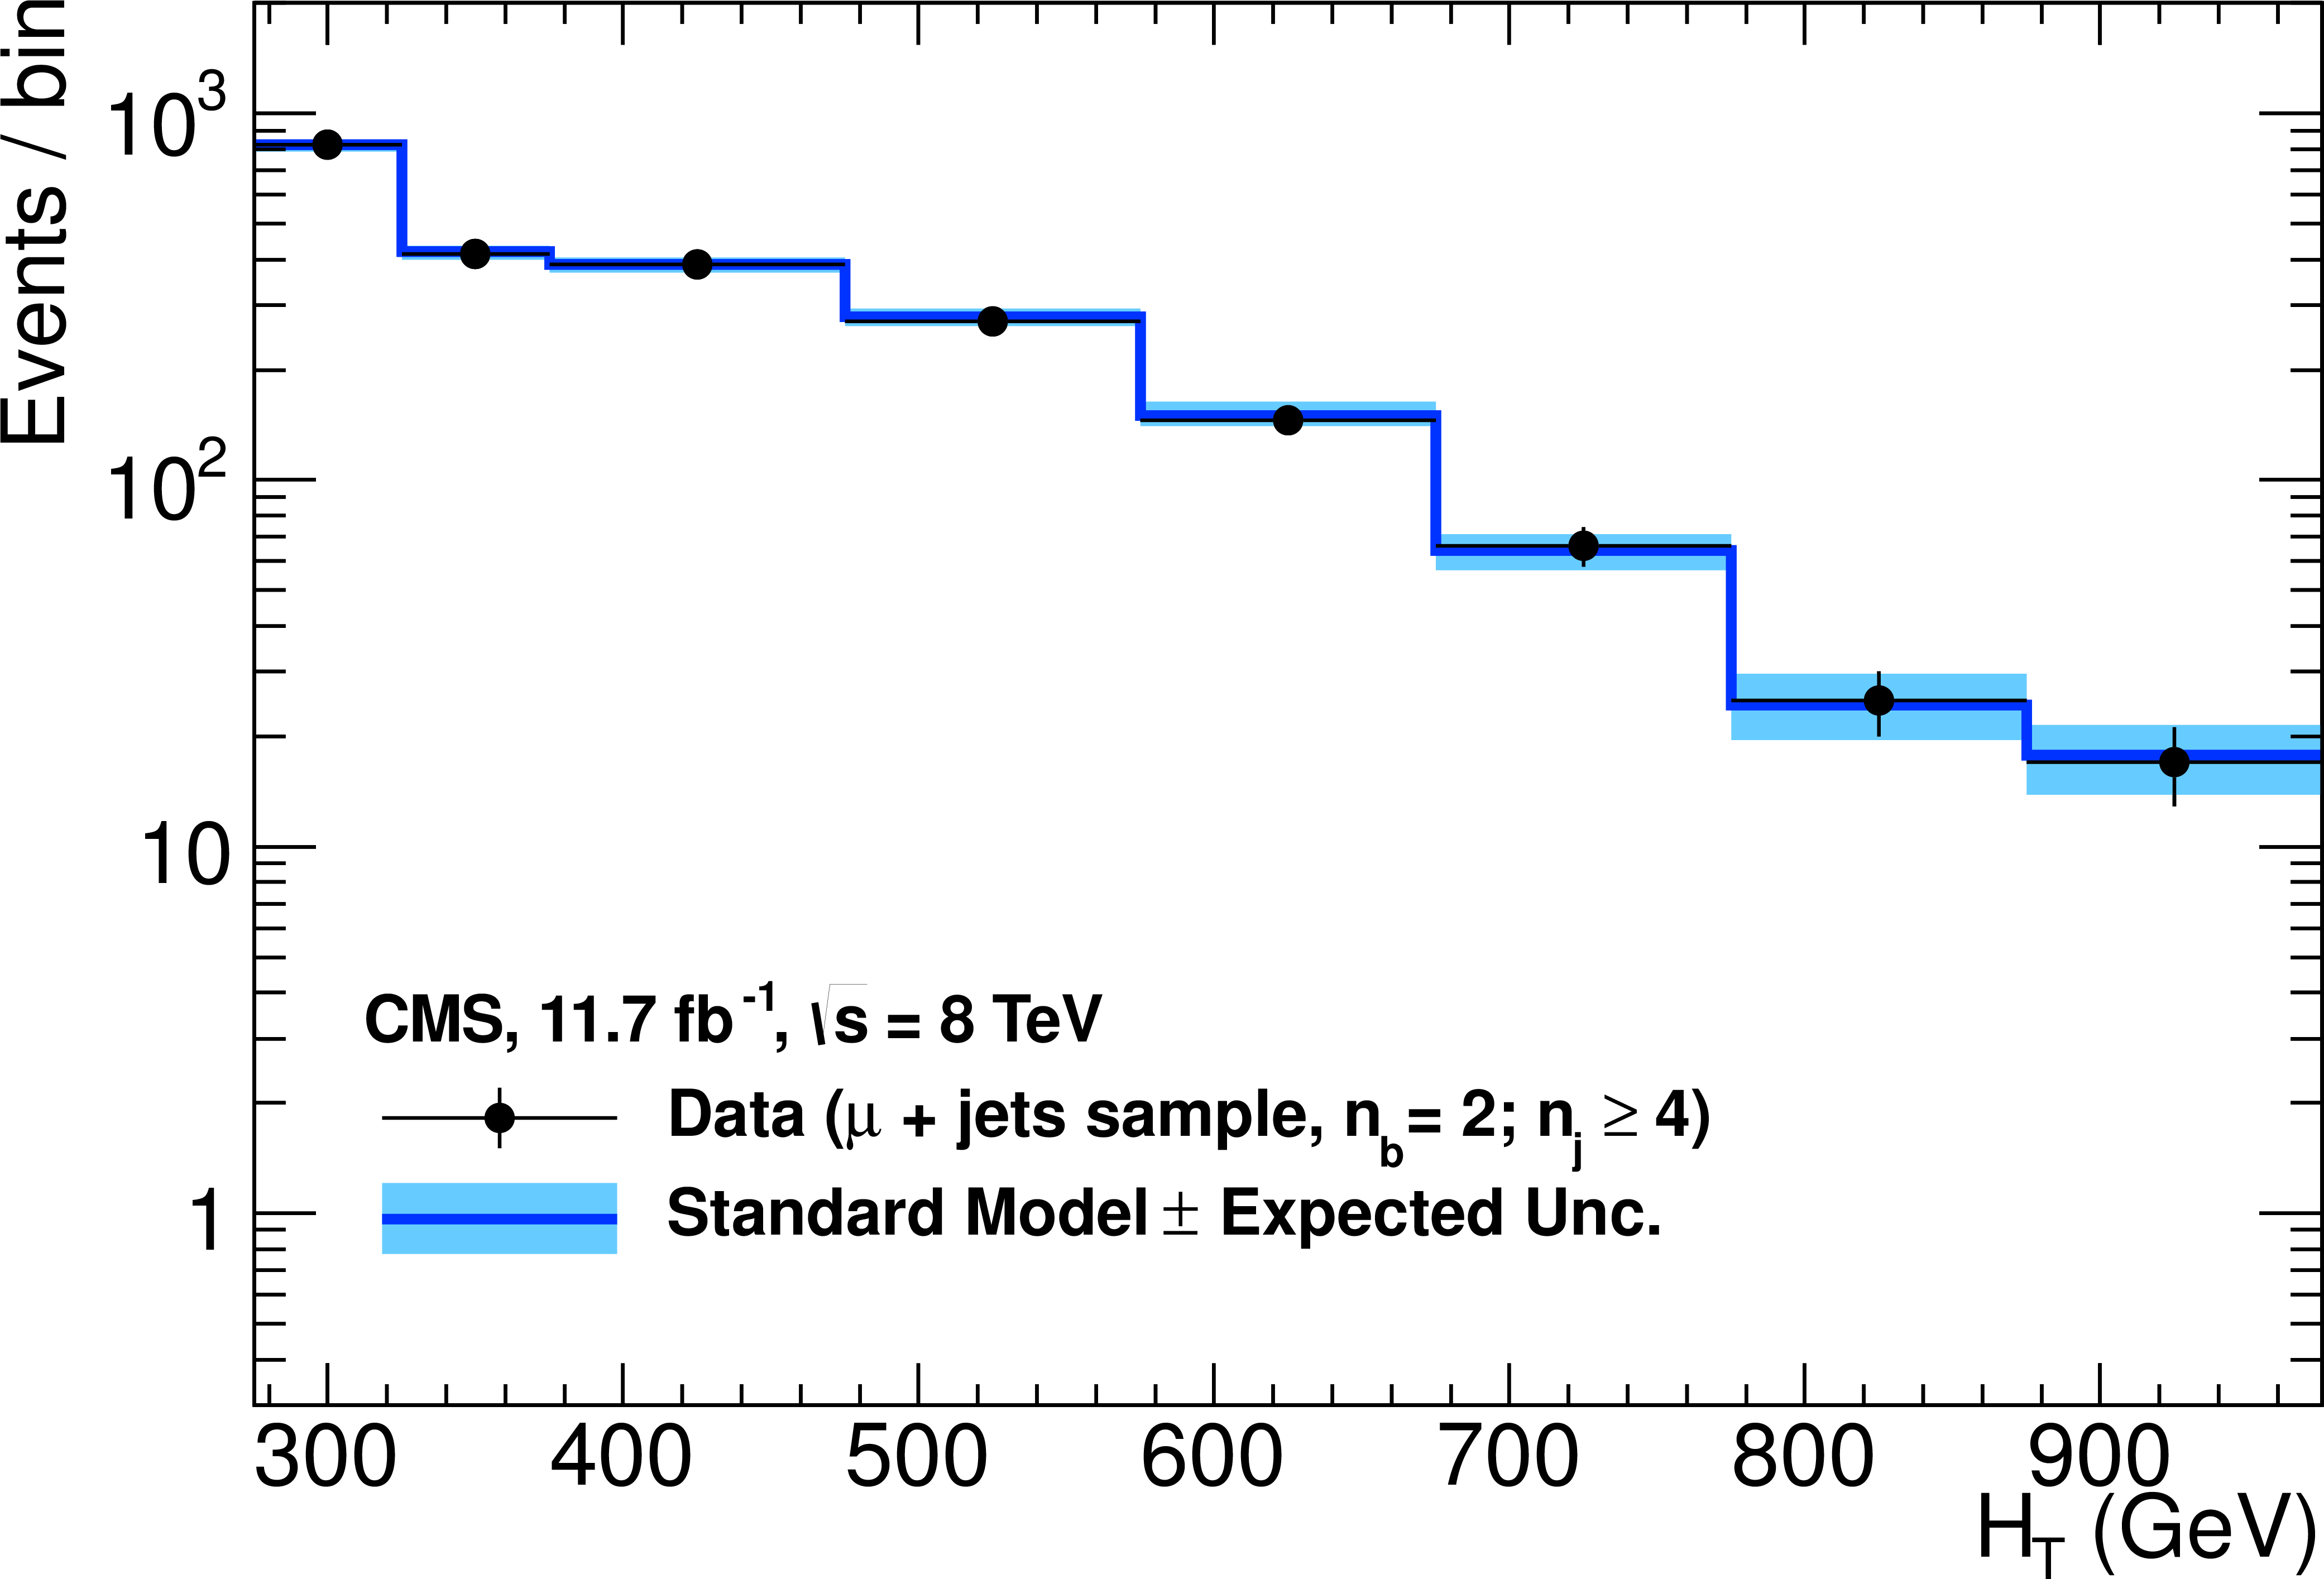
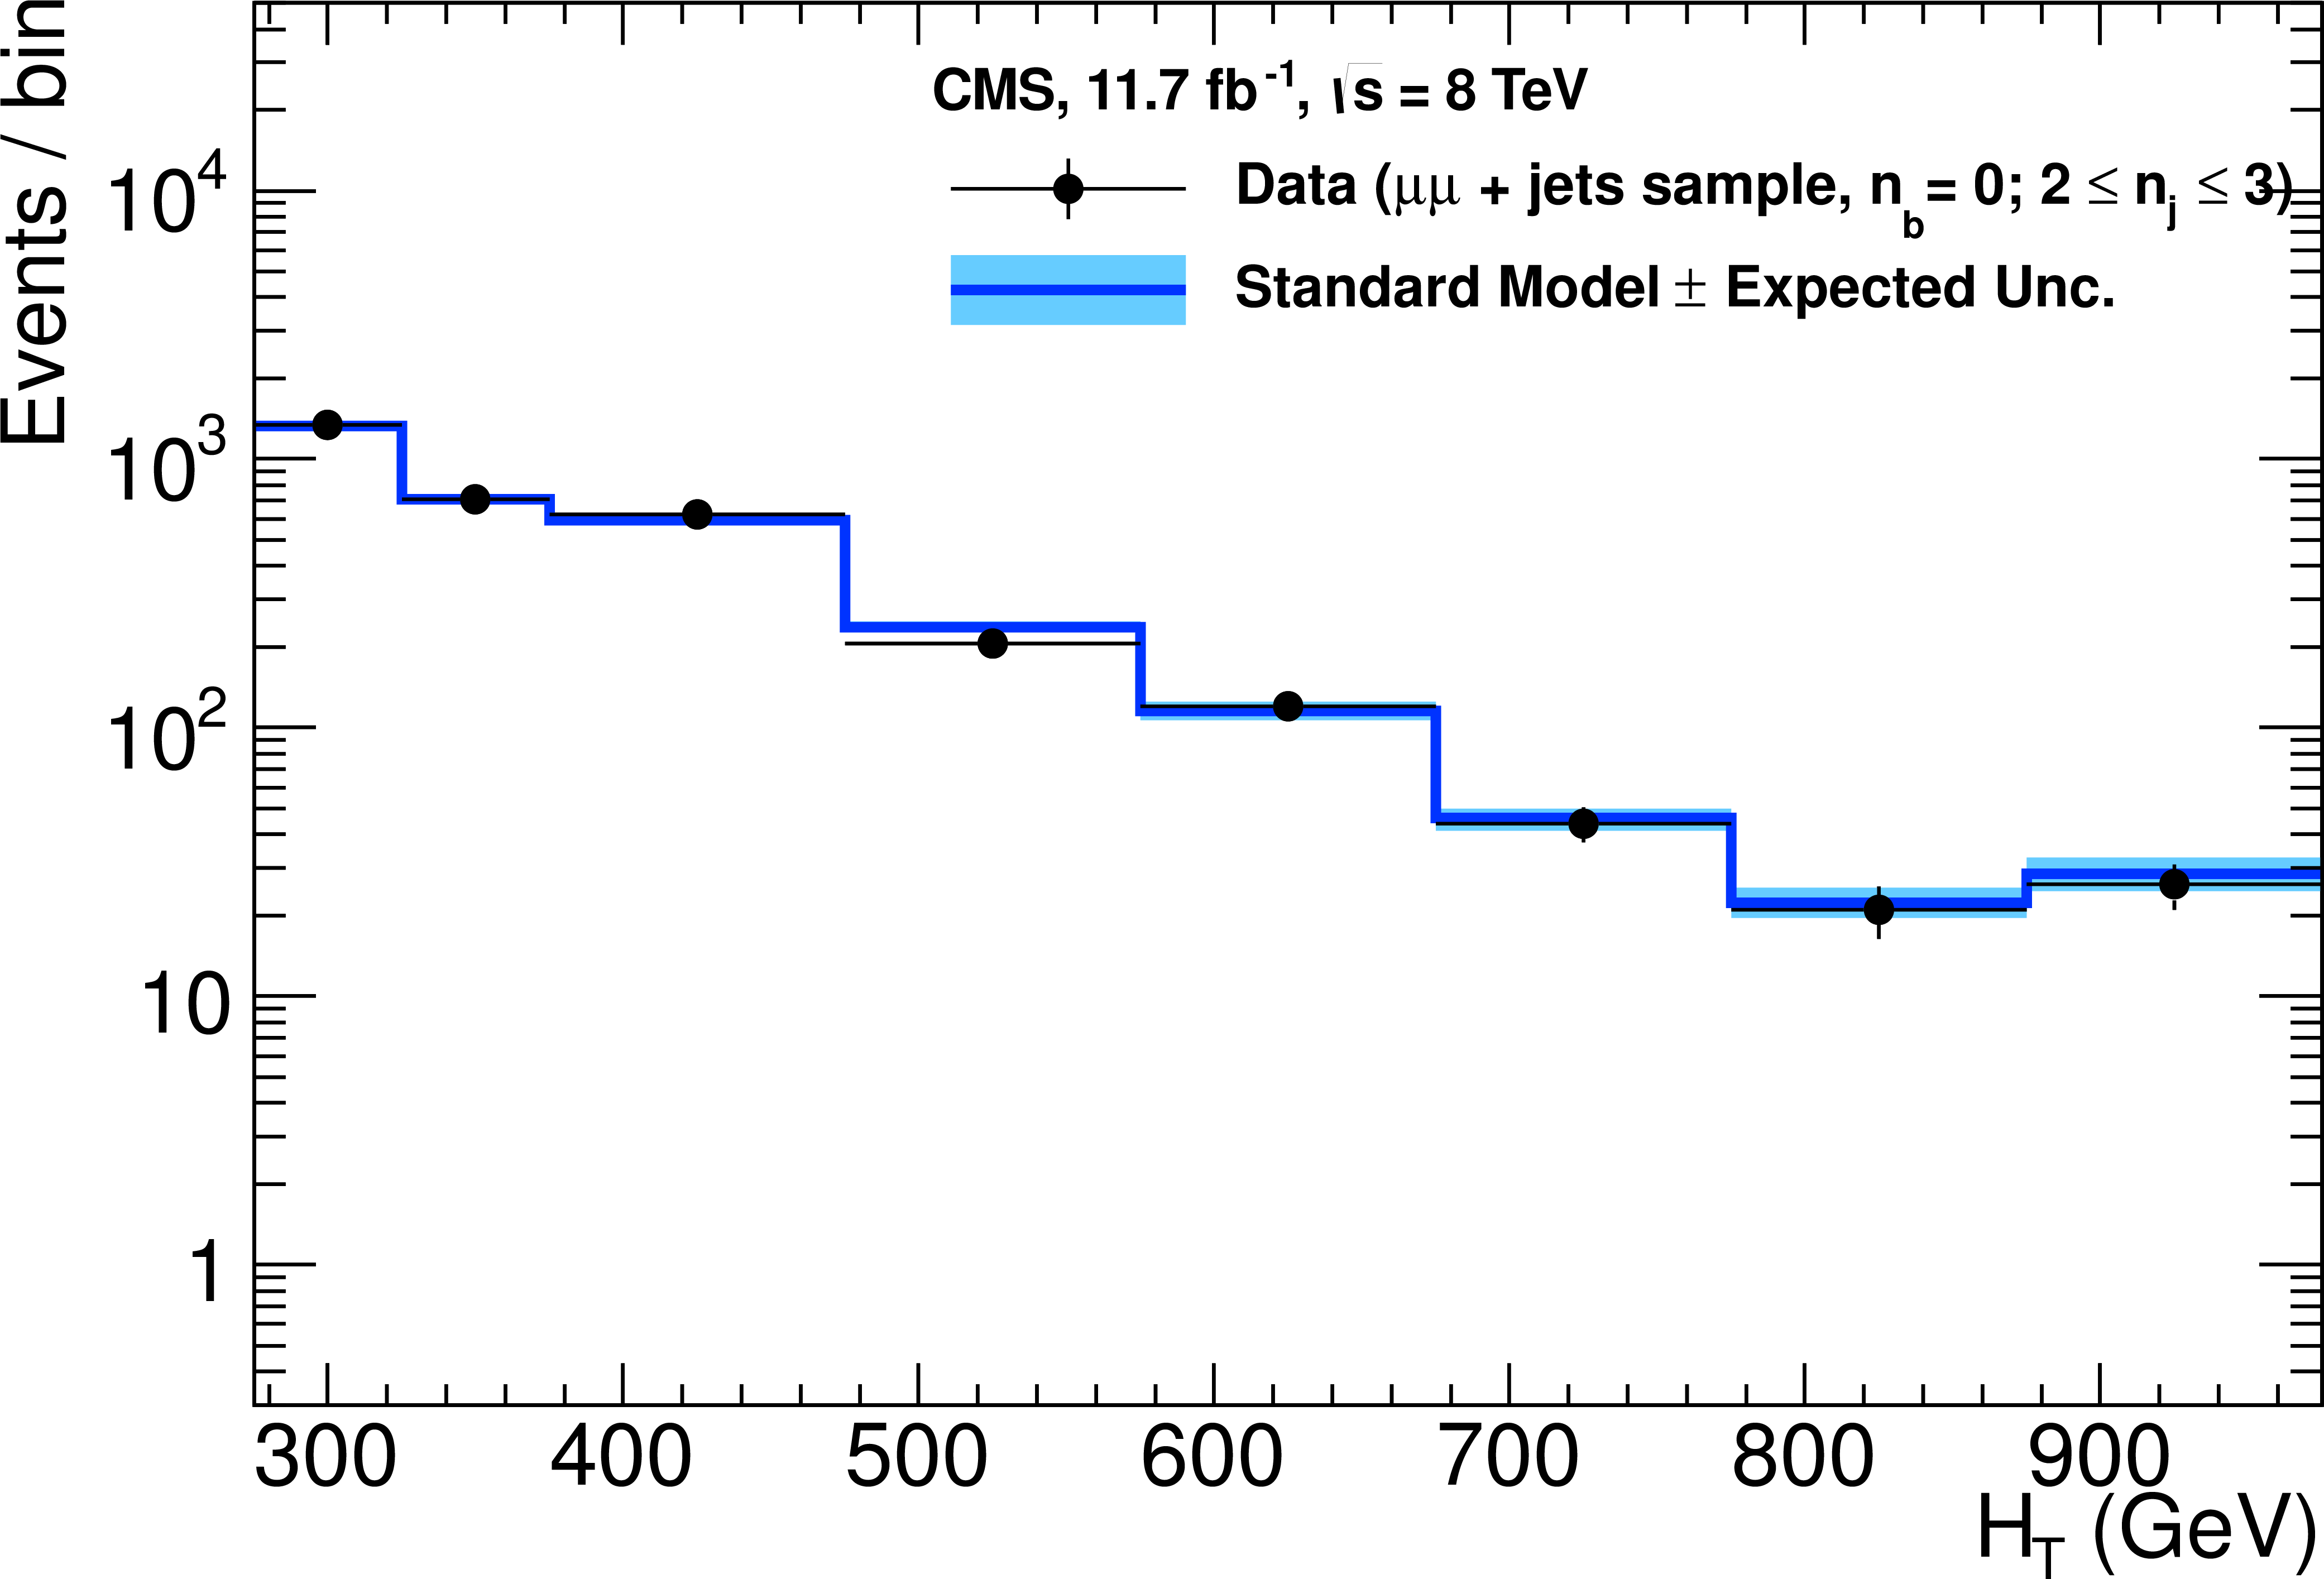
Event yields observed in data (solid circles) and SM expectations with their associated uncertainties (solid lines with bands) in bins of $H_\text {T}$ for: the $ {\mu + \text {jets}} $ (a), $ {\mu \mu + \text {jets}} $ (c), and $ {\gamma + \text {jets}} $ (e) control samples when requiring $ {2 \leq {n_{\text {jet}}} \leq 3} $ and exactly zero b-quark jets; and the ${\mu + \text {jets}} $ control sample when requiring $ { {n_{\text {jet}}} \geq 4} $ and exactly two (b), three (d), or at least four (f) b-quark jets. |
png pdf |
Figure 7-b:
Event yields observed in data (solid circles) and SM expectations with their associated uncertainties (solid lines with bands) in bins of $H_\text {T}$ for: the $ {\mu + \text {jets}} $ (a), $ {\mu \mu + \text {jets}} $ (c), and $ {\gamma + \text {jets}} $ (e) control samples when requiring $ {2 \leq {n_{\text {jet}}} \leq 3} $ and exactly zero b-quark jets; and the ${\mu + \text {jets}} $ control sample when requiring $ { {n_{\text {jet}}} \geq 4} $ and exactly two (b), three (d), or at least four (f) b-quark jets. |
png pdf |
Figure 7-c:
Event yields observed in data (solid circles) and SM expectations with their associated uncertainties (solid lines with bands) in bins of $H_\text {T}$ for: the $ {\mu + \text {jets}} $ (a), $ {\mu \mu + \text {jets}} $ (c), and $ {\gamma + \text {jets}} $ (e) control samples when requiring $ {2 \leq {n_{\text {jet}}} \leq 3} $ and exactly zero b-quark jets; and the ${\mu + \text {jets}} $ control sample when requiring $ { {n_{\text {jet}}} \geq 4} $ and exactly two (b), three (d), or at least four (f) b-quark jets. |
png pdf |
Figure 7-d:
Event yields observed in data (solid circles) and SM expectations with their associated uncertainties (solid lines with bands) in bins of $H_\text {T}$ for: the $ {\mu + \text {jets}} $ (a), $ {\mu \mu + \text {jets}} $ (c), and $ {\gamma + \text {jets}} $ (e) control samples when requiring $ {2 \leq {n_{\text {jet}}} \leq 3} $ and exactly zero b-quark jets; and the ${\mu + \text {jets}} $ control sample when requiring $ { {n_{\text {jet}}} \geq 4} $ and exactly two (b), three (d), or at least four (f) b-quark jets. |
png pdf |
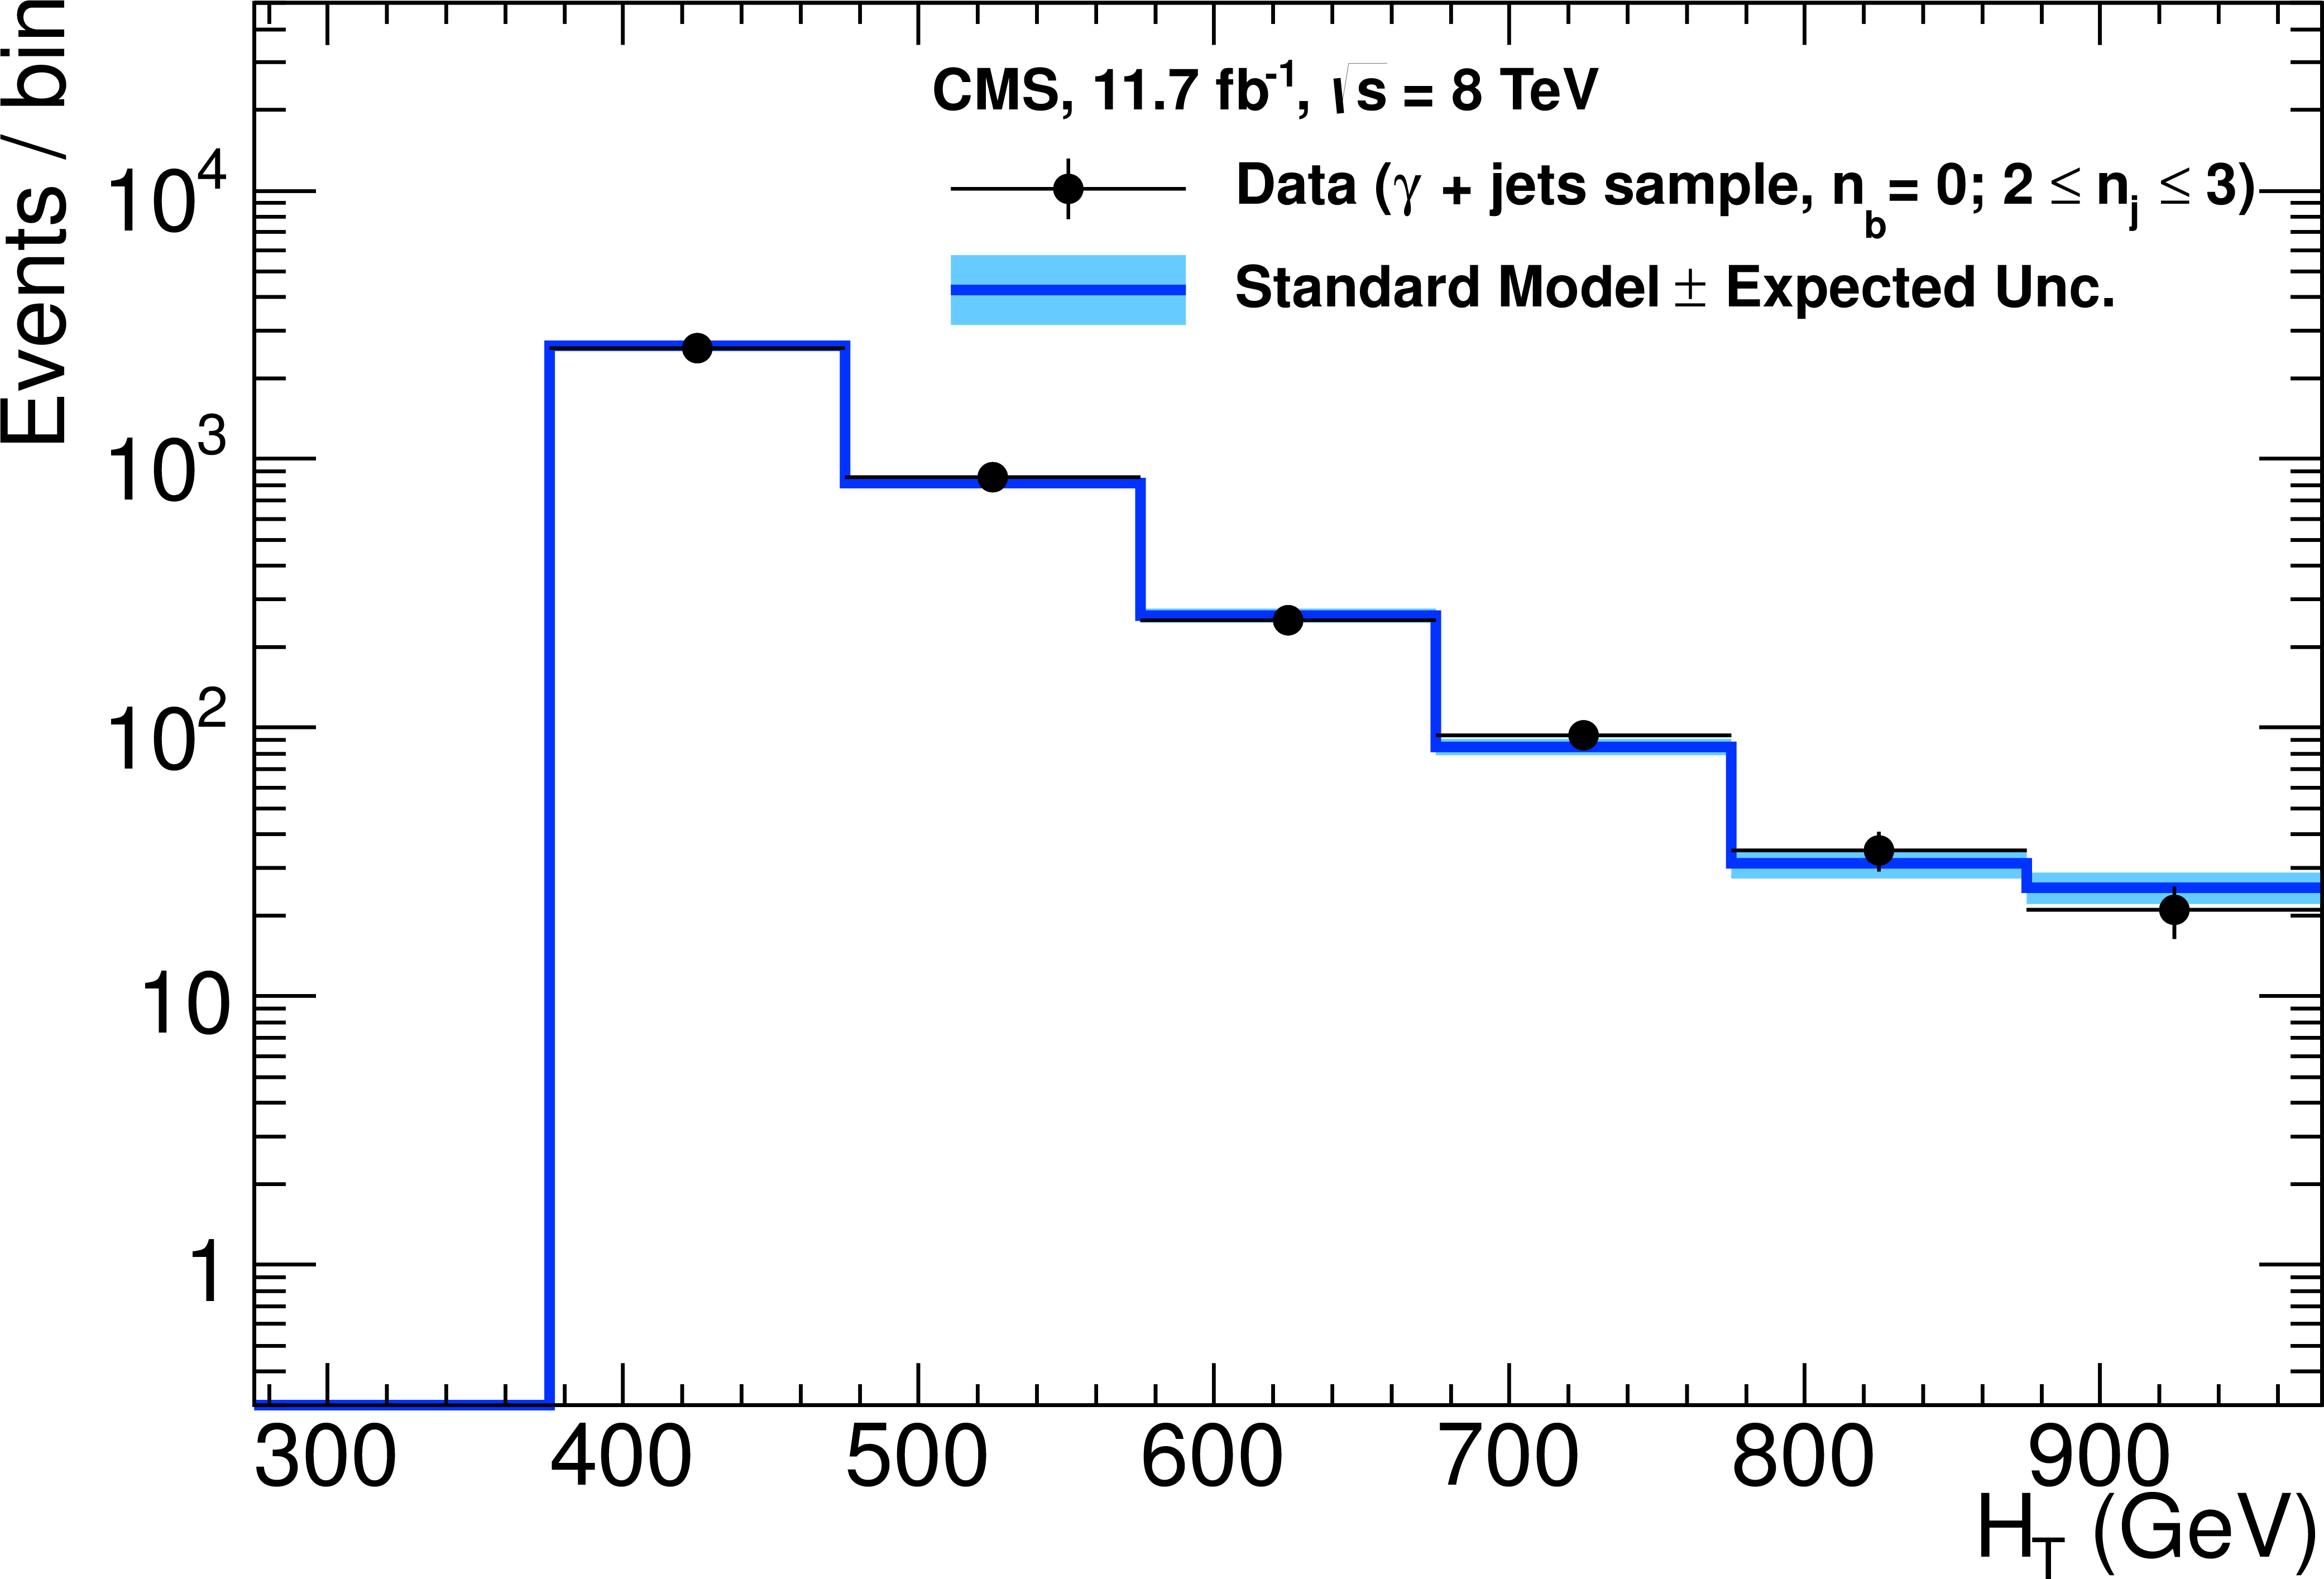
Figure 7-e:
Event yields observed in data (solid circles) and SM expectations with their associated uncertainties (solid lines with bands) in bins of $H_\text {T}$ for: the $ {\mu + \text {jets}} $ (a), $ {\mu \mu + \text {jets}} $ (c), and $ {\gamma + \text {jets}} $ (e) control samples when requiring $ {2 \leq {n_{\text {jet}}} \leq 3} $ and exactly zero b-quark jets; and the ${\mu + \text {jets}} $ control sample when requiring $ { {n_{\text {jet}}} \geq 4} $ and exactly two (b), three (d), or at least four (f) b-quark jets. |
png pdf |
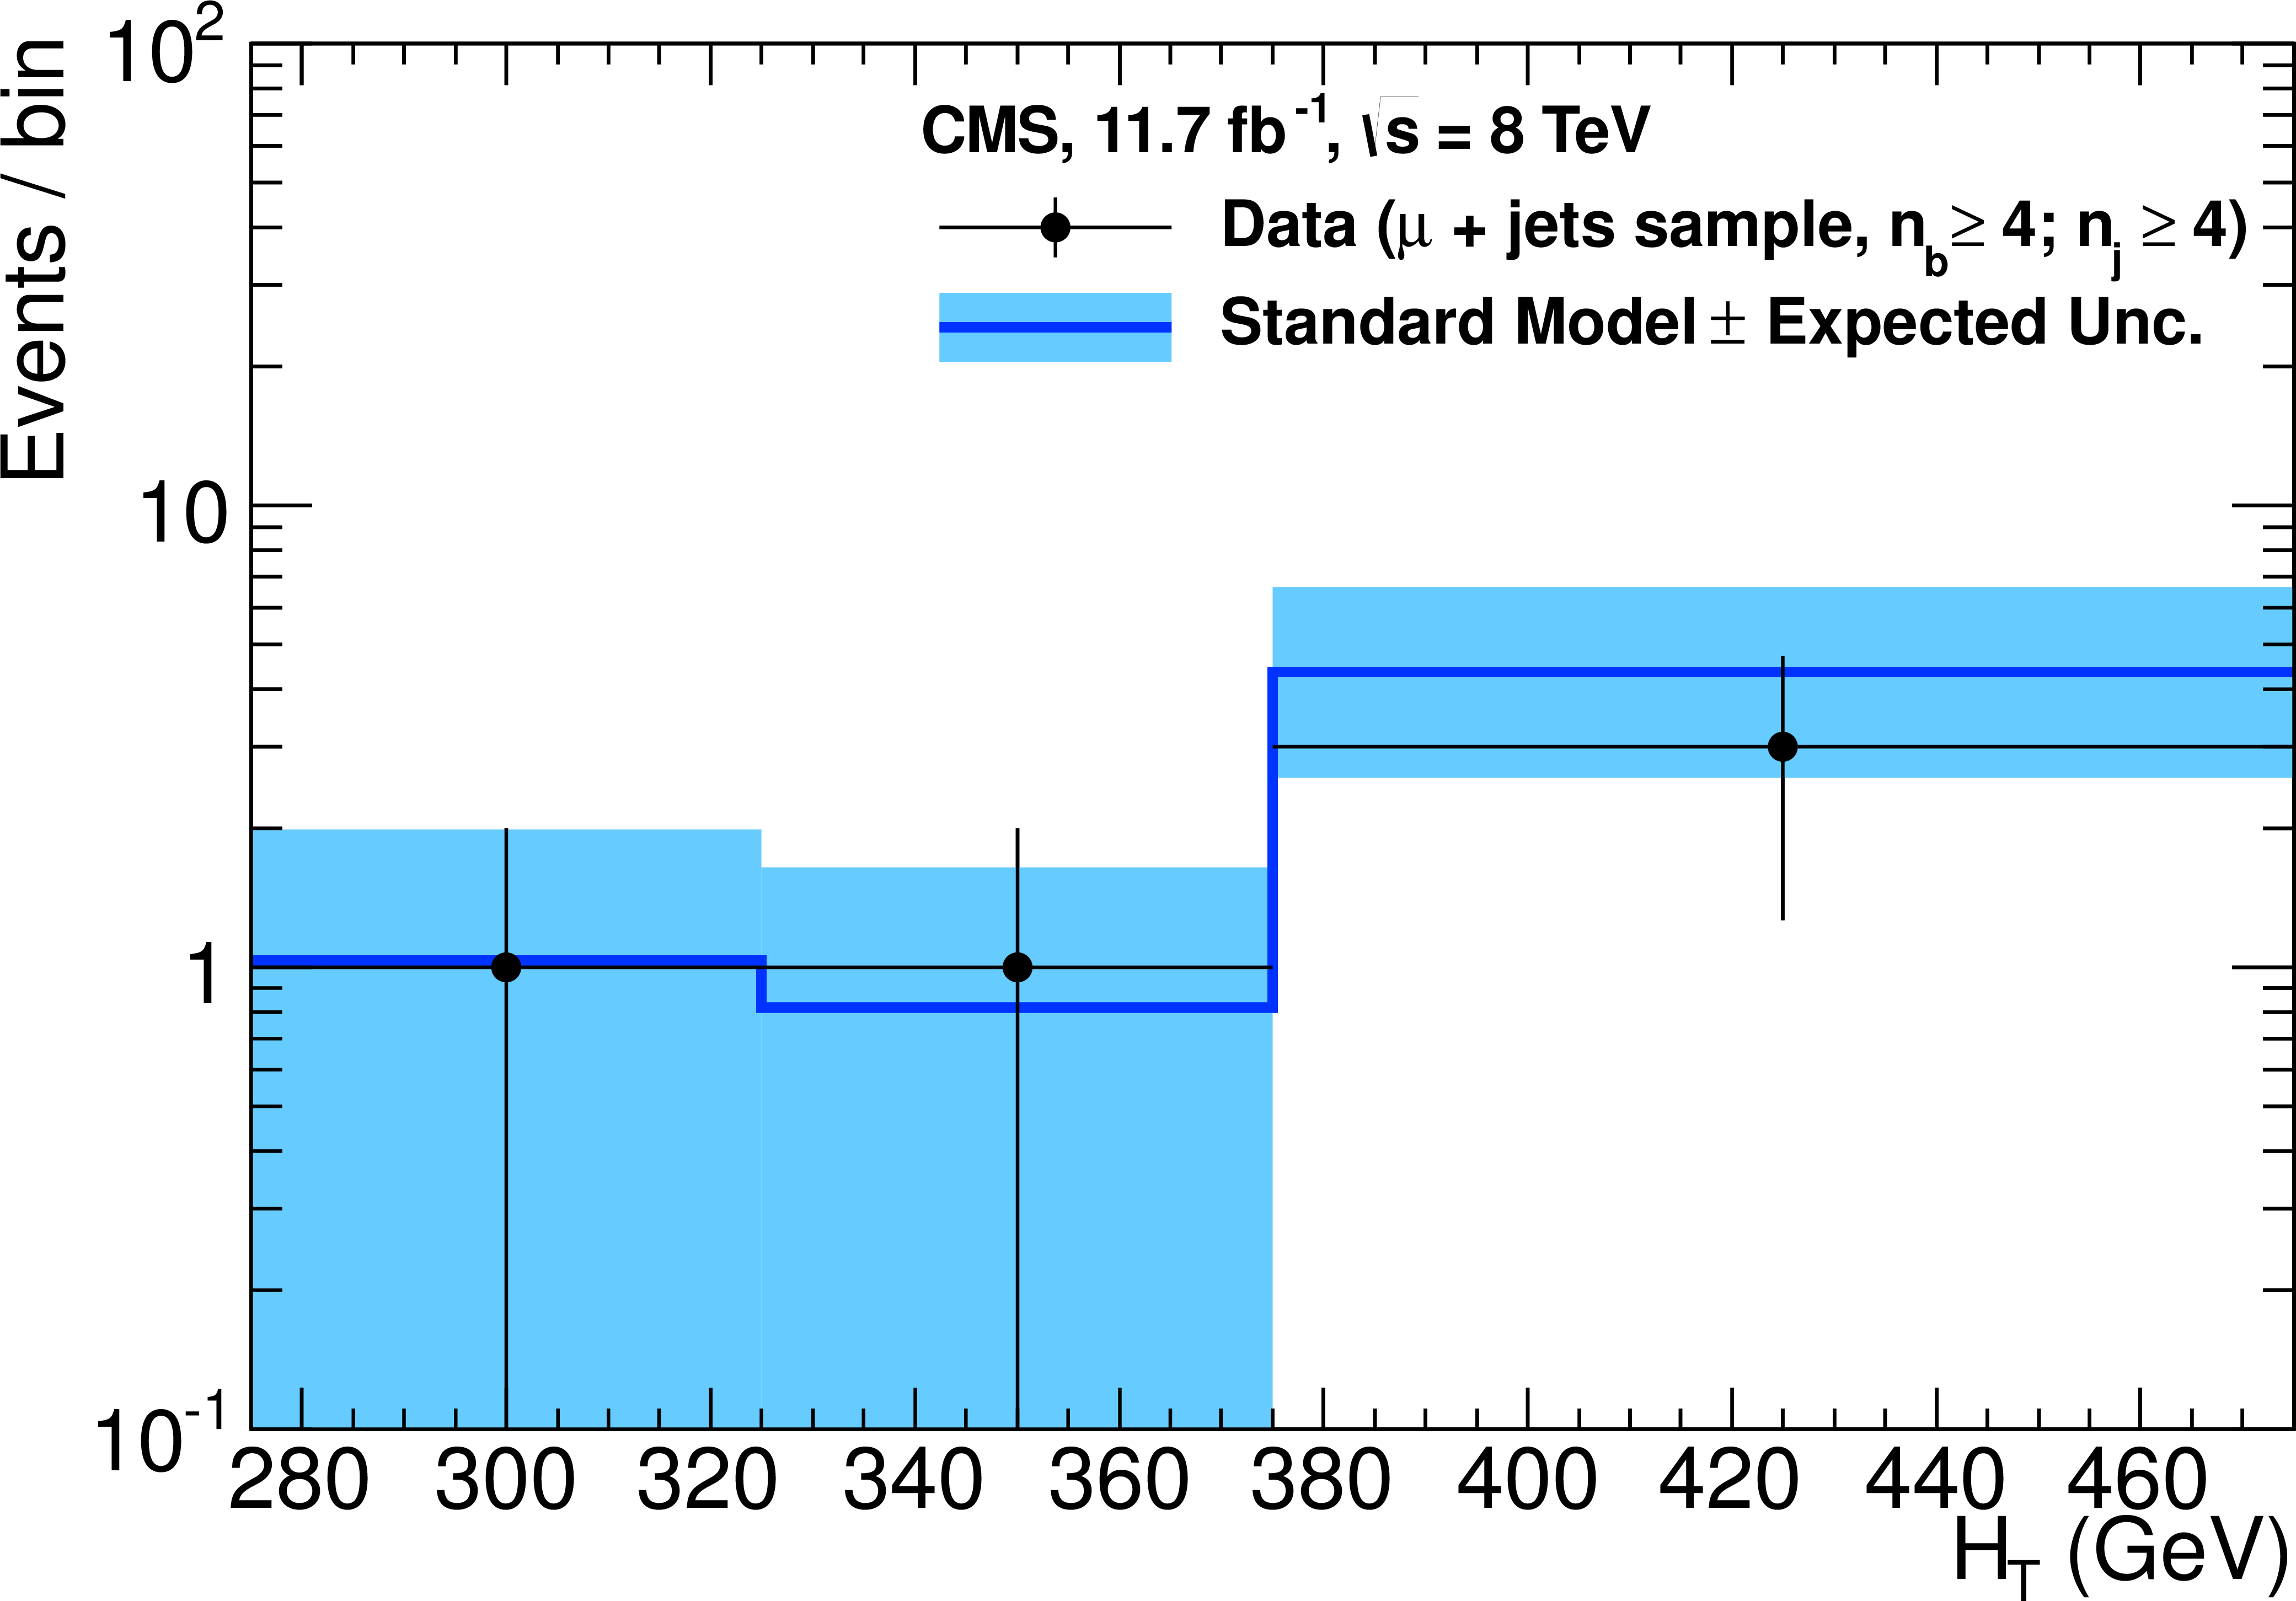
Figure 7-f:
Event yields observed in data (solid circles) and SM expectations with their associated uncertainties (solid lines with bands) in bins of $H_\text {T}$ for: the $ {\mu + \text {jets}} $ (a), $ {\mu \mu + \text {jets}} $ (c), and $ {\gamma + \text {jets}} $ (e) control samples when requiring $ {2 \leq {n_{\text {jet}}} \leq 3} $ and exactly zero b-quark jets; and the ${\mu + \text {jets}} $ control sample when requiring $ { {n_{\text {jet}}} \geq 4} $ and exactly two (b), three (d), or at least four (f) b-quark jets. |
png pdf |
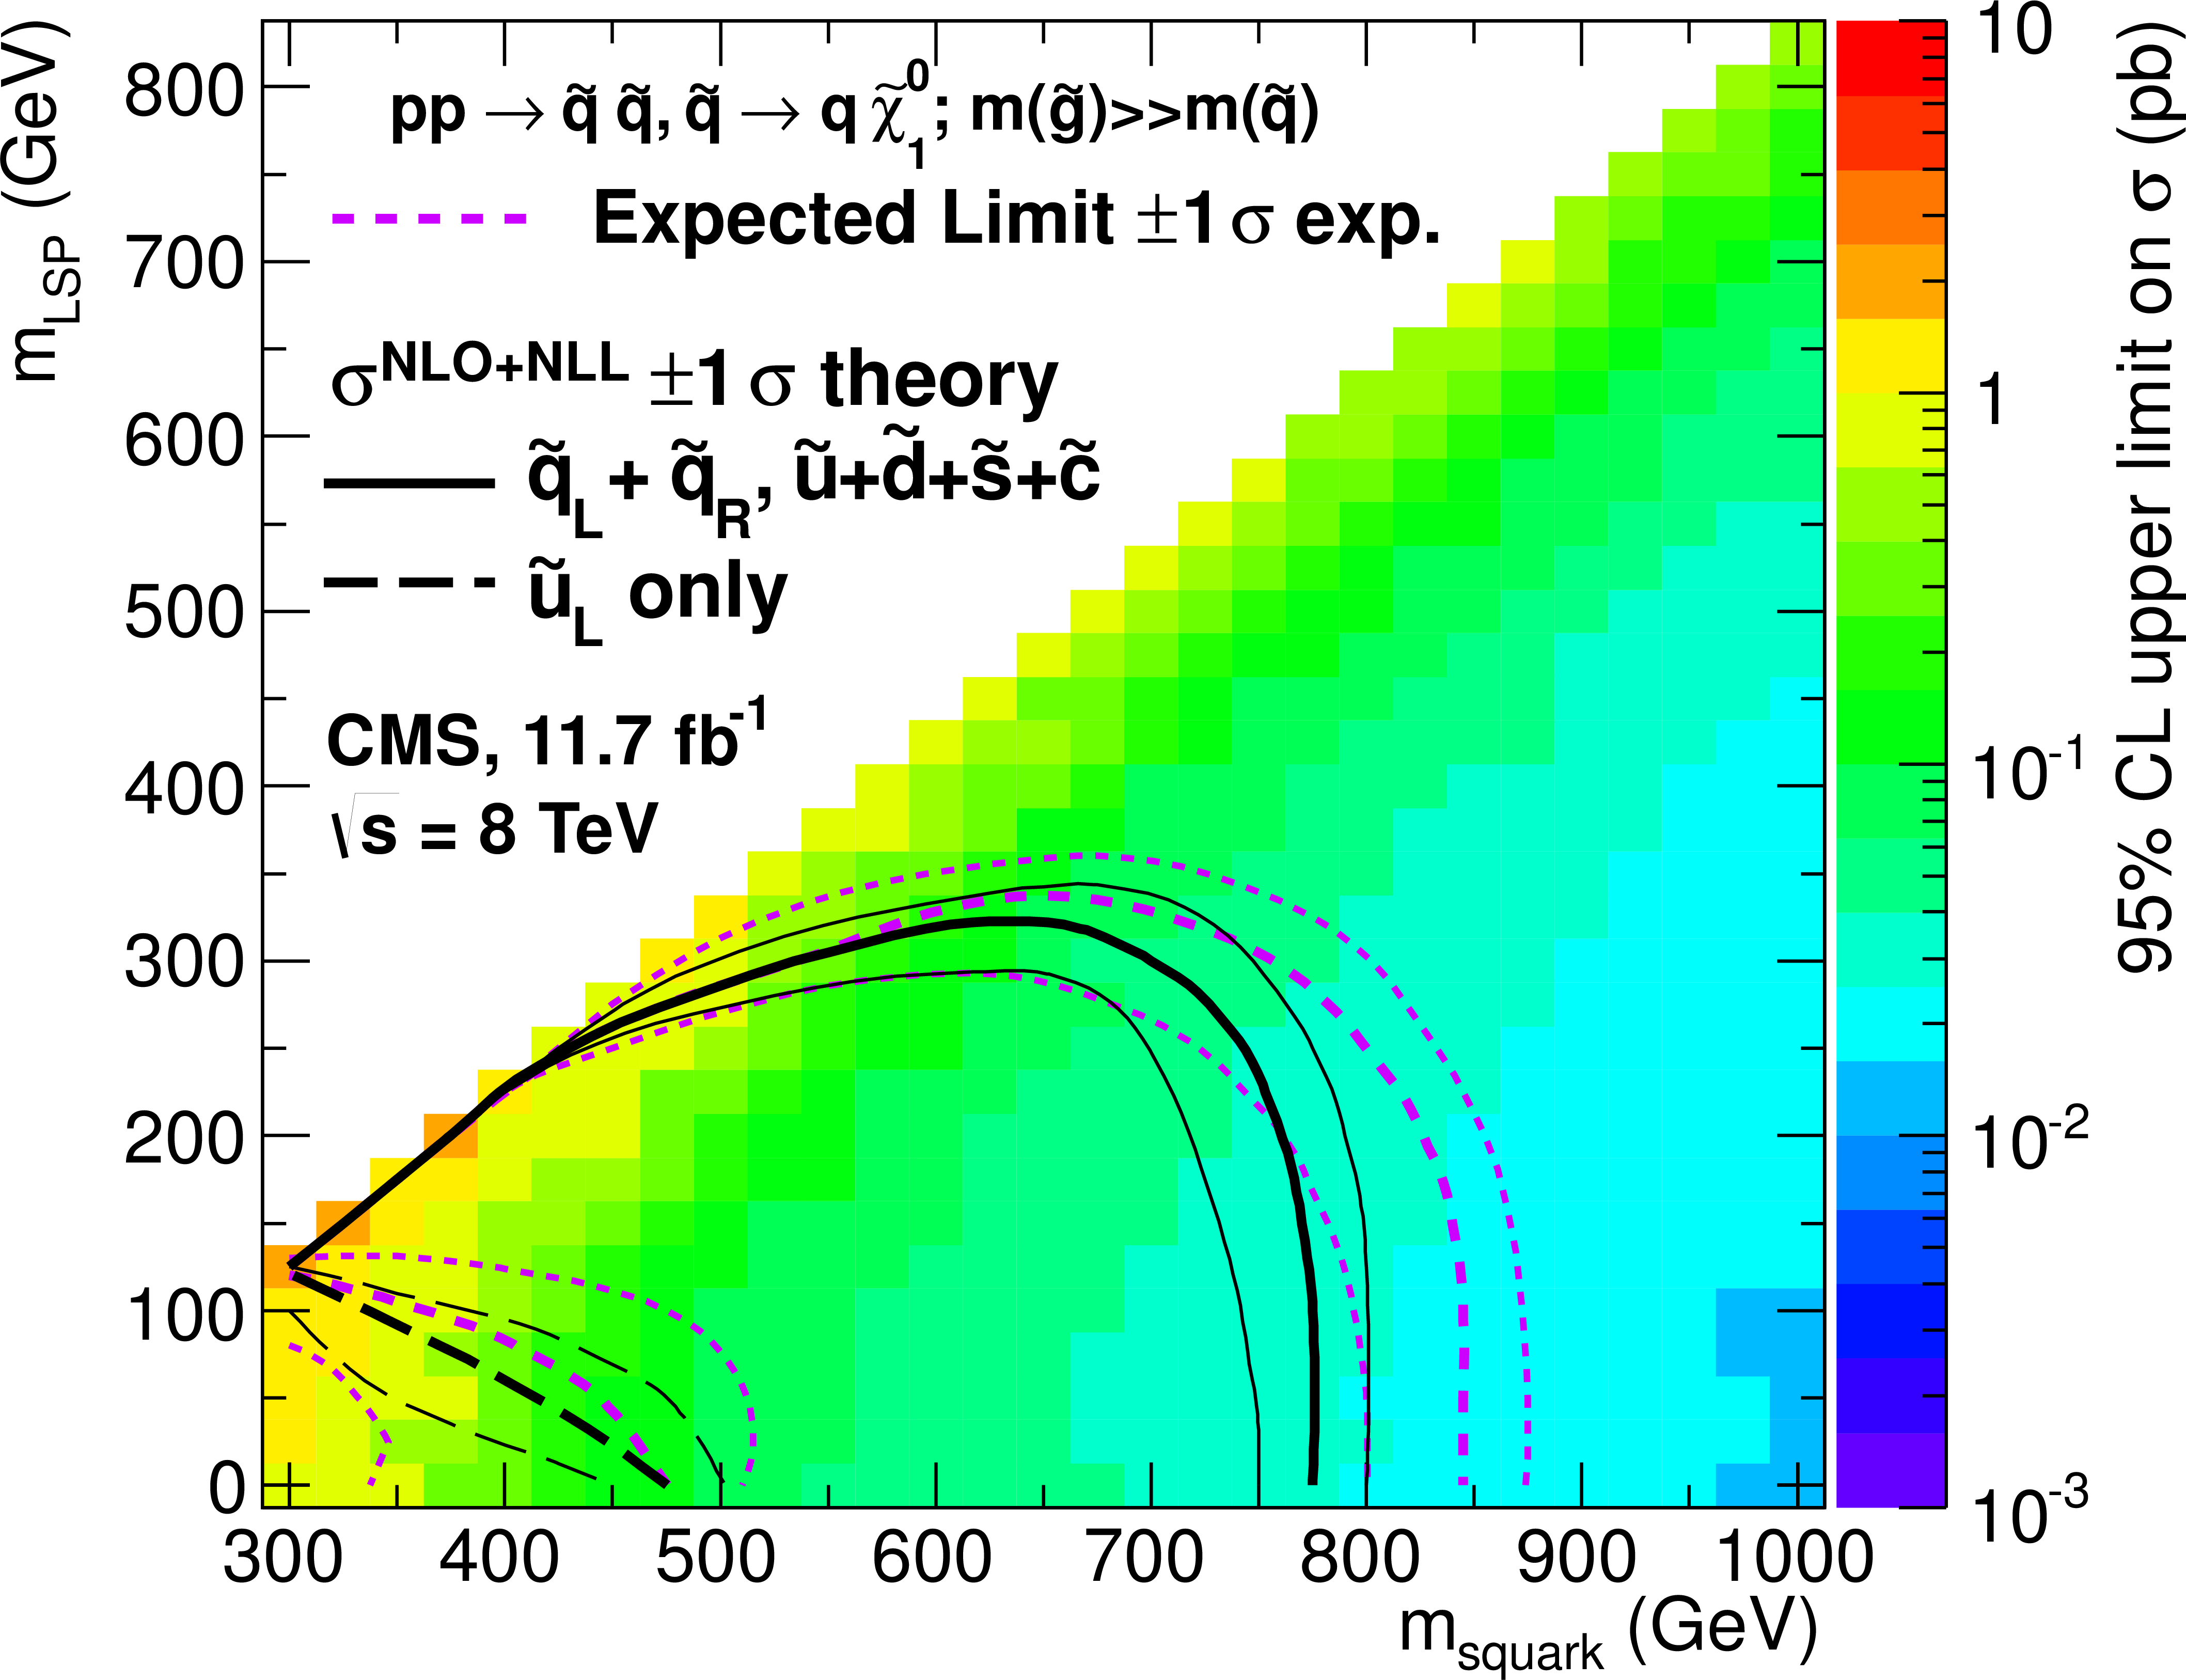
Figure 8-a:
Observed upper limit on the production cross section at 95% CL (indicated by the colour scale) as a function of the parent and LSP sparticle masses for simplified models involving: the direct pair production of eight first- and second-generation squarks with degenerate masses or only a single light squark ($\texttt {D1} $, a); the direct pair production of bottom squarks ($\texttt {D2} $, b); and pair-produced gluinos followed by the decay of each gluino to the LSP and pairs of first- and second-generation quarks ($\texttt {G1} $, c), bottom quarks ($\texttt {G2} $, d), or top quarks ($\texttt {G3} $, f). The black solid (or dashed) thick line indicates the observed exclusion assuming NLO+NLL SUSY production cross section. The black solid (or dashed) thin lines represent the observed exclusions when varying the cross section by its theoretical uncertainty. The purple dashed thick (thin) line indicates the median (${\pm }1 \sigma $) expected exclusion. No interpretation is provided for the kinematic region defined by 0 $< {m_{\text {parent}}} - {m_{\mathrm {LSP}}} < $175 GeV or $ {m_{\text {parent}}} <$ 300 GeV, as discussed in the text. |
png pdf |
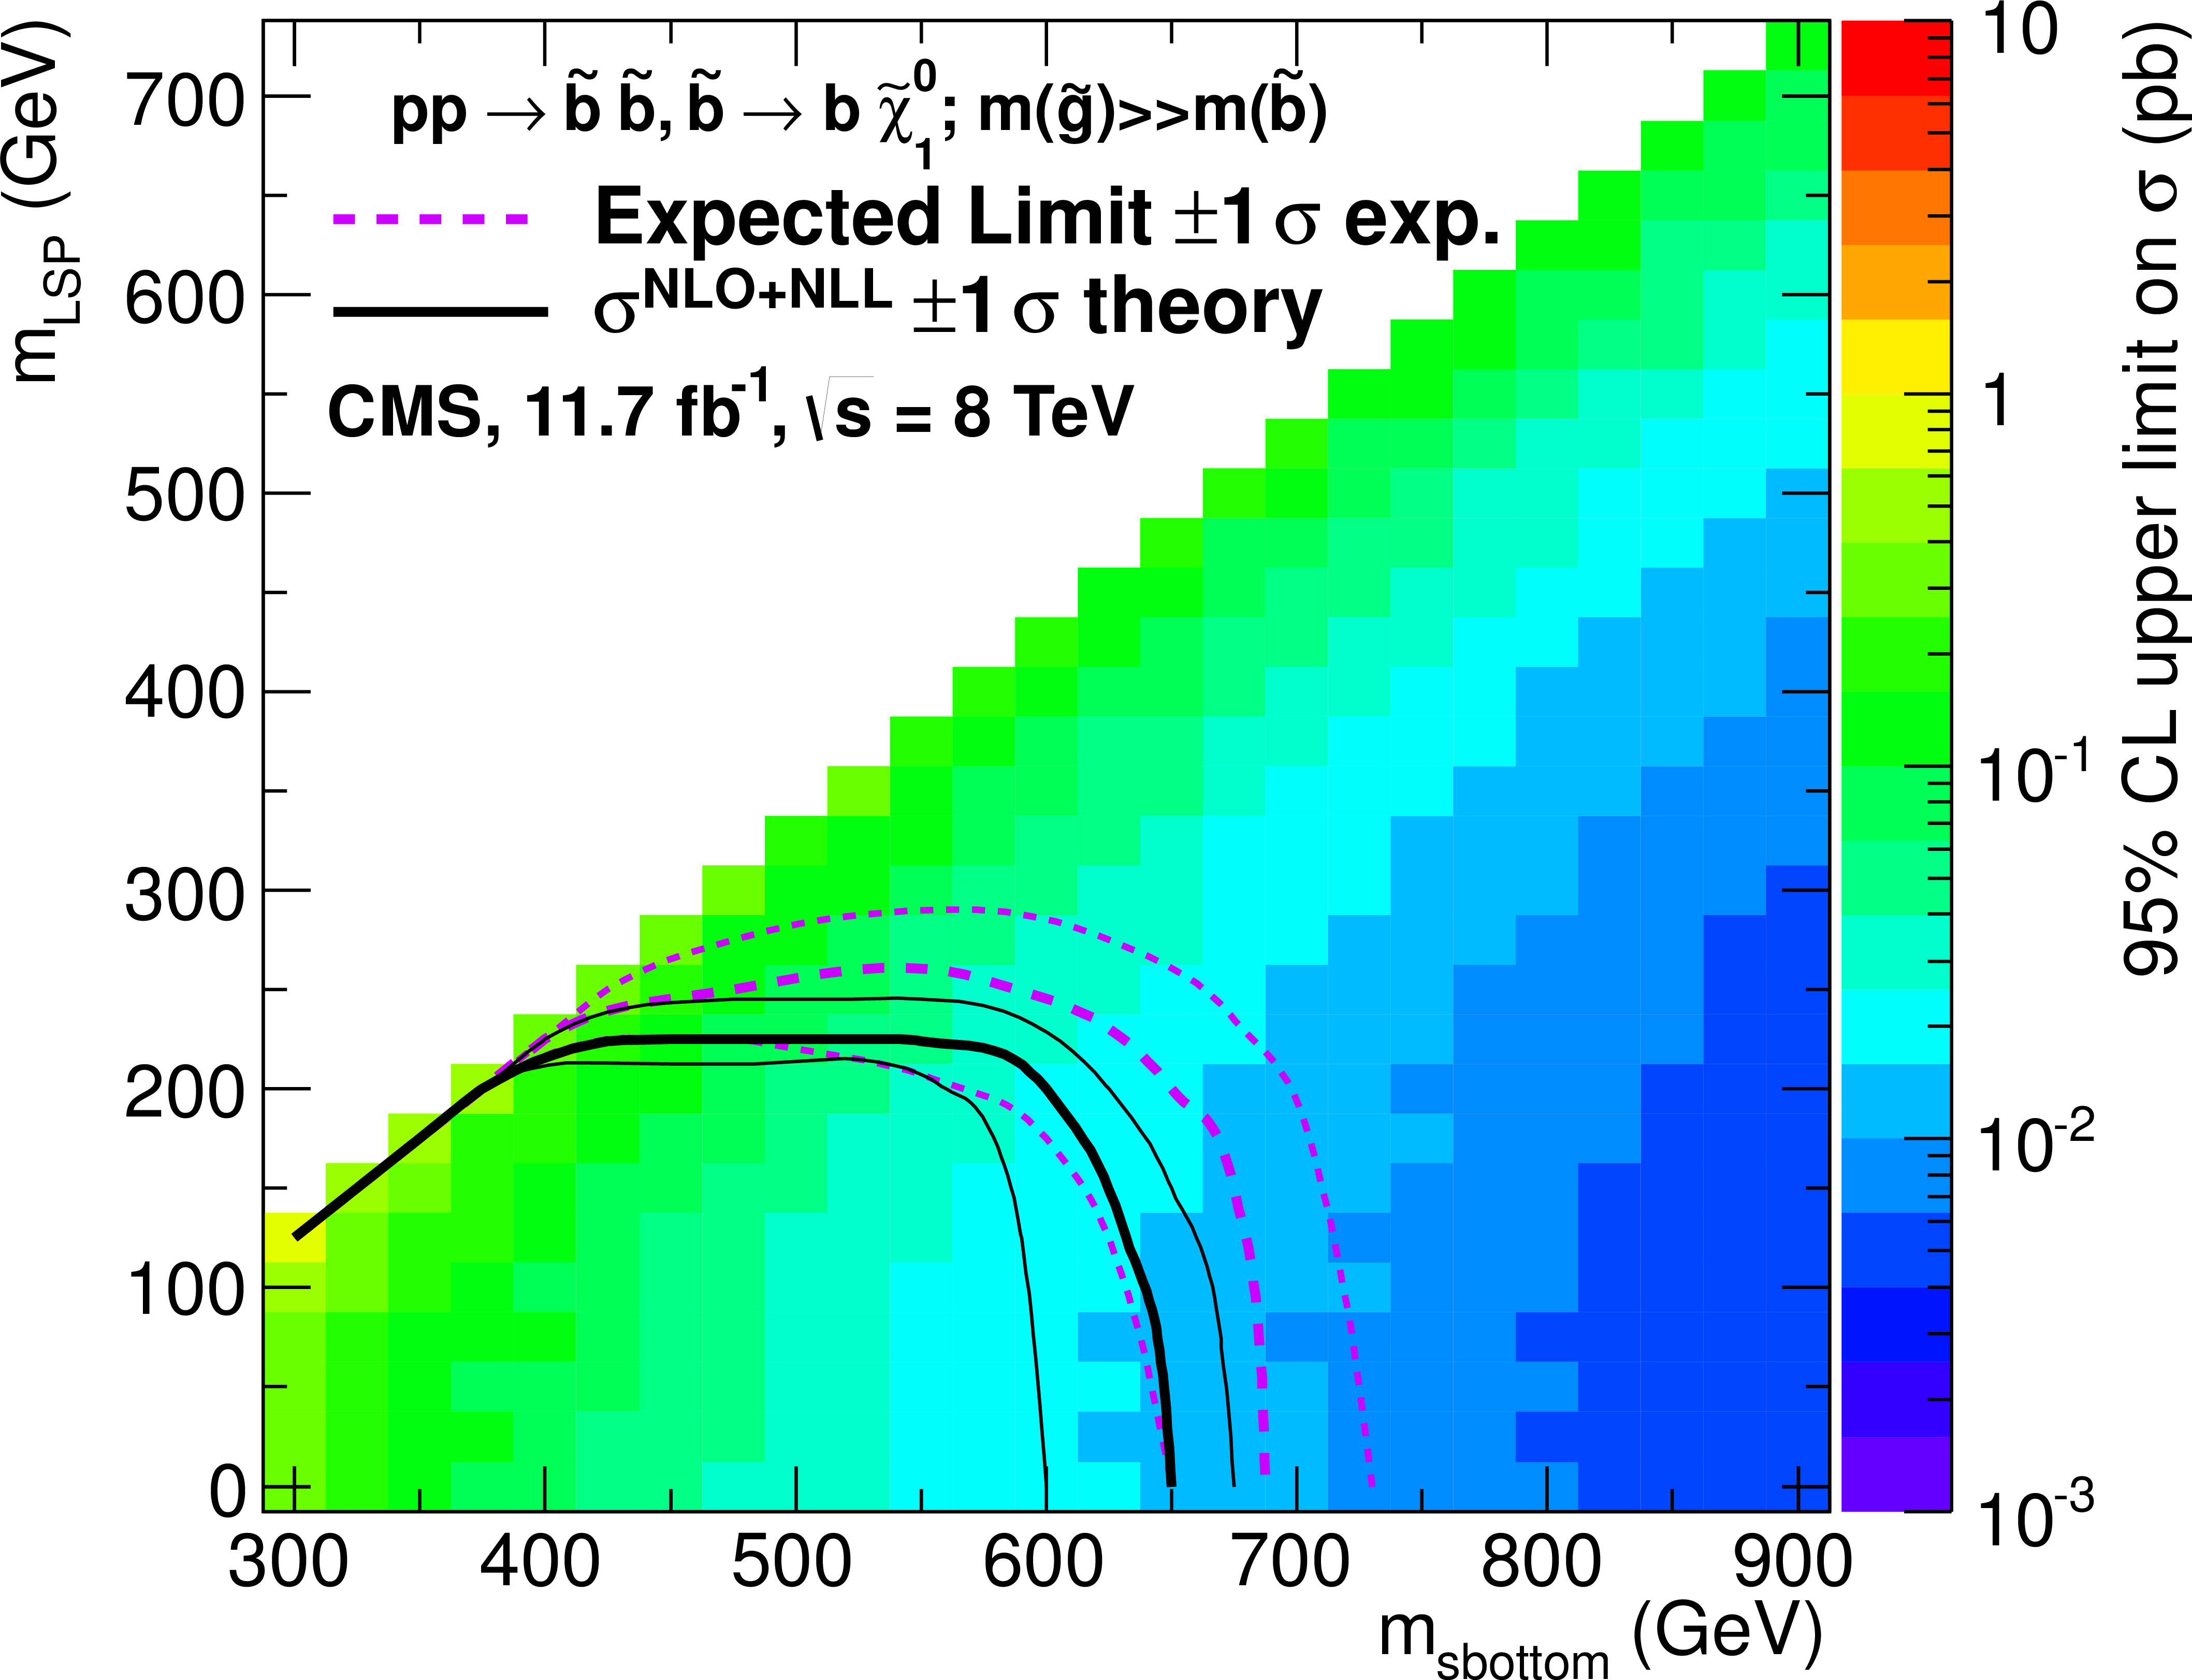
Figure 8-b:
Observed upper limit on the production cross section at 95% CL (indicated by the colour scale) as a function of the parent and LSP sparticle masses for simplified models involving: the direct pair production of eight first- and second-generation squarks with degenerate masses or only a single light squark ($\texttt {D1} $, a); the direct pair production of bottom squarks ($\texttt {D2} $, b); and pair-produced gluinos followed by the decay of each gluino to the LSP and pairs of first- and second-generation quarks ($\texttt {G1} $, c), bottom quarks ($\texttt {G2} $, d), or top quarks ($\texttt {G3} $, f). The black solid (or dashed) thick line indicates the observed exclusion assuming NLO+NLL SUSY production cross section. The black solid (or dashed) thin lines represent the observed exclusions when varying the cross section by its theoretical uncertainty. The purple dashed thick (thin) line indicates the median (${\pm }1 \sigma $) expected exclusion. No interpretation is provided for the kinematic region defined by 0 $< {m_{\text {parent}}} - {m_{\mathrm {LSP}}} < $175 GeV or $ {m_{\text {parent}}} <$ 300 GeV, as discussed in the text. |
png pdf |
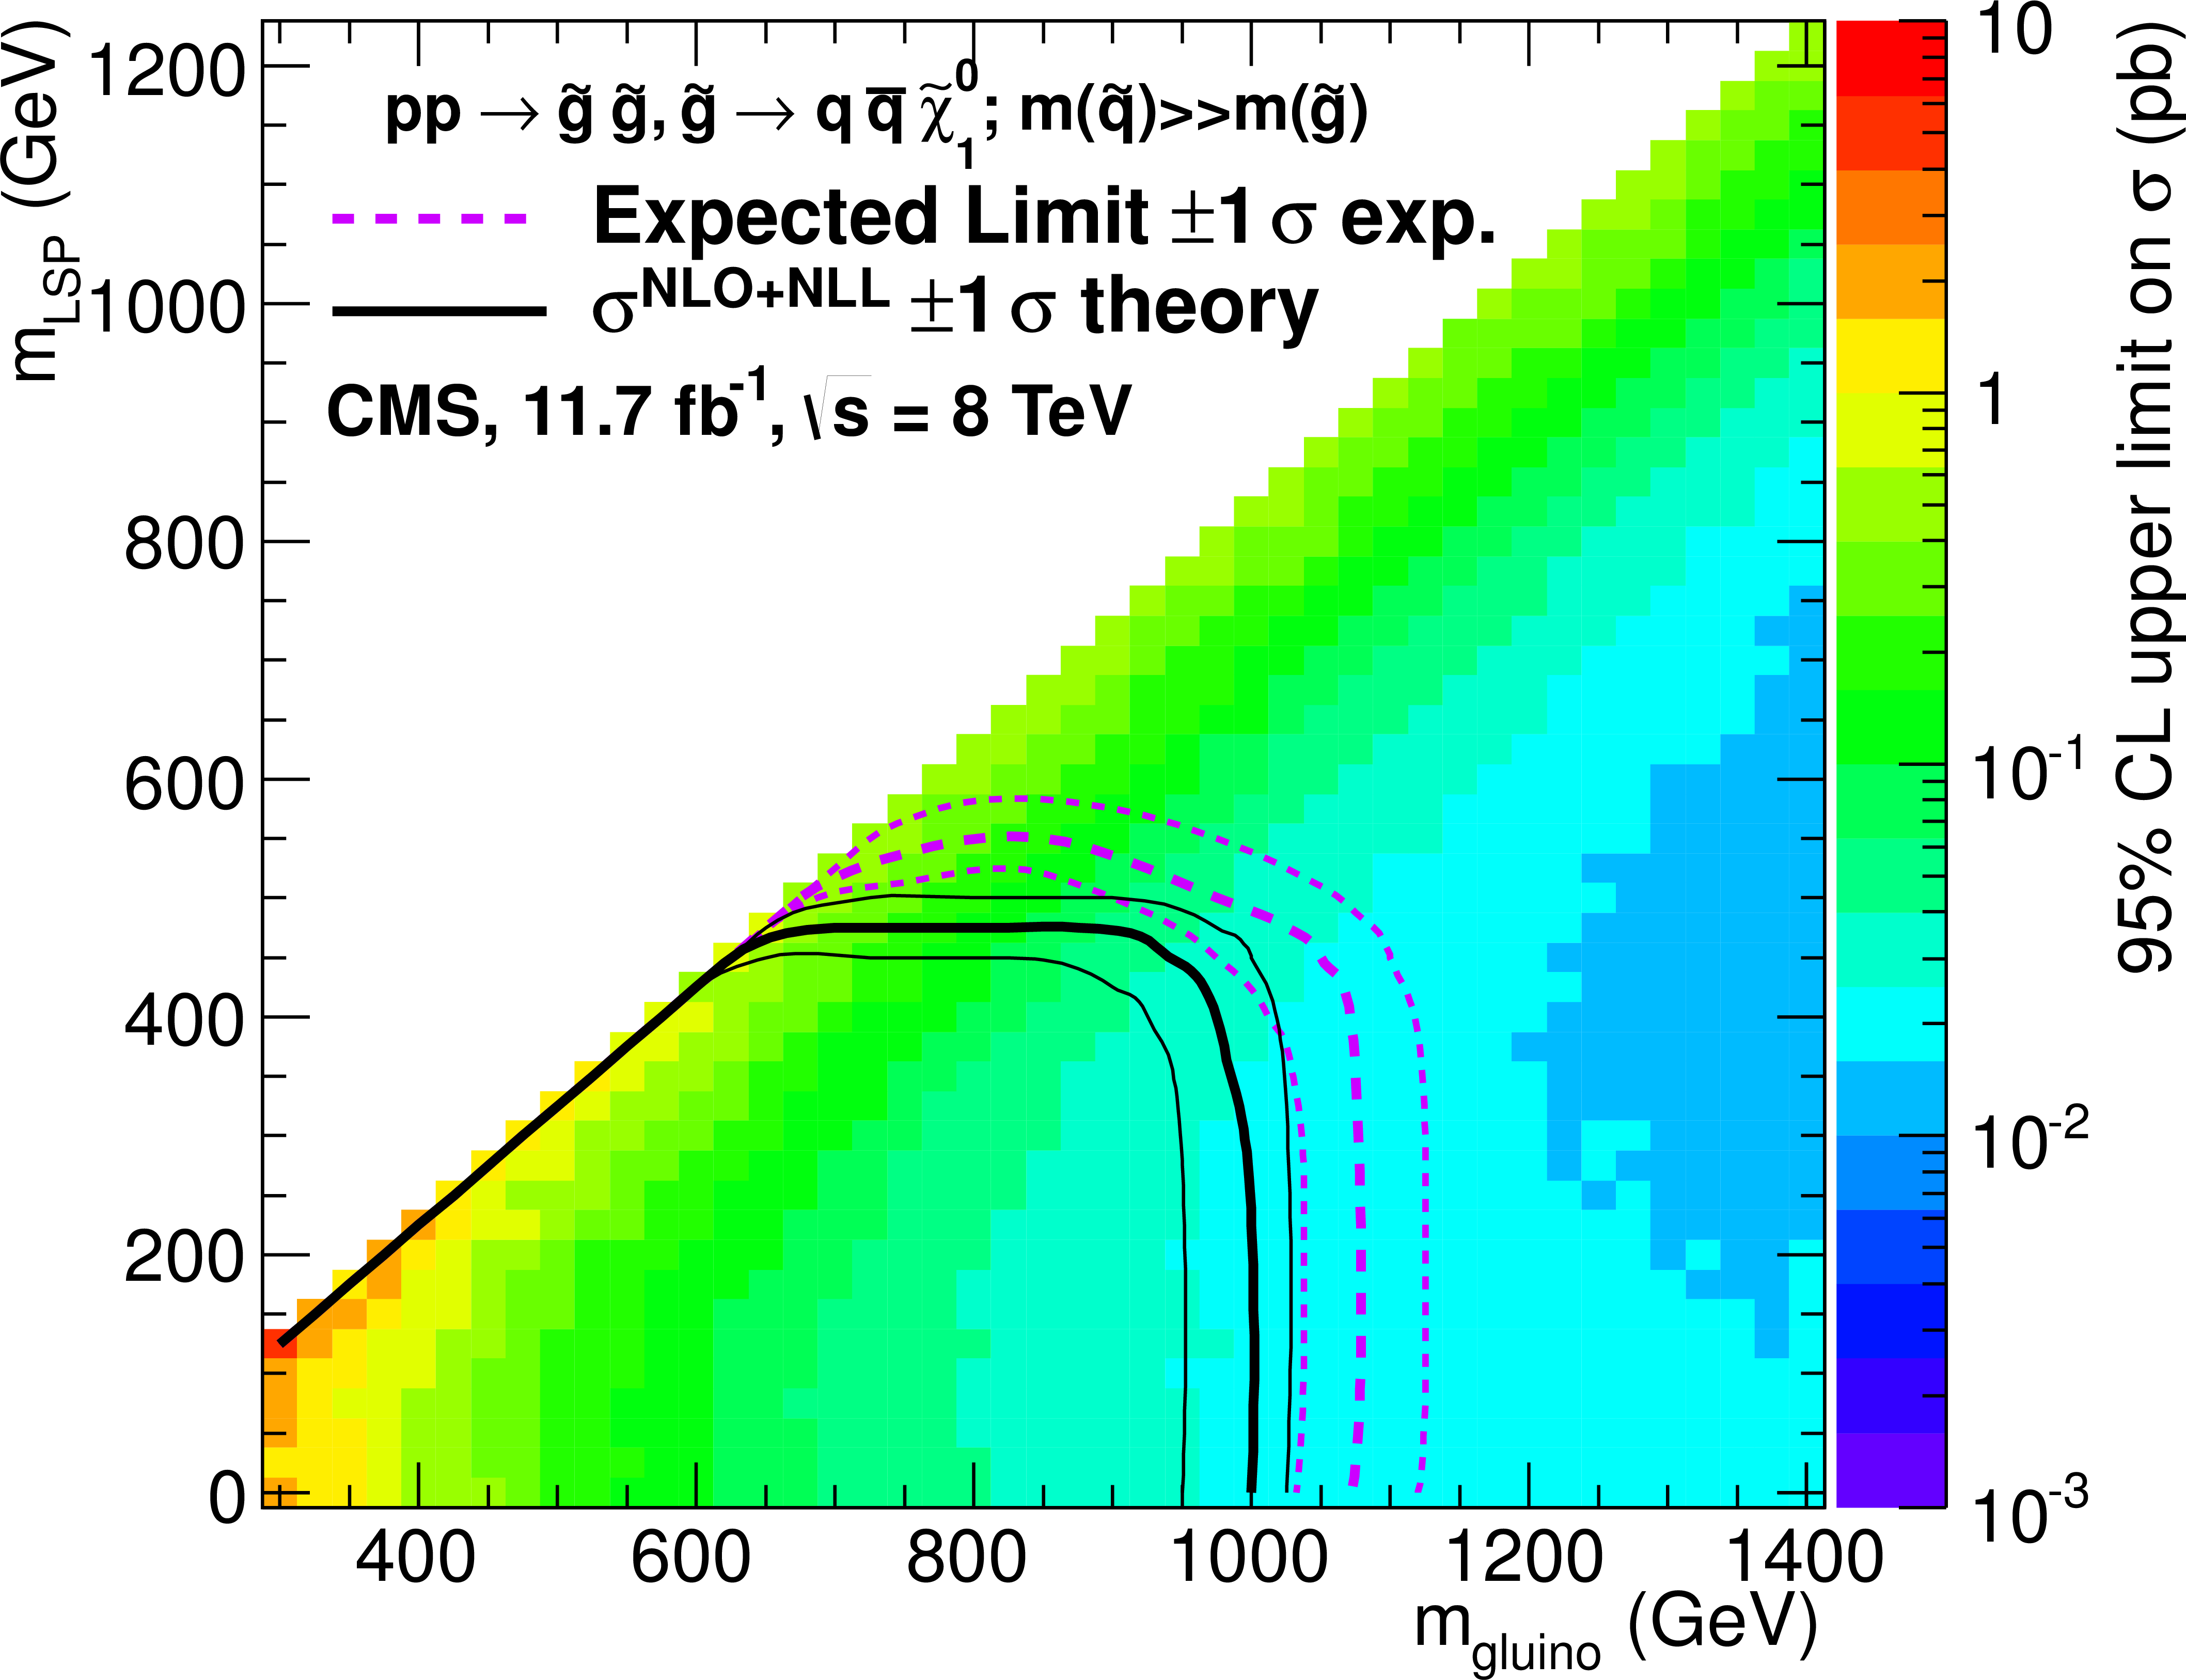
Figure 8-c:
Observed upper limit on the production cross section at 95% CL (indicated by the colour scale) as a function of the parent and LSP sparticle masses for simplified models involving: the direct pair production of eight first- and second-generation squarks with degenerate masses or only a single light squark ($\texttt {D1} $, a); the direct pair production of bottom squarks ($\texttt {D2} $, b); and pair-produced gluinos followed by the decay of each gluino to the LSP and pairs of first- and second-generation quarks ($\texttt {G1} $, c), bottom quarks ($\texttt {G2} $, d), or top quarks ($\texttt {G3} $, f). The black solid (or dashed) thick line indicates the observed exclusion assuming NLO+NLL SUSY production cross section. The black solid (or dashed) thin lines represent the observed exclusions when varying the cross section by its theoretical uncertainty. The purple dashed thick (thin) line indicates the median (${\pm }1 \sigma $) expected exclusion. No interpretation is provided for the kinematic region defined by 0 $< {m_{\text {parent}}} - {m_{\mathrm {LSP}}} < $175 GeV or $ {m_{\text {parent}}} <$ 300 GeV, as discussed in the text. |
png pdf |
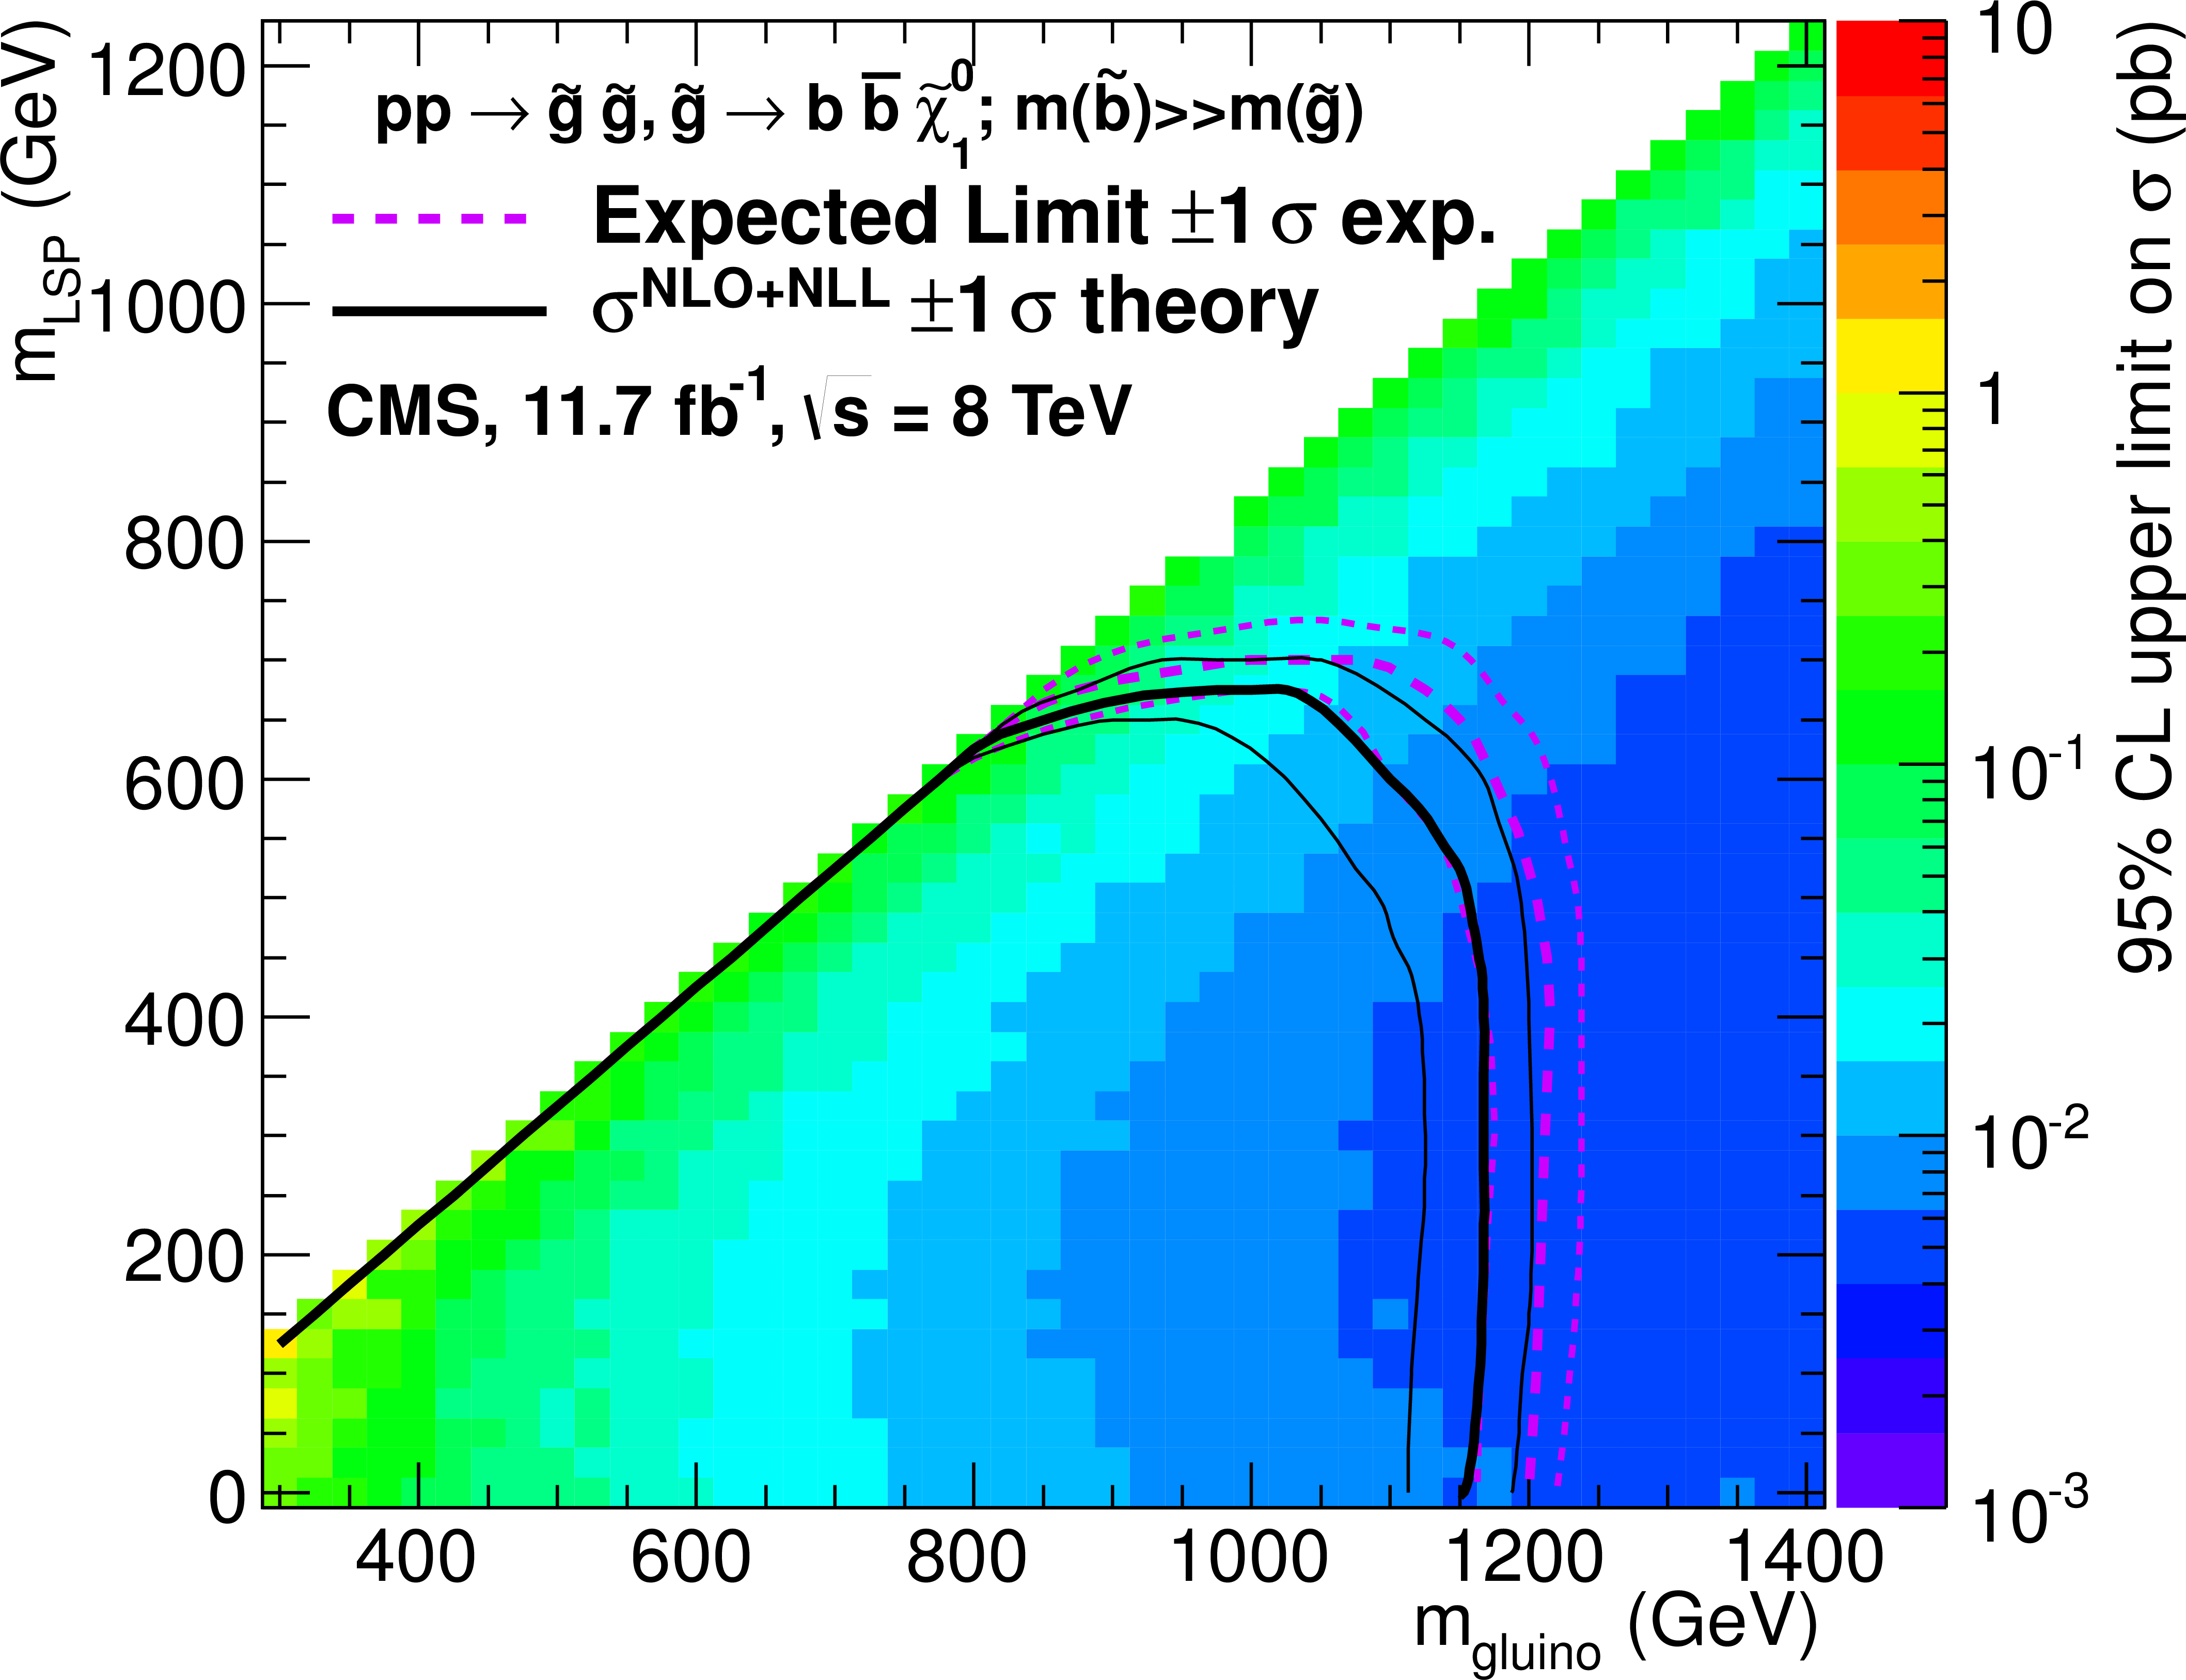
Figure 8-d:
Observed upper limit on the production cross section at 95% CL (indicated by the colour scale) as a function of the parent and LSP sparticle masses for simplified models involving: the direct pair production of eight first- and second-generation squarks with degenerate masses or only a single light squark ($\texttt {D1} $, a); the direct pair production of bottom squarks ($\texttt {D2} $, b); and pair-produced gluinos followed by the decay of each gluino to the LSP and pairs of first- and second-generation quarks ($\texttt {G1} $, c), bottom quarks ($\texttt {G2} $, d), or top quarks ($\texttt {G3} $, f). The black solid (or dashed) thick line indicates the observed exclusion assuming NLO+NLL SUSY production cross section. The black solid (or dashed) thin lines represent the observed exclusions when varying the cross section by its theoretical uncertainty. The purple dashed thick (thin) line indicates the median (${\pm }1 \sigma $) expected exclusion. No interpretation is provided for the kinematic region defined by 0 $< {m_{\text {parent}}} - {m_{\mathrm {LSP}}} < $175 GeV or $ {m_{\text {parent}}} <$ 300 GeV, as discussed in the text. |

png pdf |
Figure 8-e:
Observed upper limit on the production cross section at 95% CL (indicated by the colour scale) as a function of the parent and LSP sparticle masses for simplified models involving: the direct pair production of eight first- and second-generation squarks with degenerate masses or only a single light squark ($\texttt {D1} $, a); the direct pair production of bottom squarks ($\texttt {D2} $, b); and pair-produced gluinos followed by the decay of each gluino to the LSP and pairs of first- and second-generation quarks ($\texttt {G1} $, c), bottom quarks ($\texttt {G2} $, d), or top quarks ($\texttt {G3} $, f). The black solid (or dashed) thick line indicates the observed exclusion assuming NLO+NLL SUSY production cross section. The black solid (or dashed) thin lines represent the observed exclusions when varying the cross section by its theoretical uncertainty. The purple dashed thick (thin) line indicates the median (${\pm }1 \sigma $) expected exclusion. No interpretation is provided for the kinematic region defined by 0 $< {m_{\text {parent}}} - {m_{\mathrm {LSP}}} < $175 GeV or $ {m_{\text {parent}}} <$ 300 GeV, as discussed in the text. |

png pdf |
Figure 9-a:
Excluded cross sections versus top-squark mass $m_{ {\tilde{t}} }$ for the model $\texttt {D3} $, in which pair-produced top squarks each decay to a top quark and the LSP with a mass $m_\mathrm {LSP} =$ 0 (a), 50 (b), 100 (c), and 150 GeV (d). The observed upper limit (95% CL) on the production cross section is shown as a function of $m_{ {\tilde{t}} }$ (solid line), along with the expected upper limit and $\pm 1\sigma $ experimental uncertainties (long-dashed line with shaded band), and the NLO+NLL top-squark pair production cross section and theoretical uncertainties (dotted line with shaded band). |
png pdf |
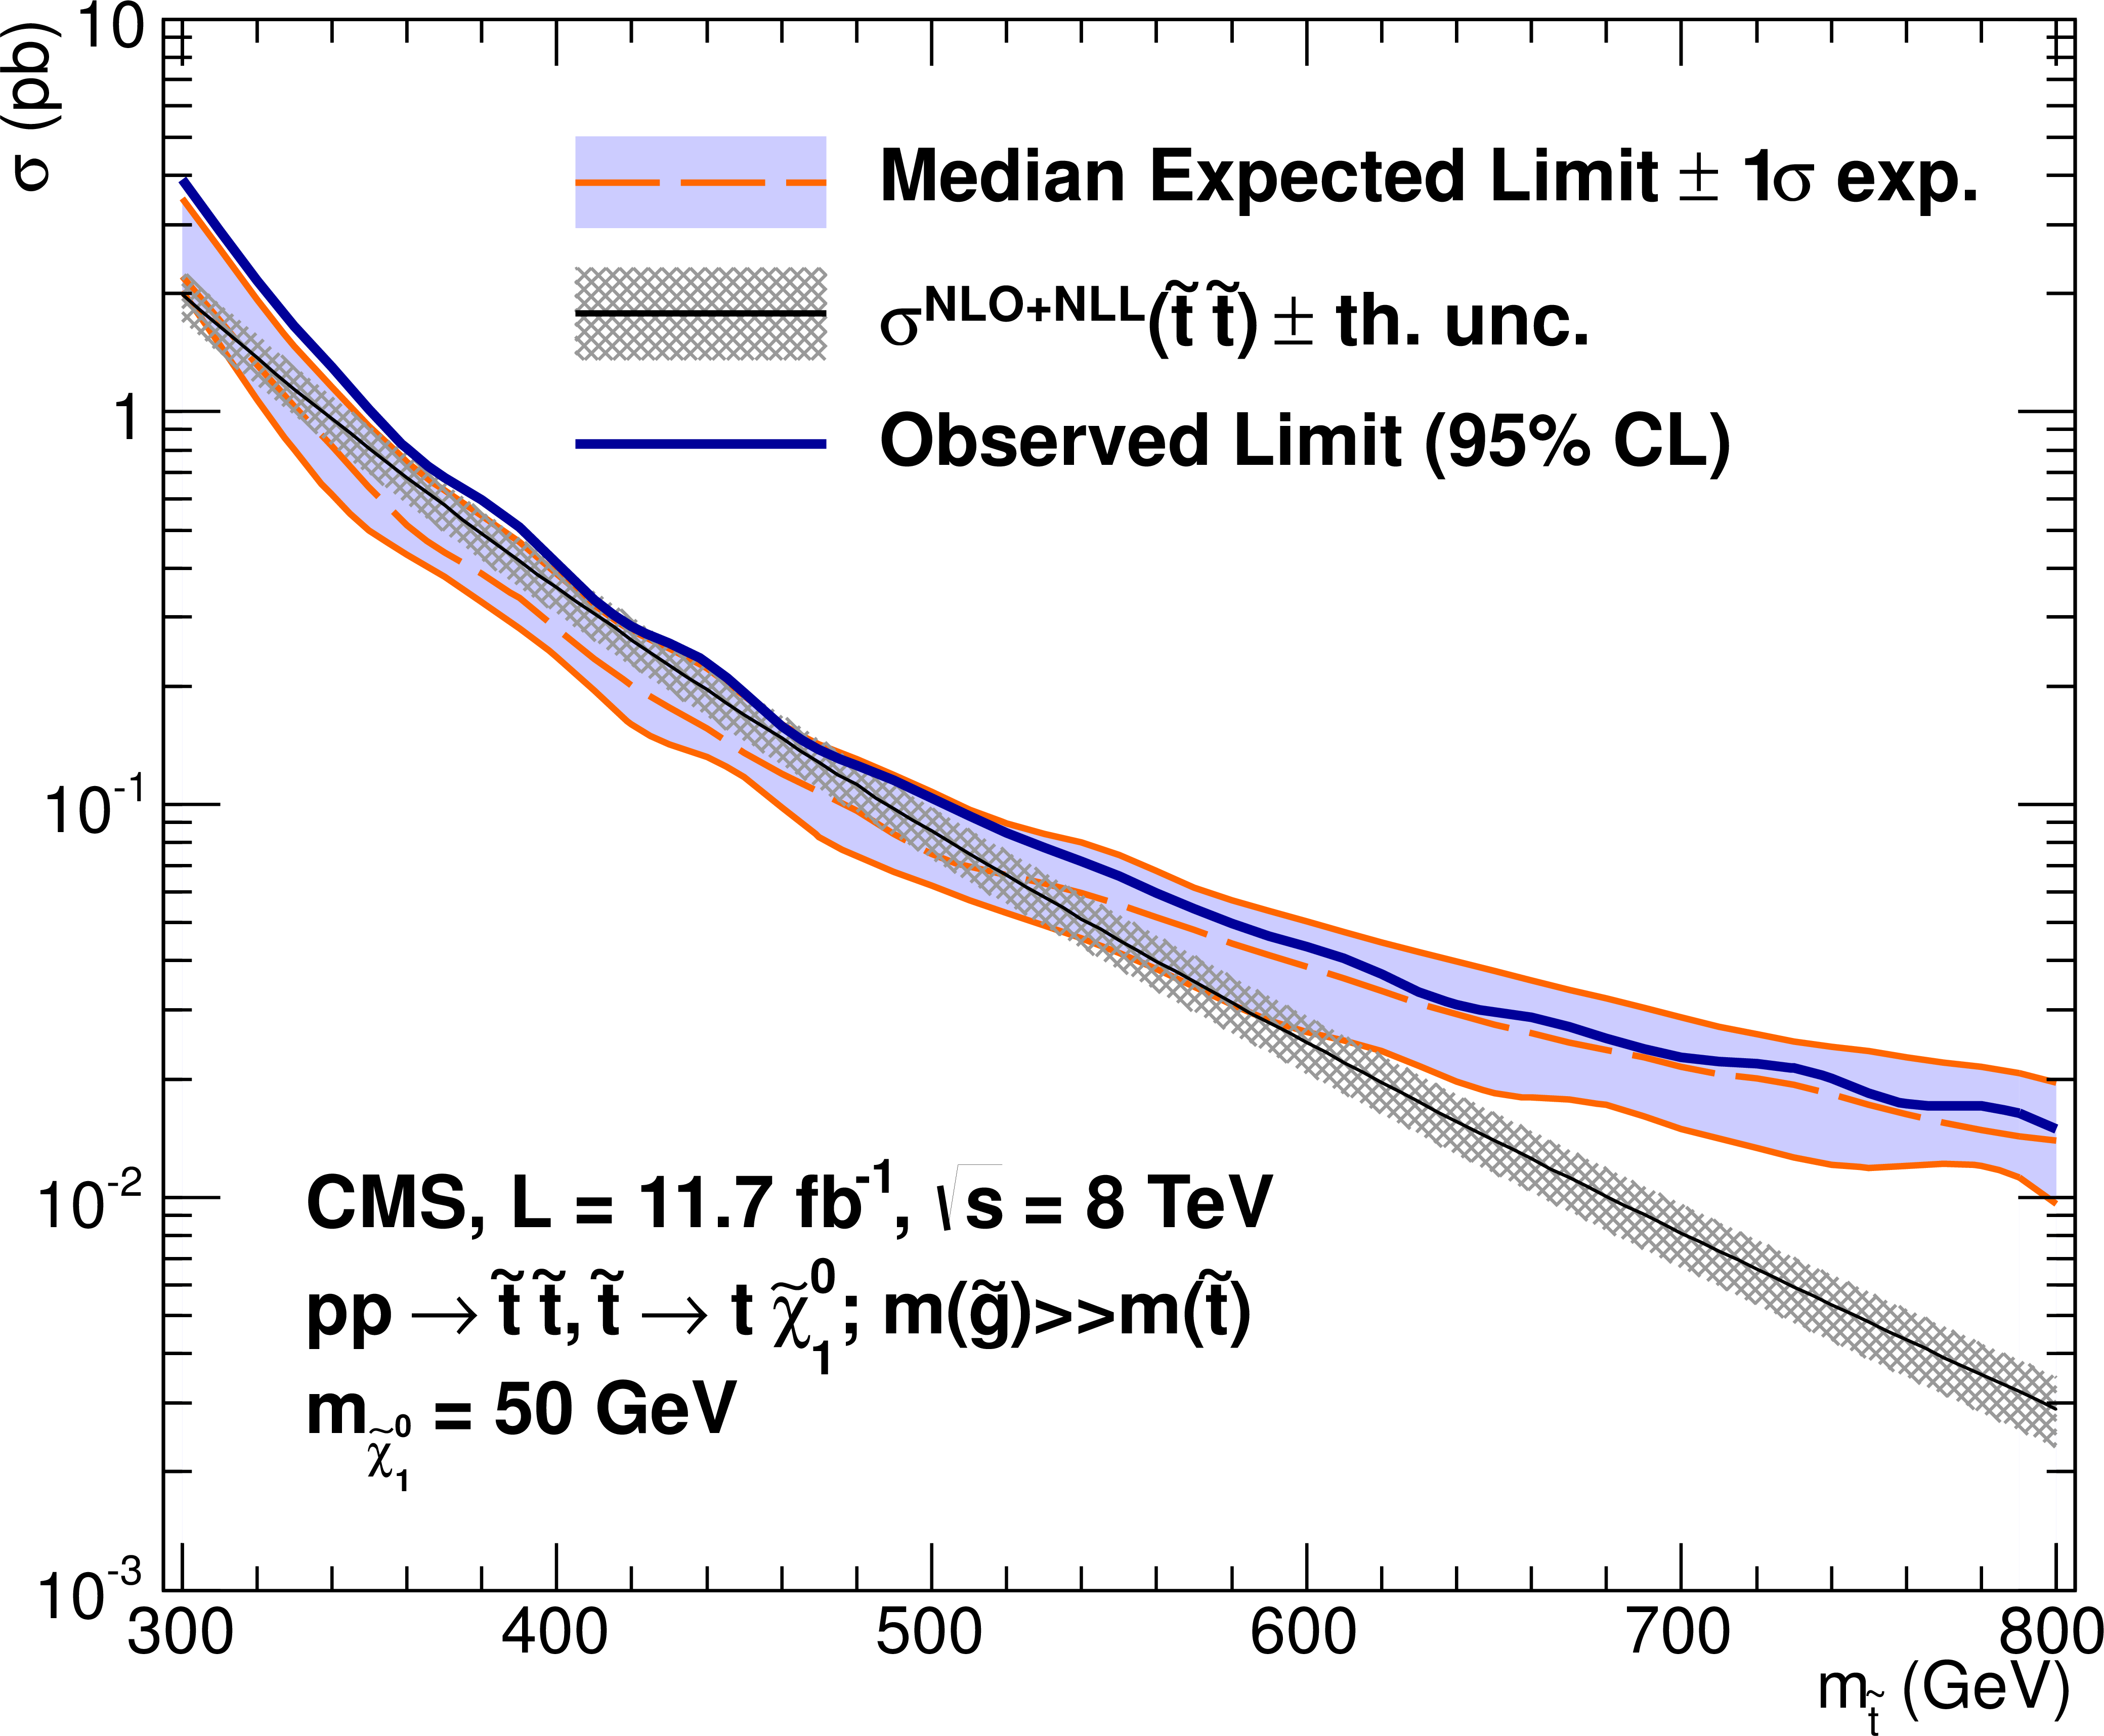
Figure 9-b:
Excluded cross sections versus top-squark mass $m_{ {\tilde{t}} }$ for the model $\texttt {D3} $, in which pair-produced top squarks each decay to a top quark and the LSP with a mass $m_\mathrm {LSP} =$ 0 (a), 50 (b), 100 (c), and 150 GeV (d). The observed upper limit (95% CL) on the production cross section is shown as a function of $m_{ {\tilde{t}} }$ (solid line), along with the expected upper limit and $\pm 1\sigma $ experimental uncertainties (long-dashed line with shaded band), and the NLO+NLL top-squark pair production cross section and theoretical uncertainties (dotted line with shaded band). |
png pdf |
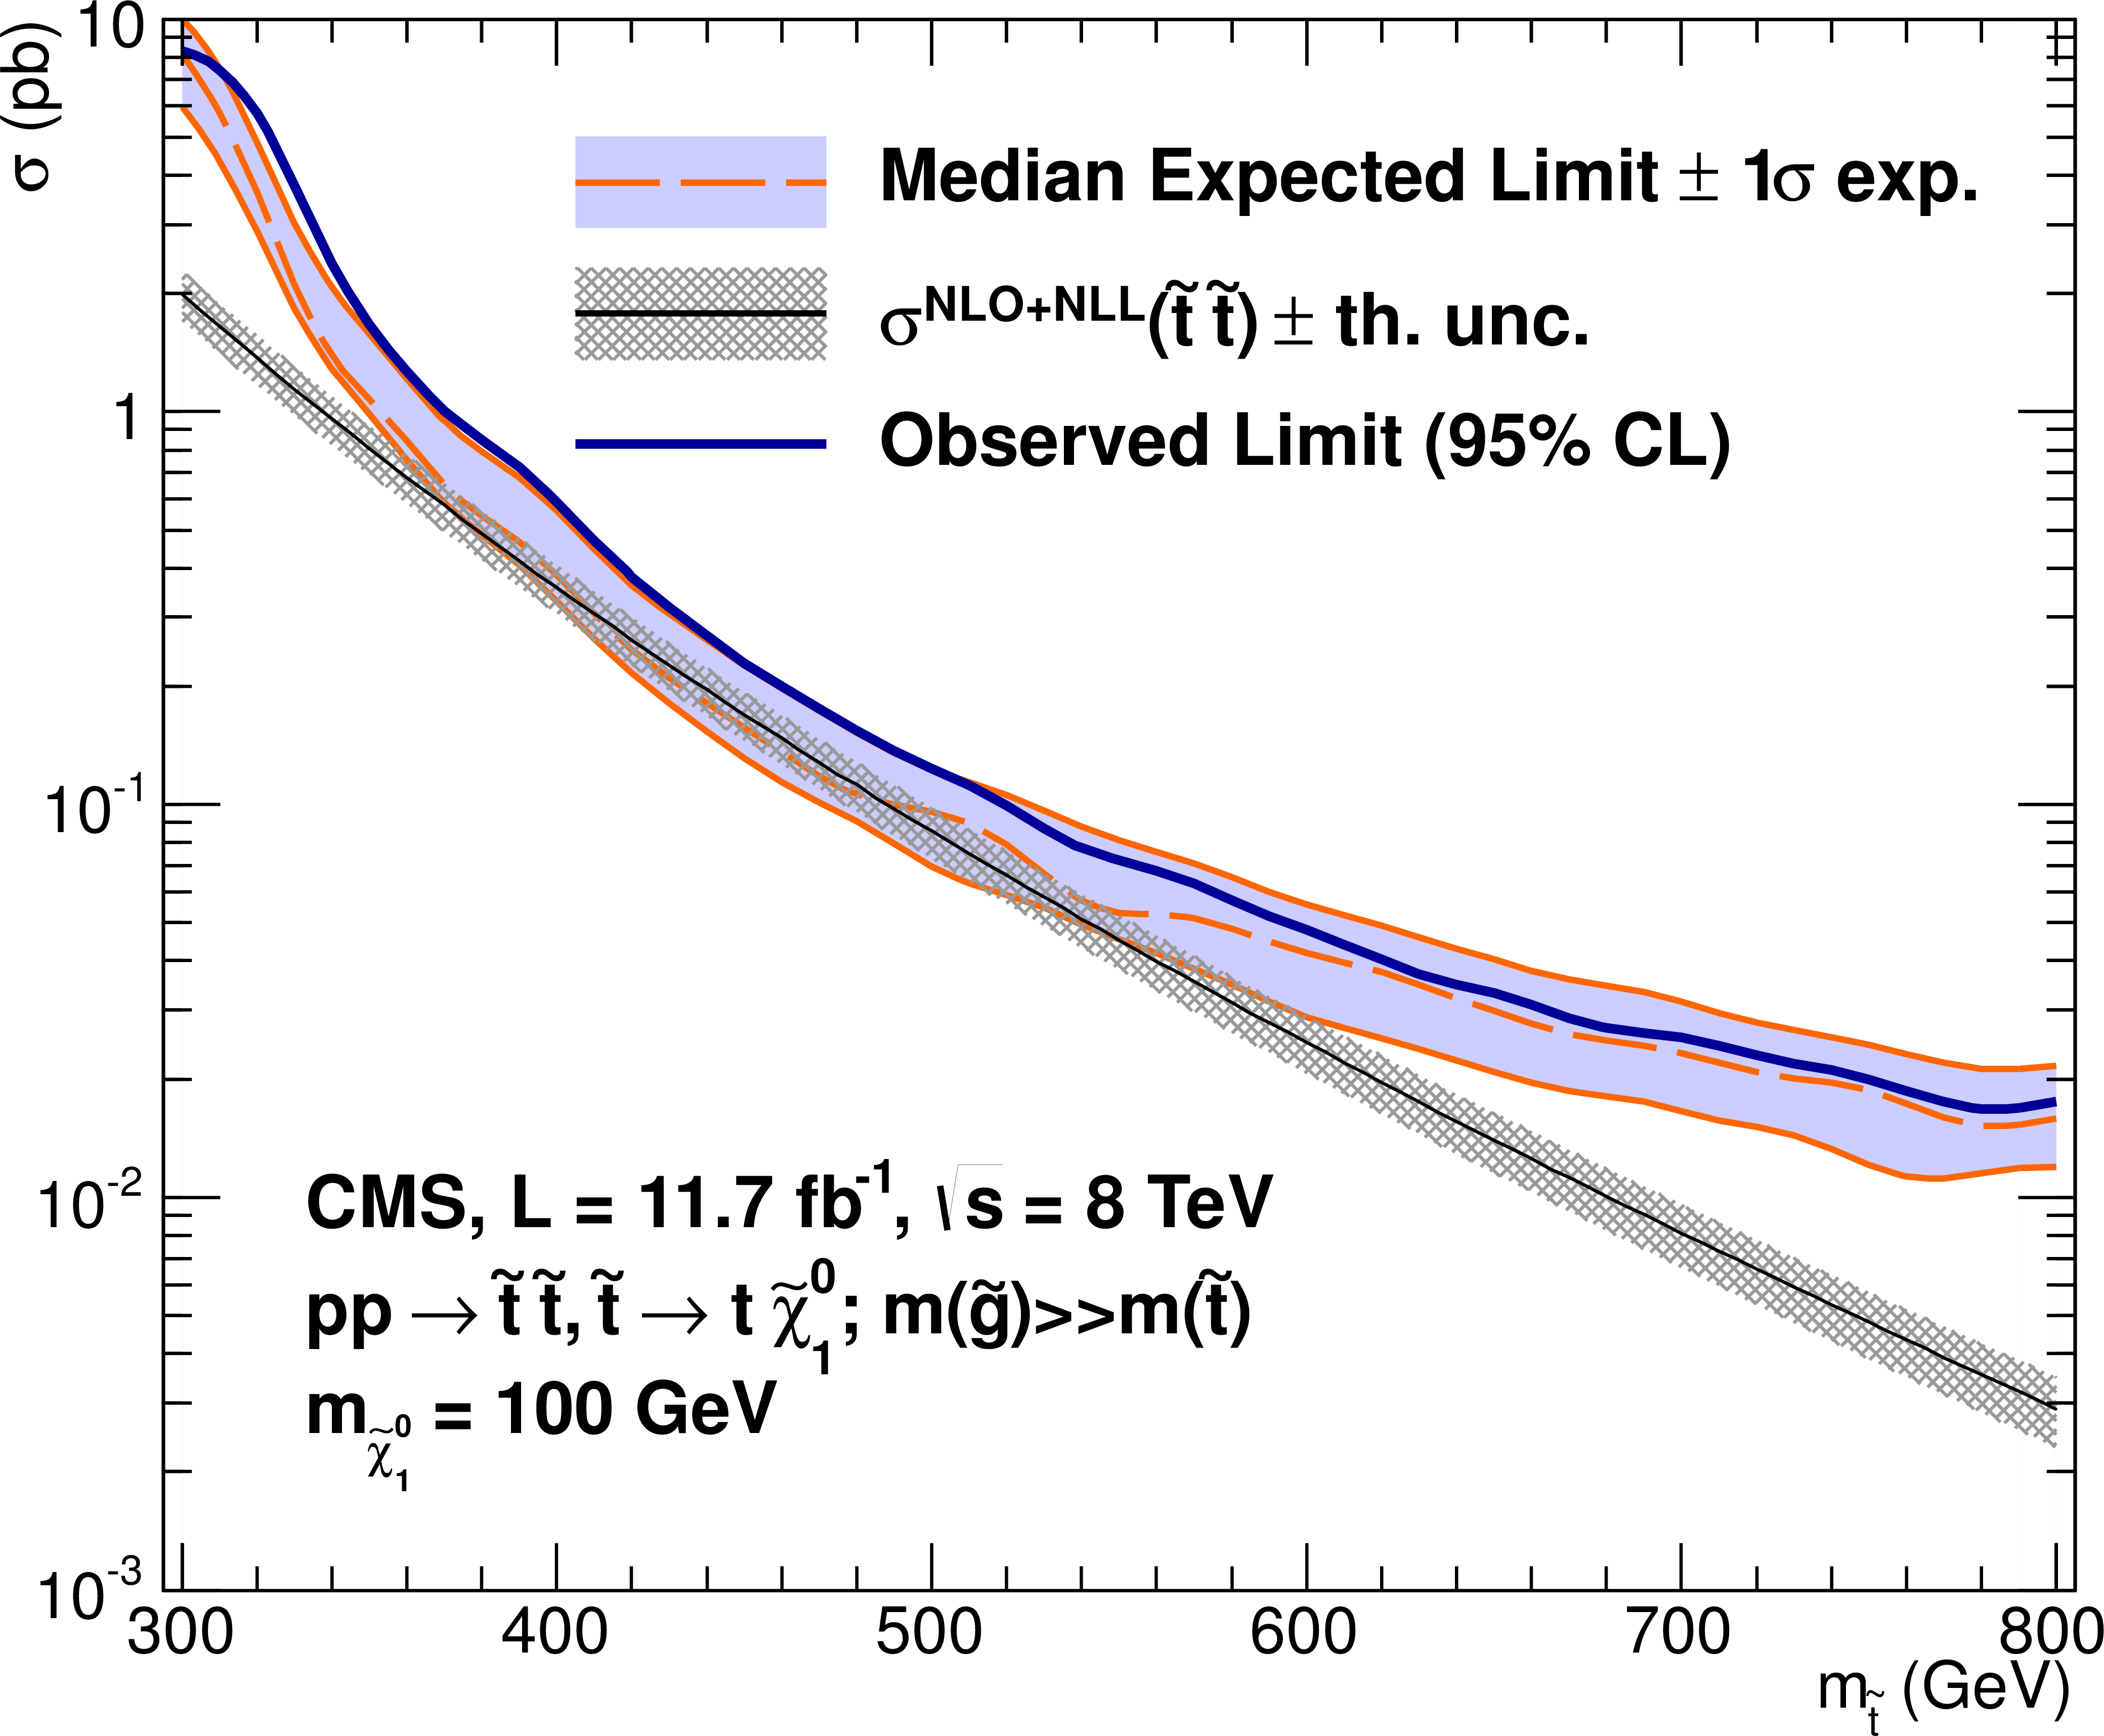
Figure 9-c:
Excluded cross sections versus top-squark mass $m_{ {\tilde{t}} }$ for the model $\texttt {D3} $, in which pair-produced top squarks each decay to a top quark and the LSP with a mass $m_\mathrm {LSP} =$ 0 (a), 50 (b), 100 (c), and 150 GeV (d). The observed upper limit (95% CL) on the production cross section is shown as a function of $m_{ {\tilde{t}} }$ (solid line), along with the expected upper limit and $\pm 1\sigma $ experimental uncertainties (long-dashed line with shaded band), and the NLO+NLL top-squark pair production cross section and theoretical uncertainties (dotted line with shaded band). |
png pdf |
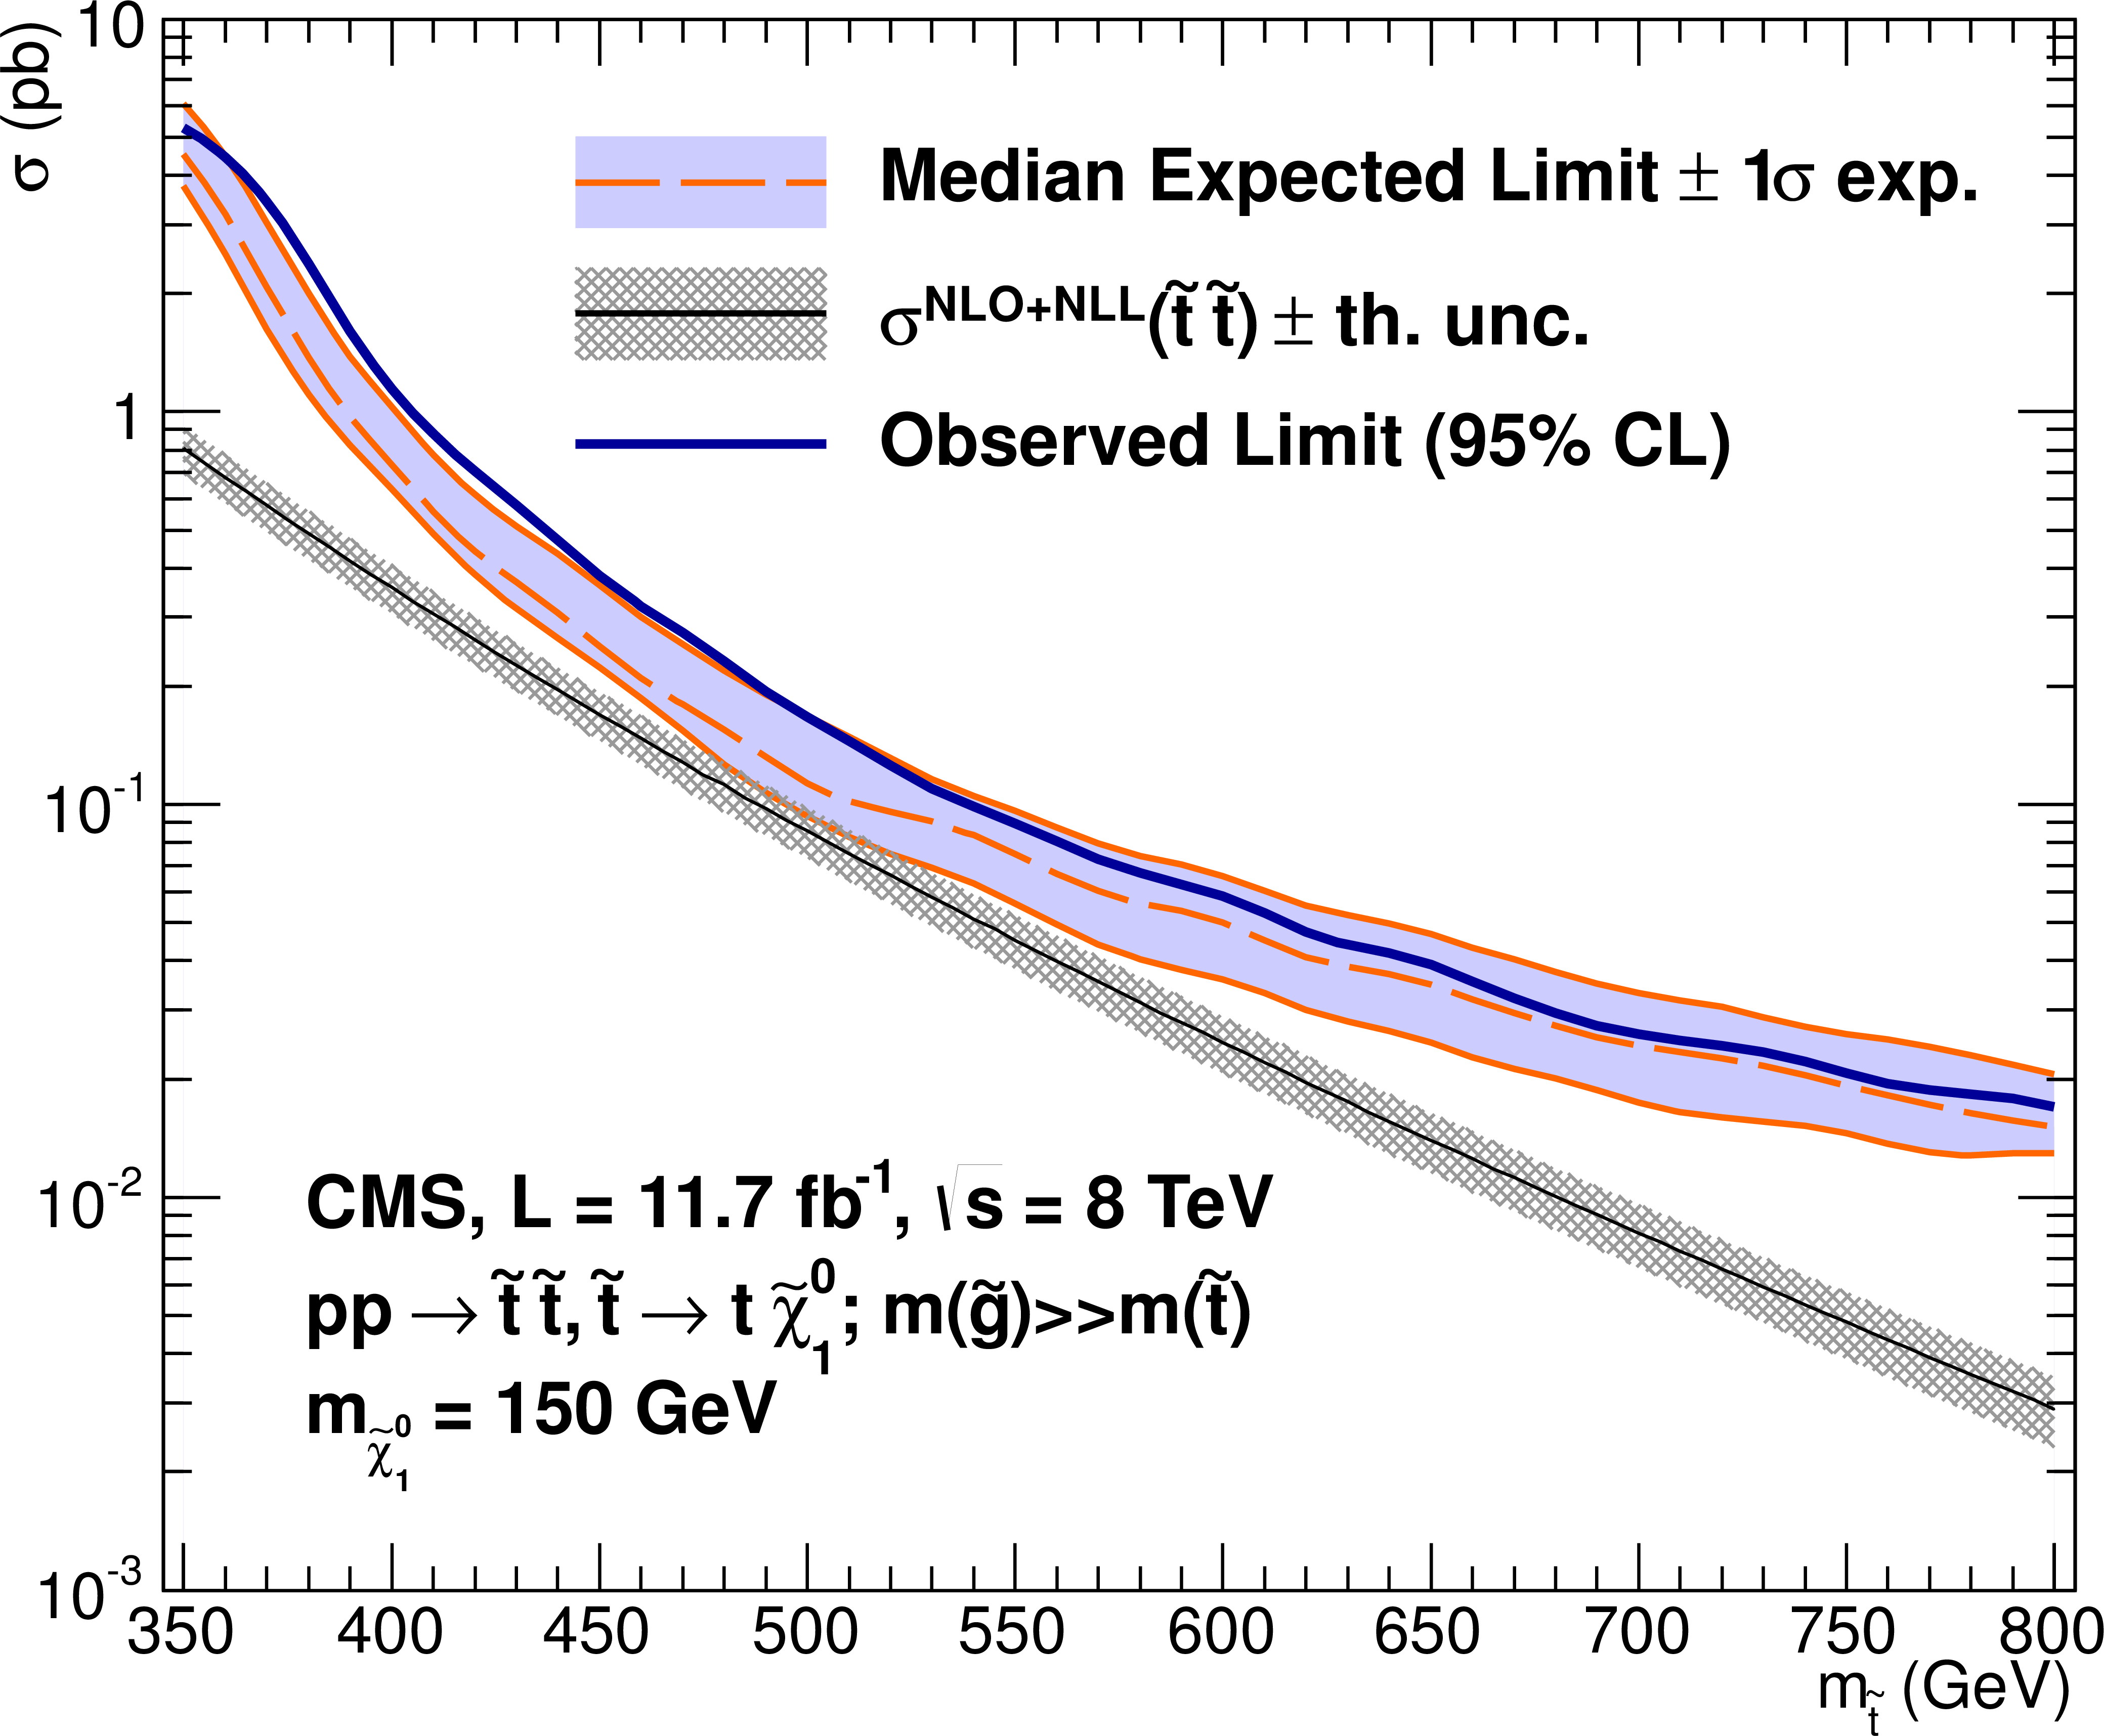
Figure 9-d:
Excluded cross sections versus top-squark mass $m_{ {\tilde{t}} }$ for the model $\texttt {D3} $, in which pair-produced top squarks each decay to a top quark and the LSP with a mass $m_\mathrm {LSP} =$ 0 (a), 50 (b), 100 (c), and 150 GeV (d). The observed upper limit (95% CL) on the production cross section is shown as a function of $m_{ {\tilde{t}} }$ (solid line), along with the expected upper limit and $\pm 1\sigma $ experimental uncertainties (long-dashed line with shaded band), and the NLO+NLL top-squark pair production cross section and theoretical uncertainties (dotted line with shaded band). |
|
|
Compact Muon Solenoid LHC, CERN |
|

|

|

|

|

|