

Compact Muon Solenoid
LHC, CERN
| CMS-SUS-14-004 ; CERN-PH-EP-2015-129 | ||
| Search for supersymmetry with photons in pp collisions at $\sqrt{s} =$ 8 TeV | ||
| CMS Collaboration | ||
| 10 July 2015 | ||
| Phys. Rev. D 92 (2015) 072006 | ||
| Abstract: Two searches for physics beyond the standard model in events containing photons are presented. The data sample used corresponds to an integrated luminosity of 19.7 fb$^{-1}$ of proton-proton collisions at $\sqrt{s}=$ 8 TeV, collected with the CMS experiment at the CERN LHC. The analyses pursue different inclusive search strategies. One analysis requires at least one photon, at least two jets, and a large amount of transverse momentum imbalance, while the other selects events with at least two photons and at least one jet, and uses the razor variables to search for signal events. The background expected from standard model processes is evaluated mainly from data. The results are interpreted in the context of general gauge-mediated supersymmetry, with the next-to-lightest supersymmetric particle either a bino- or wino-like neutralino, and within simplified model scenarios. Upper limits at 95% confidence level are obtained for cross sections as functions of the masses of the intermediate supersymmetric particles. | ||
| Links: e-print arXiv:1507.02898 [hep-ex] (PDF) ; CDS record ; inSPIRE record ; CADI line (restricted) ; | ||
| Figures | |

png pdf |
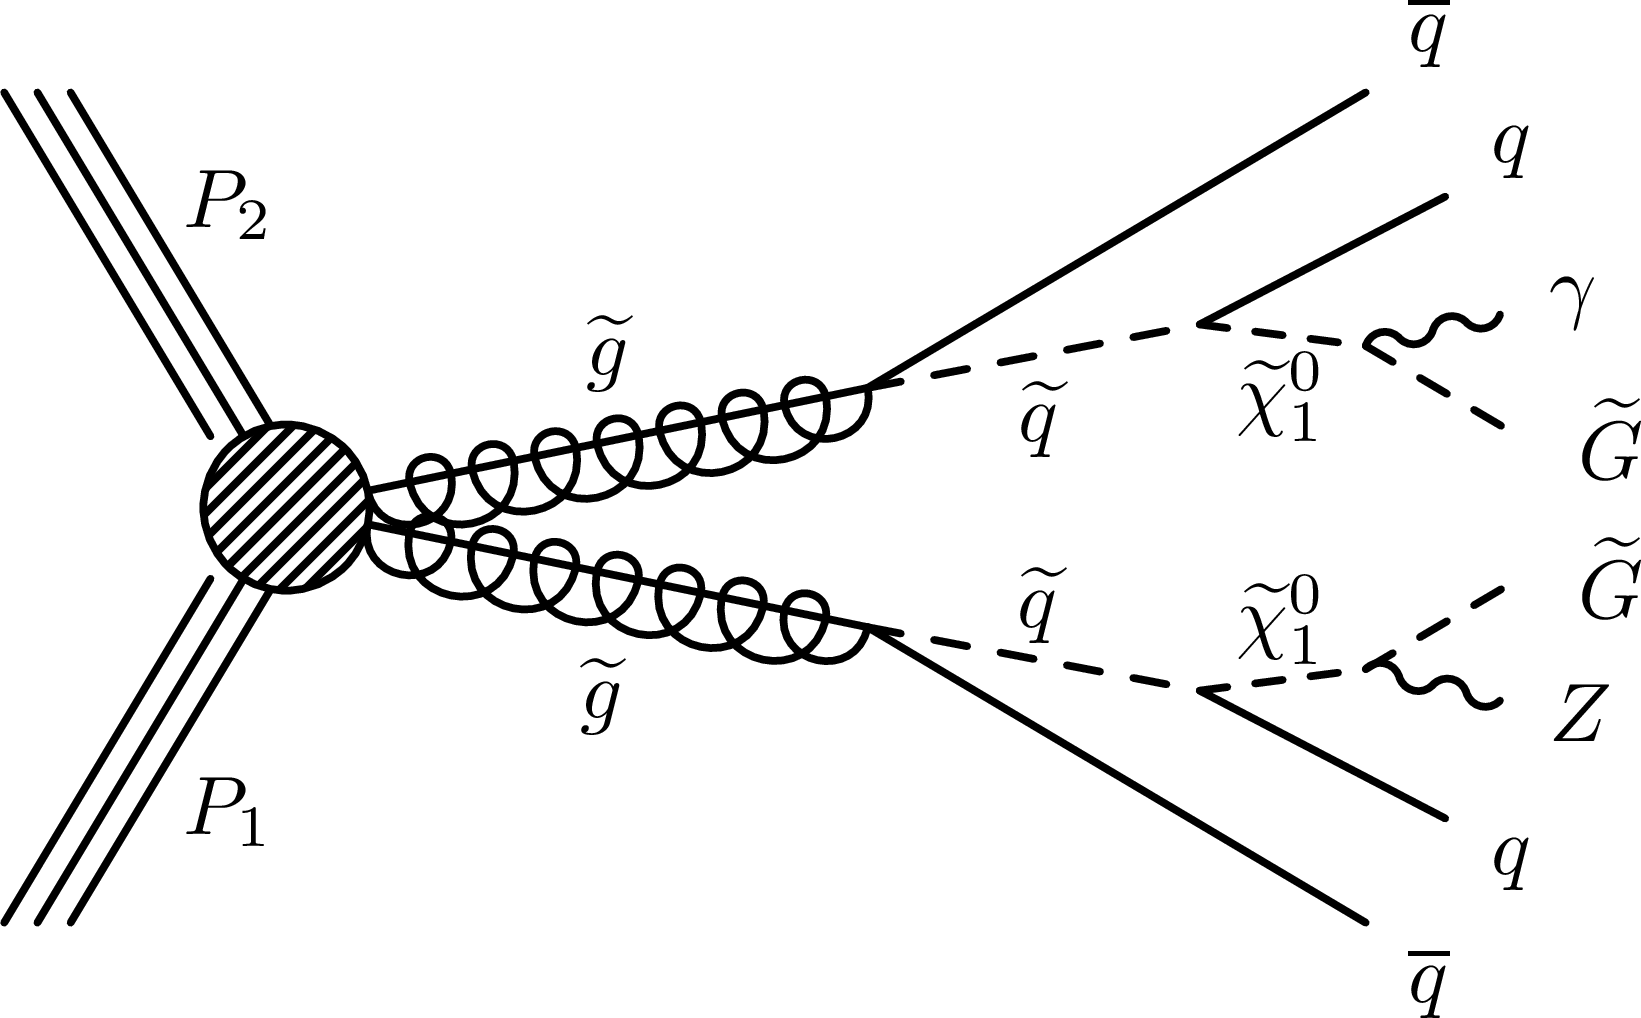
Figure 1-a:
Typical Feynman diagrams for the general gauge-mediation model with bino- (a) and wino-like (b) neutralino mixing scenarios. Here, the $ {\tilde{\chi}^{0}_{1}} $ can decay to $ \tilde{ {\mathrm {G}} } \gamma $ or $ \tilde{ {\mathrm {G}} } {\mathrm {Z}} $, with the branching fraction dependent on the $ {\tilde{\chi}^{0}_{1}} $ mass. The diagrams for the T5gg (c) and T5wg (d) simplified model spectra are also shown. |
png pdf |
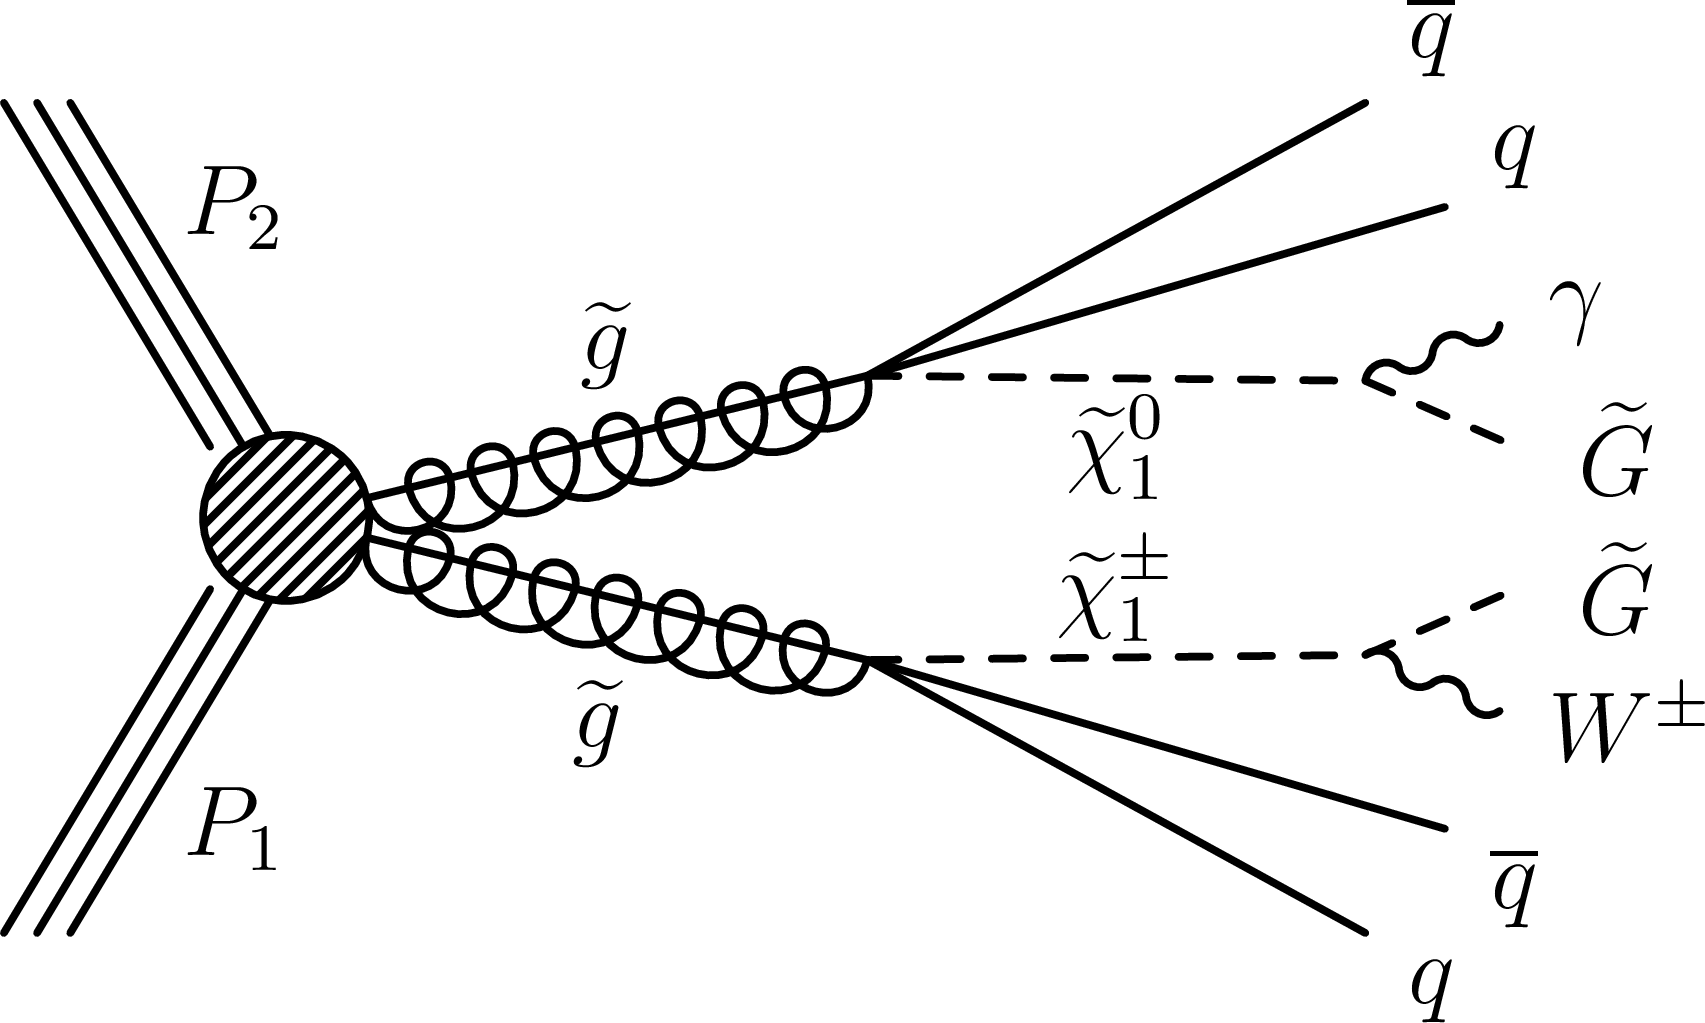
Figure 1-b:
Typical Feynman diagrams for the general gauge-mediation model with bino- (a) and wino-like (b) neutralino mixing scenarios. Here, the $ {\tilde{\chi}^{0}_{1}} $ can decay to $ \tilde{ {\mathrm {G}} } \gamma $ or $ \tilde{ {\mathrm {G}} } {\mathrm {Z}} $, with the branching fraction dependent on the $ {\tilde{\chi}^{0}_{1}} $ mass. The diagrams for the T5gg (c) and T5wg (d) simplified model spectra are also shown. |

png pdf |
Figure 1-c:
Typical Feynman diagrams for the general gauge-mediation model with bino- (a) and wino-like (b) neutralino mixing scenarios. Here, the $ {\tilde{\chi}^{0}_{1}} $ can decay to $ \tilde{ {\mathrm {G}} } \gamma $ or $ \tilde{ {\mathrm {G}} } {\mathrm {Z}} $, with the branching fraction dependent on the $ {\tilde{\chi}^{0}_{1}} $ mass. The diagrams for the T5gg (c) and T5wg (d) simplified model spectra are also shown. |
png pdf |
Figure 1-d:
Typical Feynman diagrams for the general gauge-mediation model with bino- (a) and wino-like (b) neutralino mixing scenarios. Here, the $ {\tilde{\chi}^{0}_{1}} $ can decay to $ \tilde{ {\mathrm {G}} } \gamma $ or $ \tilde{ {\mathrm {G}} } {\mathrm {Z}} $, with the branching fraction dependent on the $ {\tilde{\chi}^{0}_{1}} $ mass. The diagrams for the T5gg (c) and T5wg (d) simplified model spectra are also shown. |
png pdf |
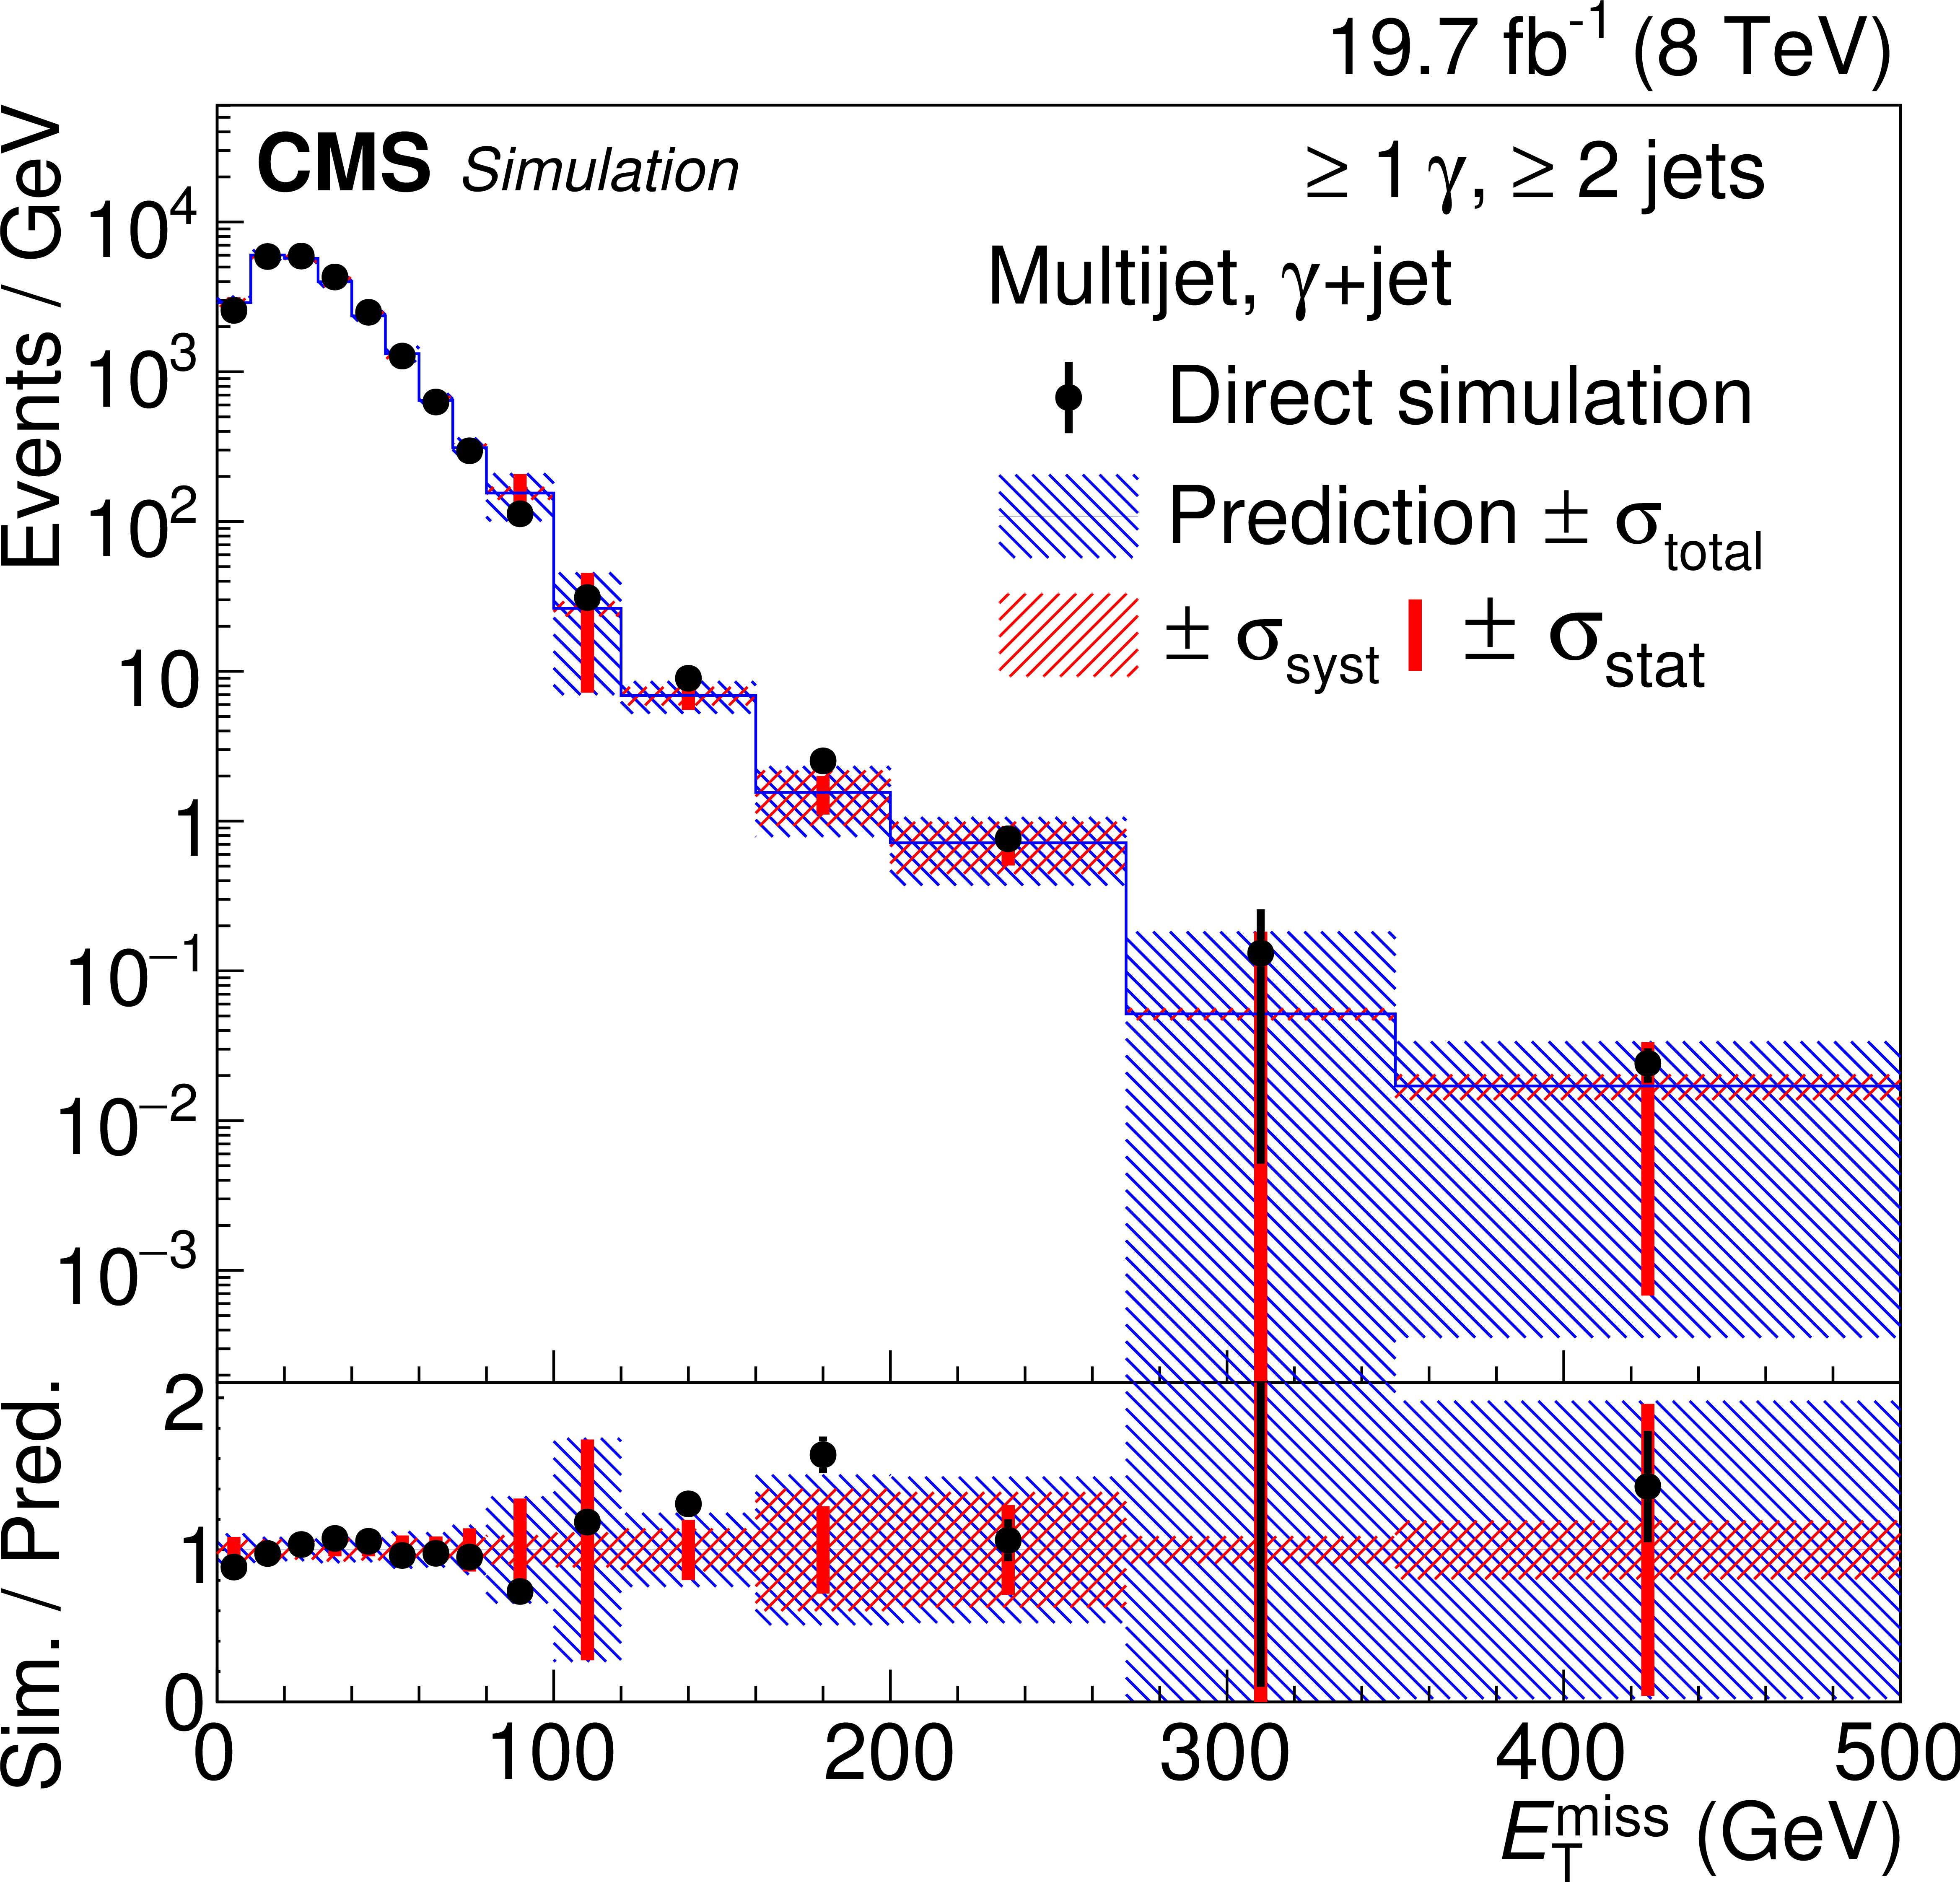
Figure 2-a:
Tests of the background estimation method for the single-photon analysis using simulated events in bins of ${E_{\mathrm {T}}^{\text {miss}}} $. The direct simulation of $ { \gamma _\text {tight} } $ events is compared to the prediction of the multijet background from simulated $ { \gamma _\text {loose} } $ events (a). Simulated events with $ { \gamma _\text {tight} } $ originating from generated electrons are compared to the simulated prediction using the EW background method (b). The blue hatched area represents the total uncertainty and is the quadratic sum of the statistical (red vertical bars) and systematic (red hatched area) uncertainties. In the bottom panels, the ratio of the direct simulation to the prediction is shown. |
png pdf |
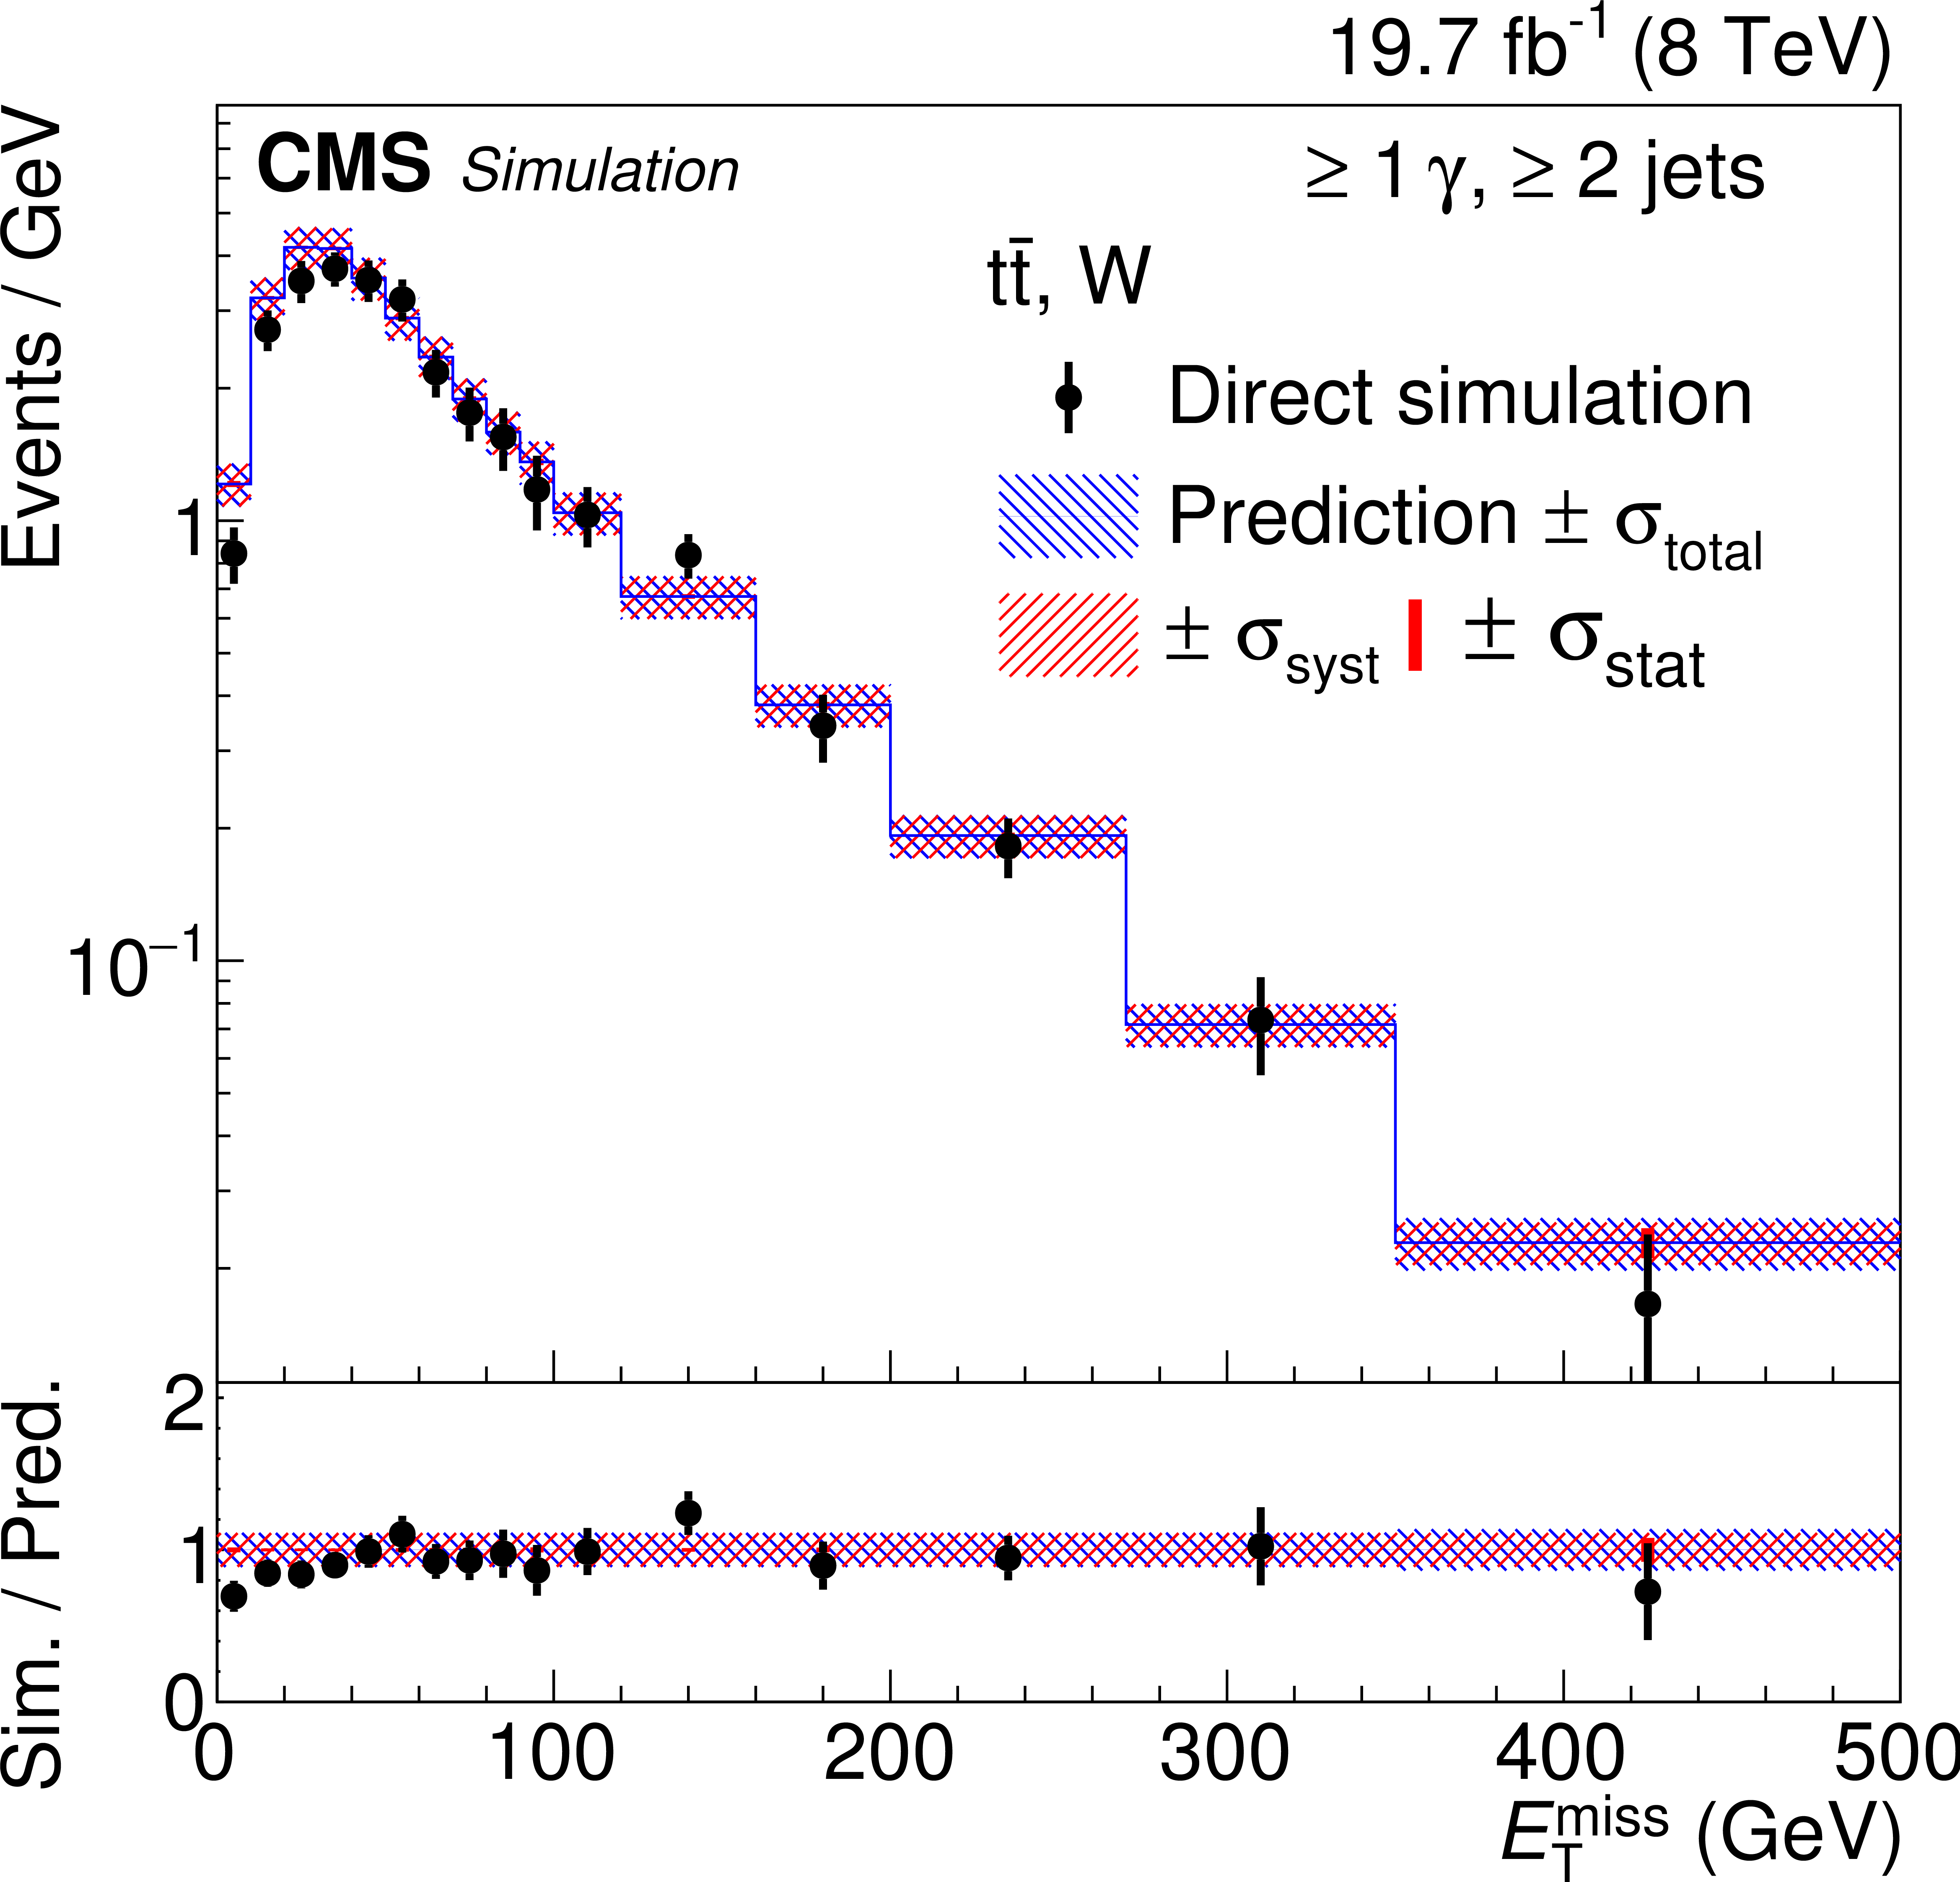
Figure 2-b:
Tests of the background estimation method for the single-photon analysis using simulated events in bins of ${E_{\mathrm {T}}^{\text {miss}}} $. The direct simulation of $ { \gamma _\text {tight} } $ events is compared to the prediction of the multijet background from simulated $ { \gamma _\text {loose} } $ events (a). Simulated events with $ { \gamma _\text {tight} } $ originating from generated electrons are compared to the simulated prediction using the EW background method (b). The blue hatched area represents the total uncertainty and is the quadratic sum of the statistical (red vertical bars) and systematic (red hatched area) uncertainties. In the bottom panels, the ratio of the direct simulation to the prediction is shown. |

png pdf |
Figure 3:
Distribution of $ {E_{\mathrm {T}}^{\text {miss}}} $ from the single-photon search in comparison to the standard model background prediction. The expectation from an example GGMwino signal model point is also shown. In the bottom panels, the ratio of the data to the prediction is shown. The representations of uncertainties are defined as in Fig. 2. |

png pdf |
Figure 4-a:
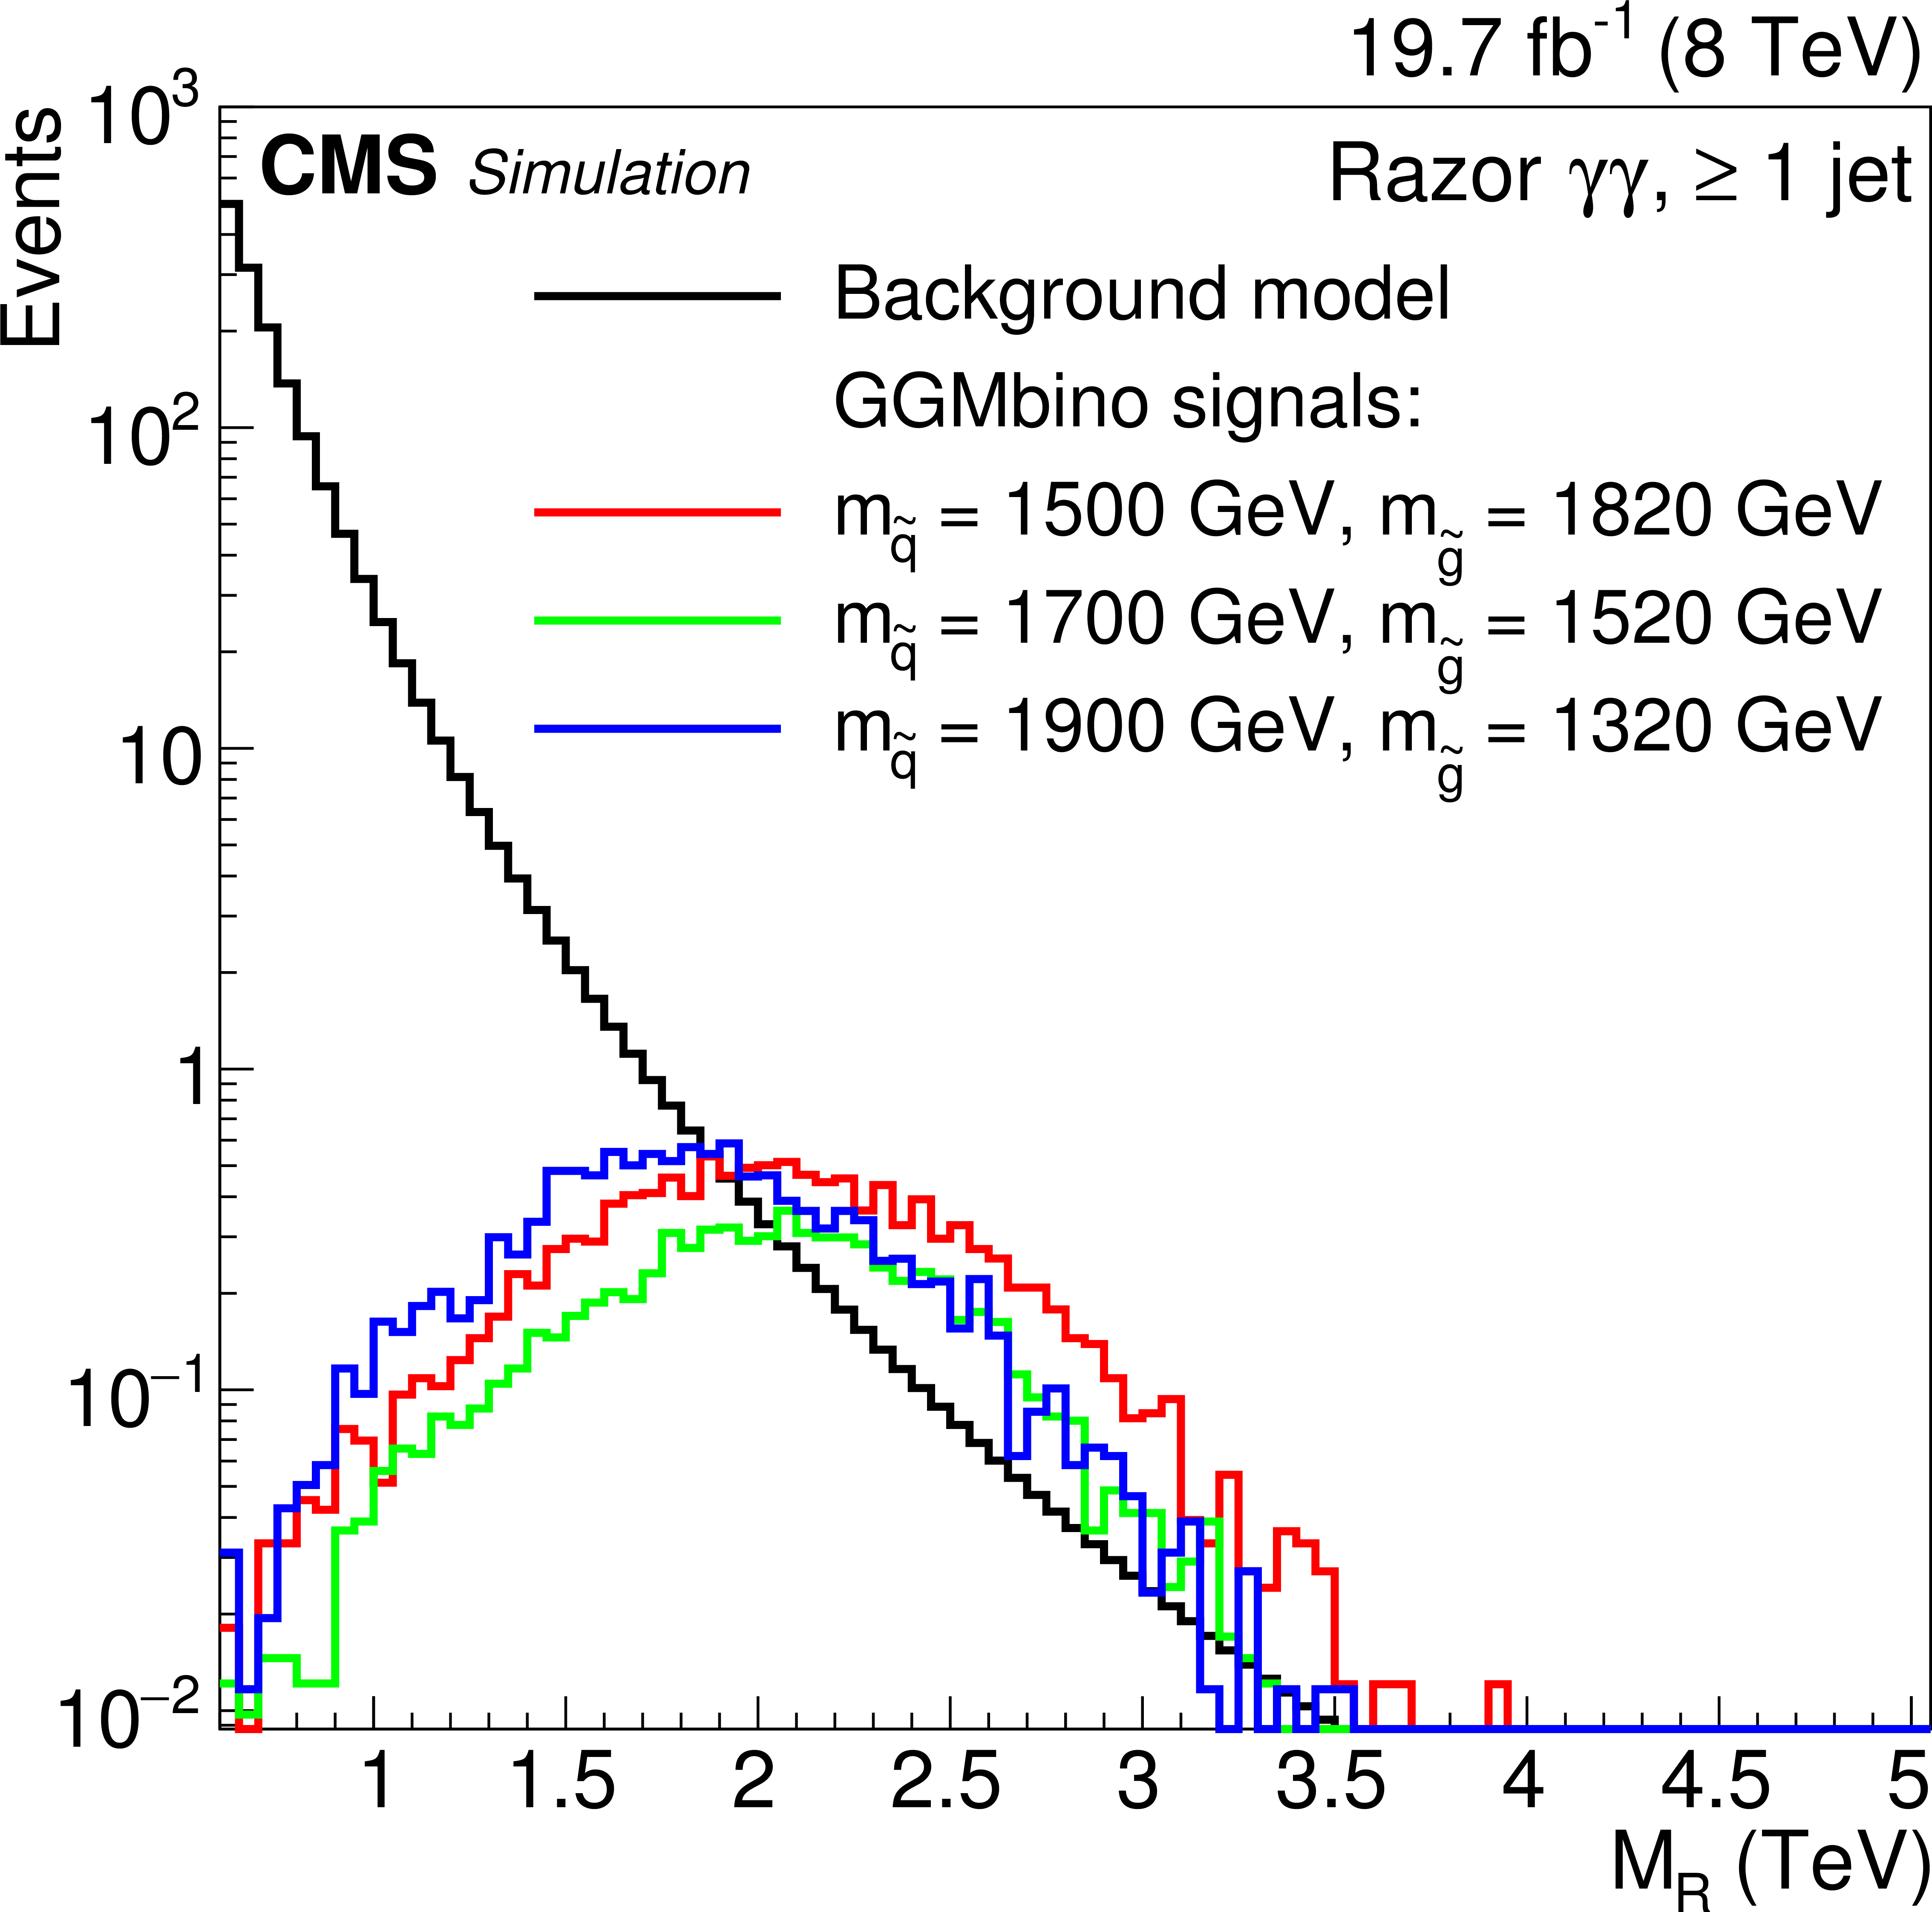
Distribution of $ {M_\mathrm {R}} $ in the double-photon search for the background model, derived from a fit in the data control region, and for the T5gg (a) and GGMbino (b) signal models. The background model is normalized to the number of events in the signal region. The signal models are normalized to the expected signal yields. |
png pdf |
Figure 4-b:
Distribution of $ {M_\mathrm {R}} $ in the double-photon search for the background model, derived from a fit in the data control region, and for the T5gg (a) and GGMbino (b) signal models. The background model is normalized to the number of events in the signal region. The signal models are normalized to the expected signal yields. |
png pdf |
Figure 5-a:
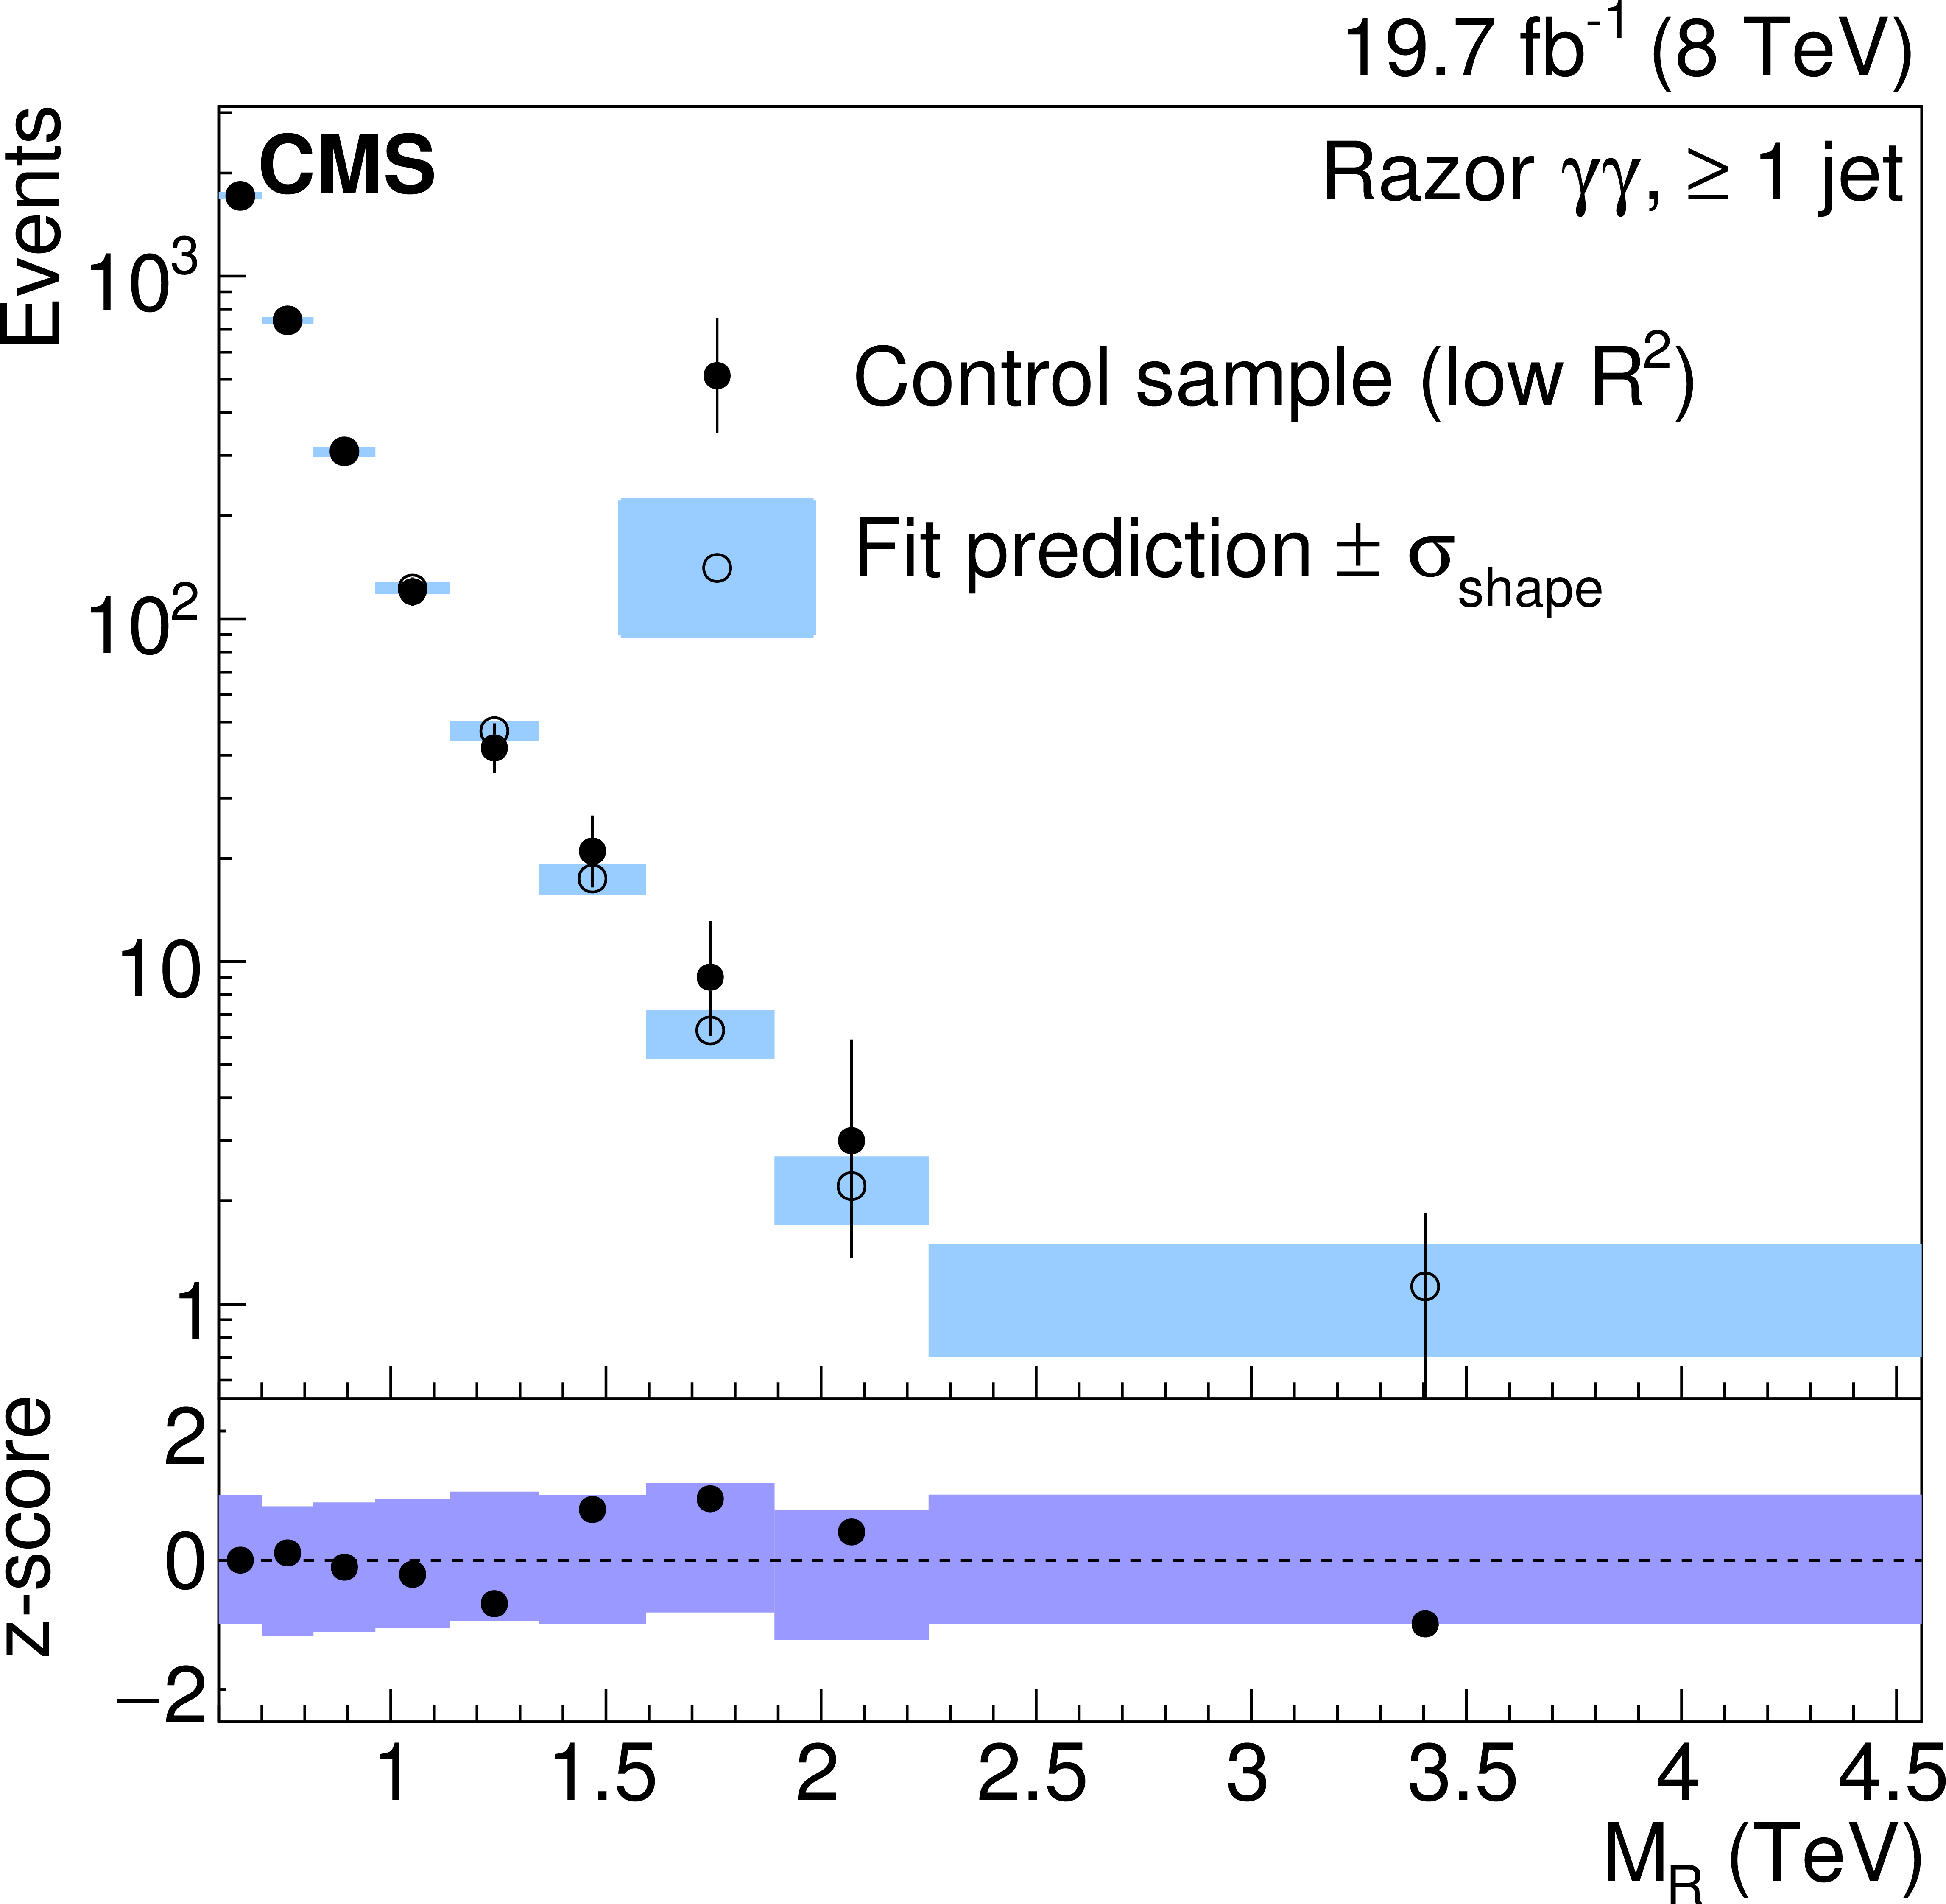
Distribution of $ {M_\mathrm {R}} $ in the double-photon search for a control sample of jets misreconstructed as photons (see text) in the control (a) and signal (b) regions. The data are compared to the 68% range obtained from a fit in the control region and extrapolated to the signal region (blue bands). The open dots represent the center of the 68% range. The rightmost bin in each plot contains zero data entries. The bottom panel of each figure gives the z-scores (number of Gaussian standard deviations) comparing the filled dots to the band. The filled band shows the position of the 68% window with respect to the expected value. |

png pdf |
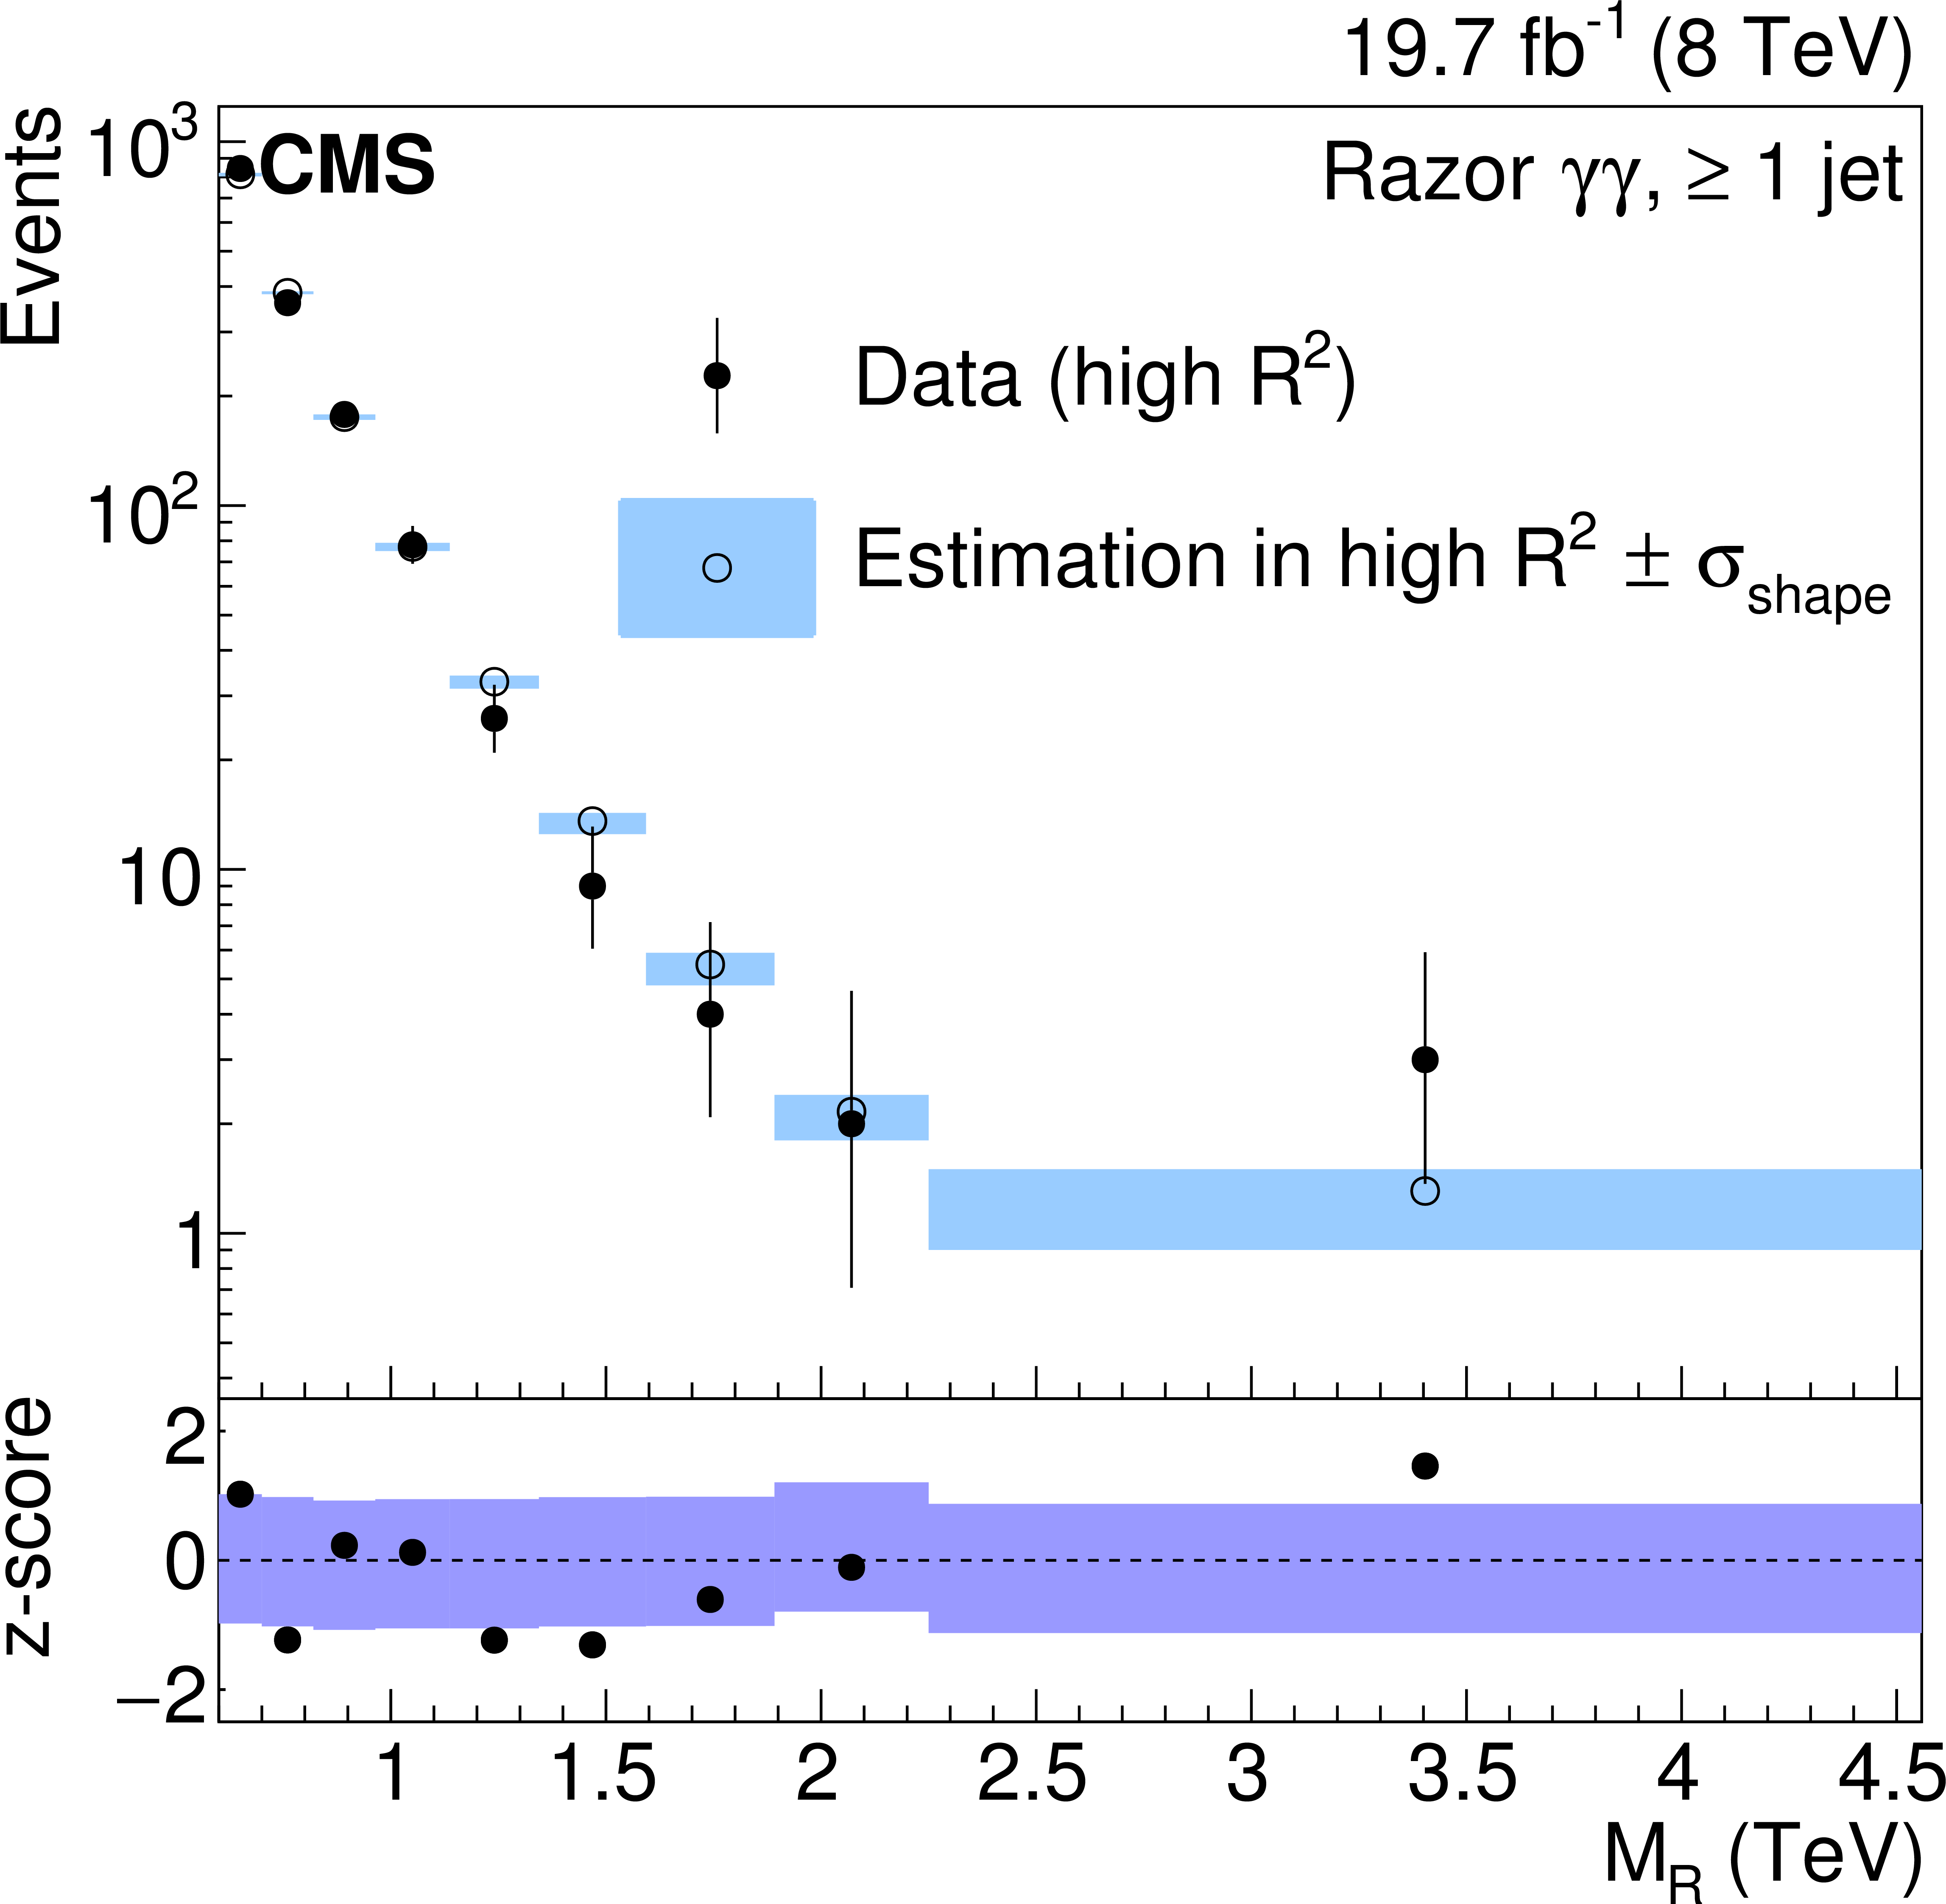
Figure 5-b:
Distribution of $ {M_\mathrm {R}} $ in the double-photon search for a control sample of jets misreconstructed as photons (see text) in the control (a) and signal (b) regions. The data are compared to the 68% range obtained from a fit in the control region and extrapolated to the signal region (blue bands). The open dots represent the center of the 68% range. The rightmost bin in each plot contains zero data entries. The bottom panel of each figure gives the z-scores (number of Gaussian standard deviations) comparing the filled dots to the band. The filled band shows the position of the 68% window with respect to the expected value. |
png pdf |
Figure 6:
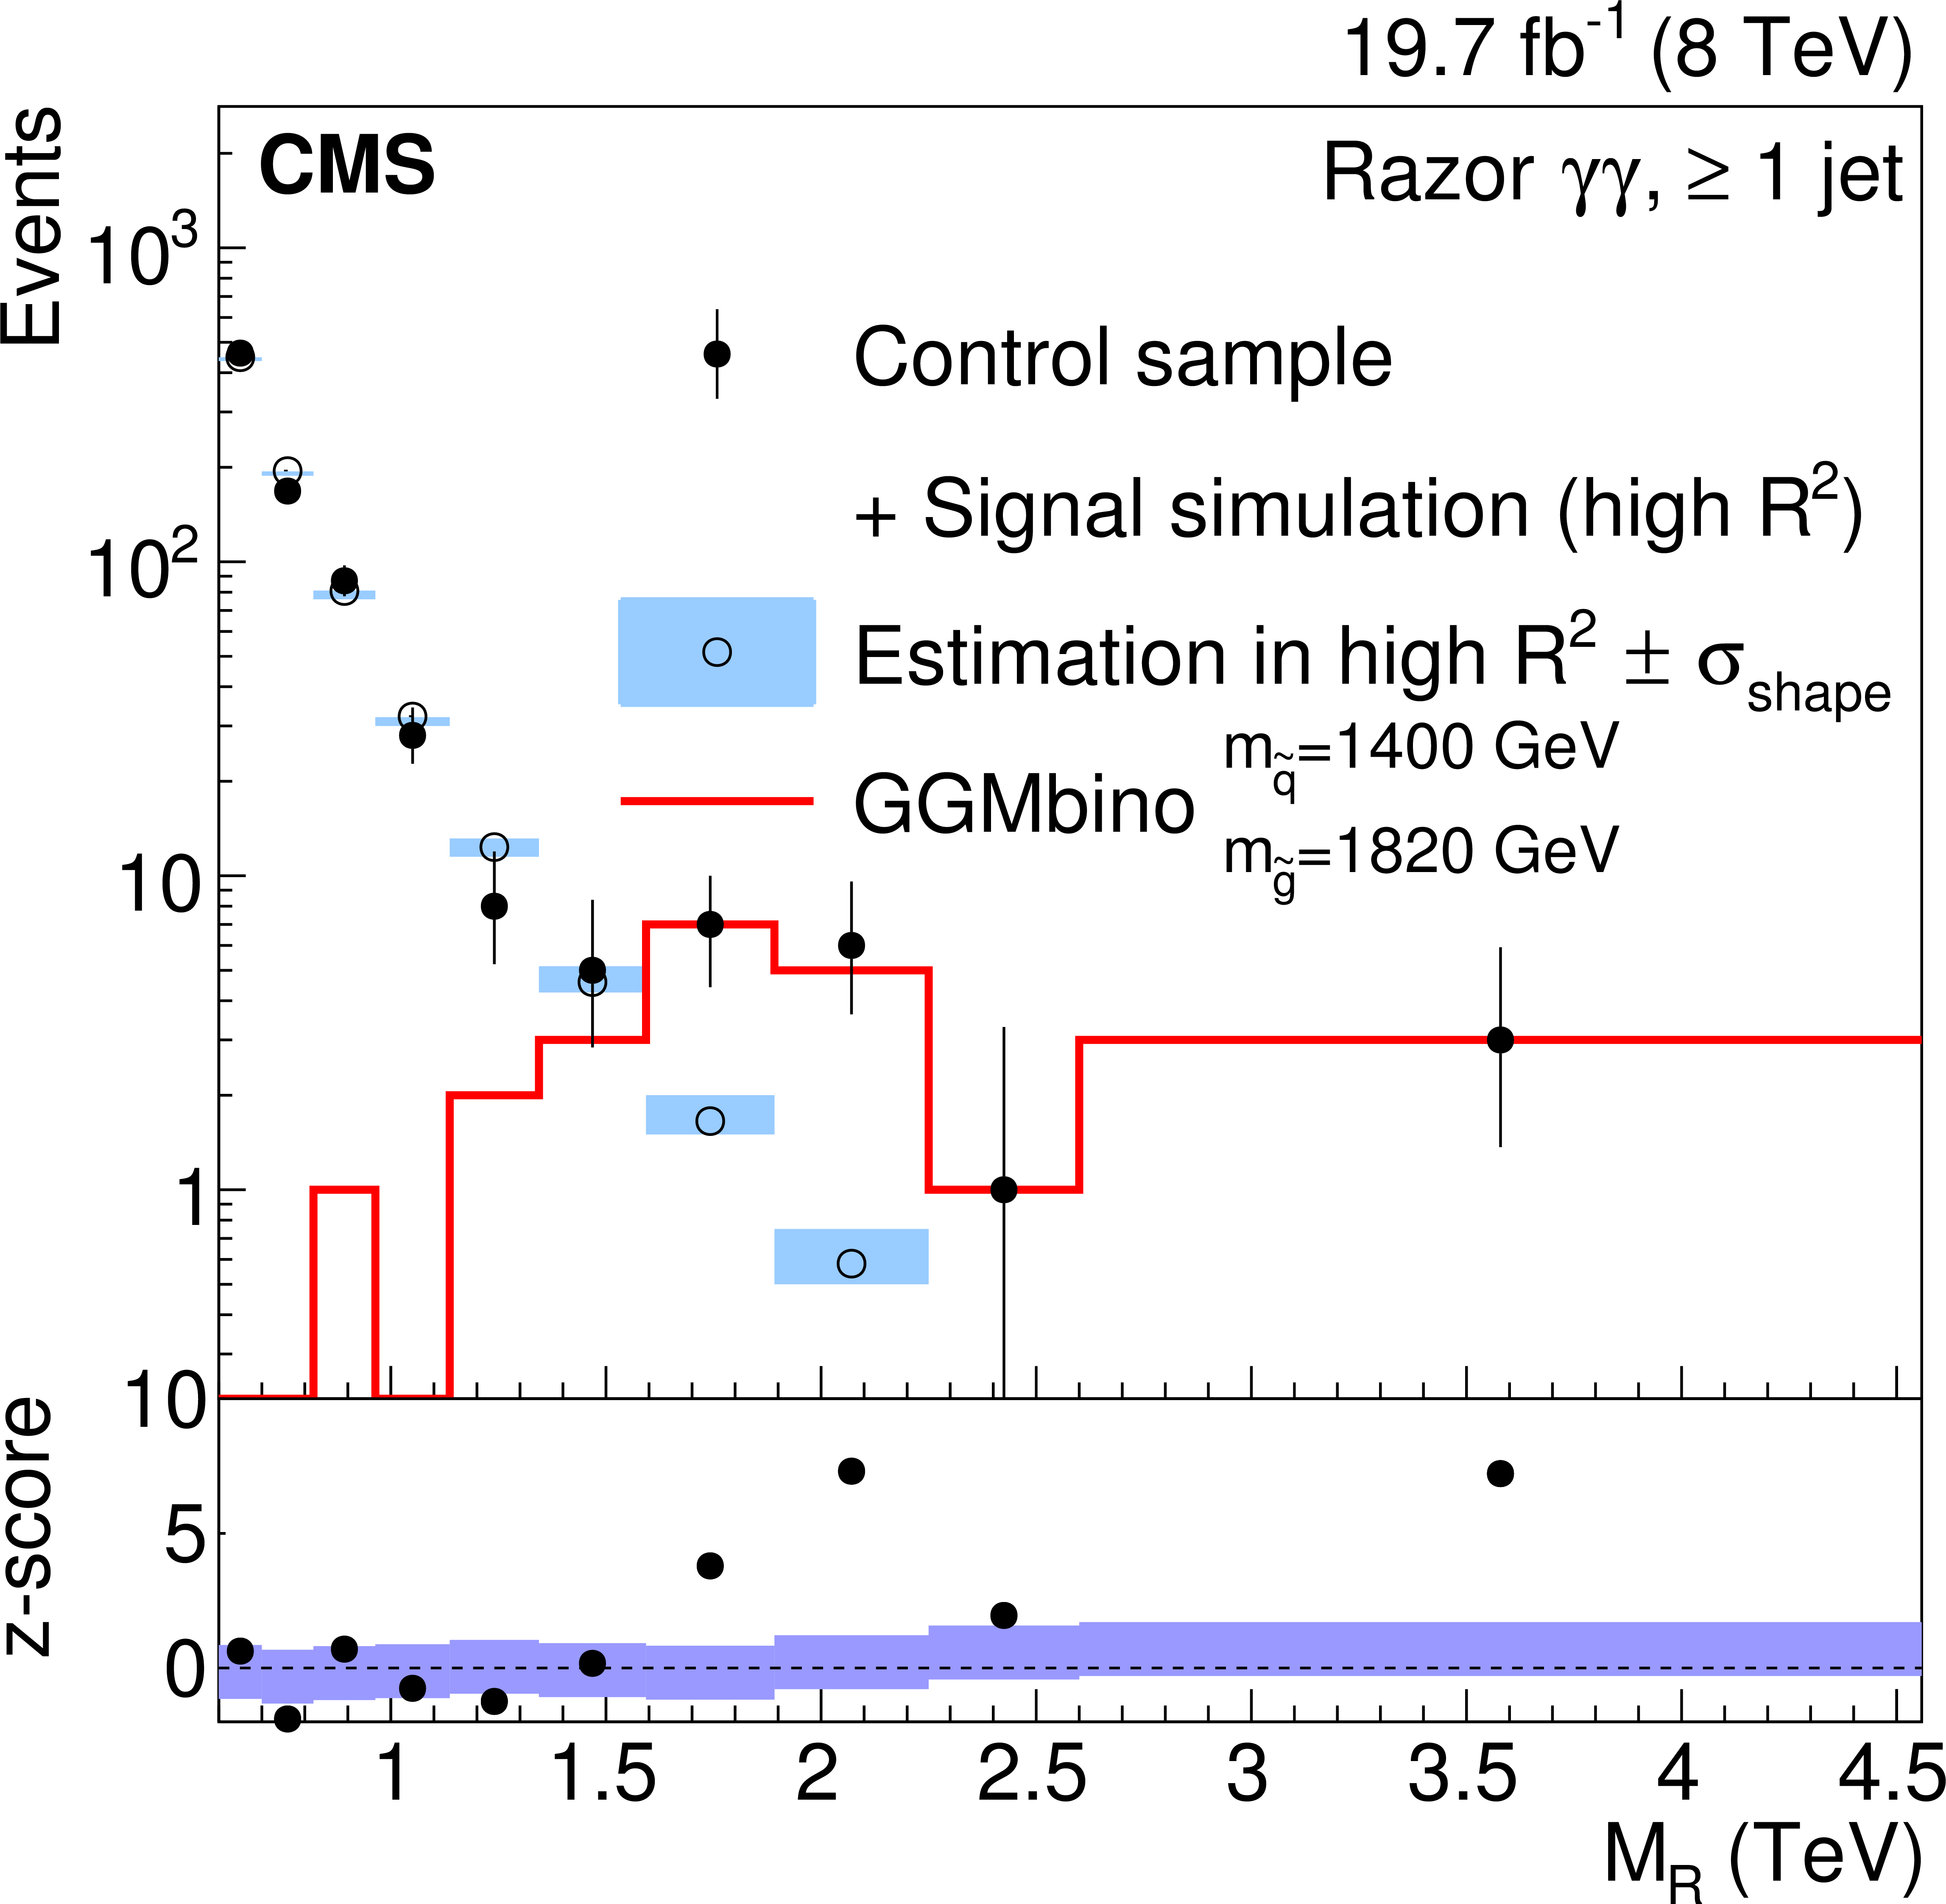
Distribution of $ {M_\mathrm {R}} $ in the double-photon search for a control sample of jets misreconstructed as photons to which a simulated sample of GGMbino events has been added. The squark and gluino masses are respectively set to $m_{\mathrm{ \tilde{q} } }=$ 1400 GeV and $m_{\mathrm{ \tilde{g} } }=$ 1820 GeV, and the production cross section is fixed to $\sigma =$ 2.7 fb. The signal contribution is shown by the red histogram. The representations of the uncertainty bands, data points, and the information shown in the bottom panel are the same as in Fig. 5. |
png pdf |
Figure 7-a:
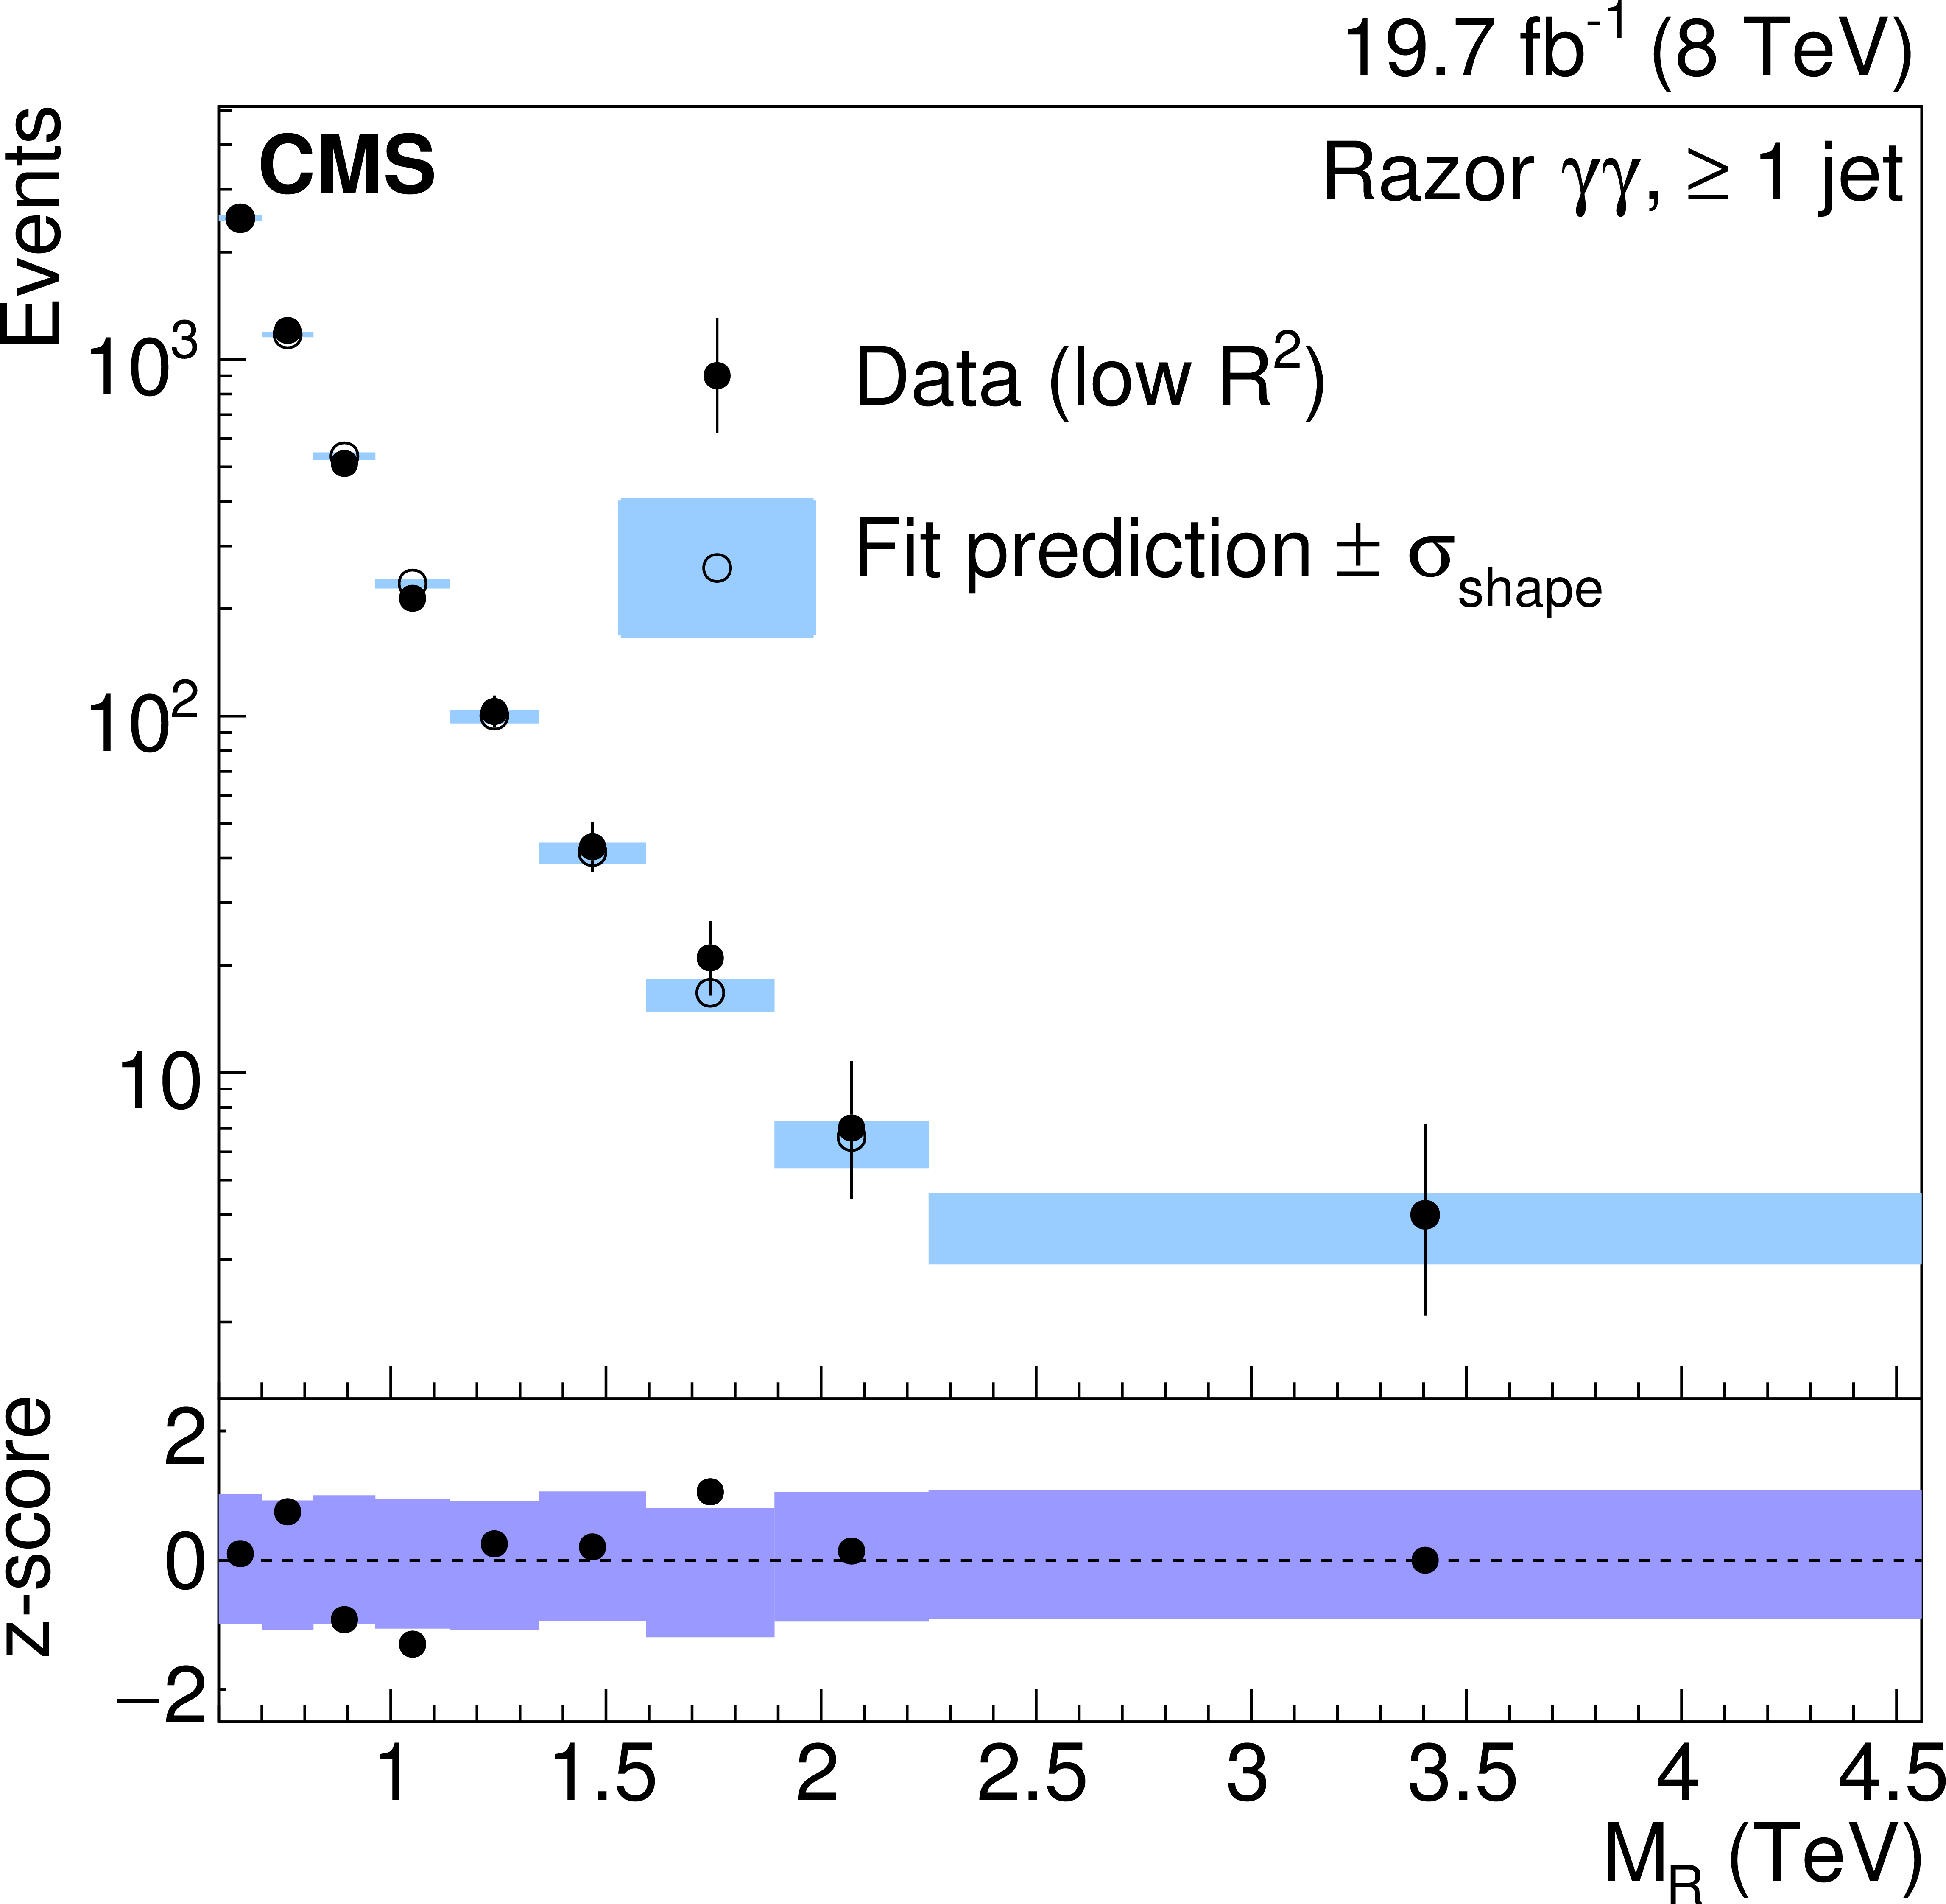
Distribution of $ {M_\mathrm {R}} $ for the control (a) and signal (b) regions. The representations of the uncertainty bands, data points, and the information shown in the bottom panel are the same as in Fig. 5. |
png pdf |
Figure 7-b:
Distribution of $ {M_\mathrm {R}} $ for the control (a) and signal (b) regions. The representations of the uncertainty bands, data points, and the information shown in the bottom panel are the same as in Fig. 5. |

png pdf |
Figure 8-a:
Single-photon analysis 95% CL observed upper limits on the signal cross section and exclusion contours in the gluino-squark (a,b) and gaugino-gluino (c,d) mass plane for the GGMbino (a), GGMwino (b), T5gg (c), and T5wg (d) models. The thick red dashed (black solid) line shows the expected (observed) limit. The thin dashed line and band show the 68% CL range about the expected limit. The solid line quantifies the impact of the theoretical uncertainty in the cross section on the observed limit. The color scale shows the excluded cross section for each set of mass values. |
png pdf |
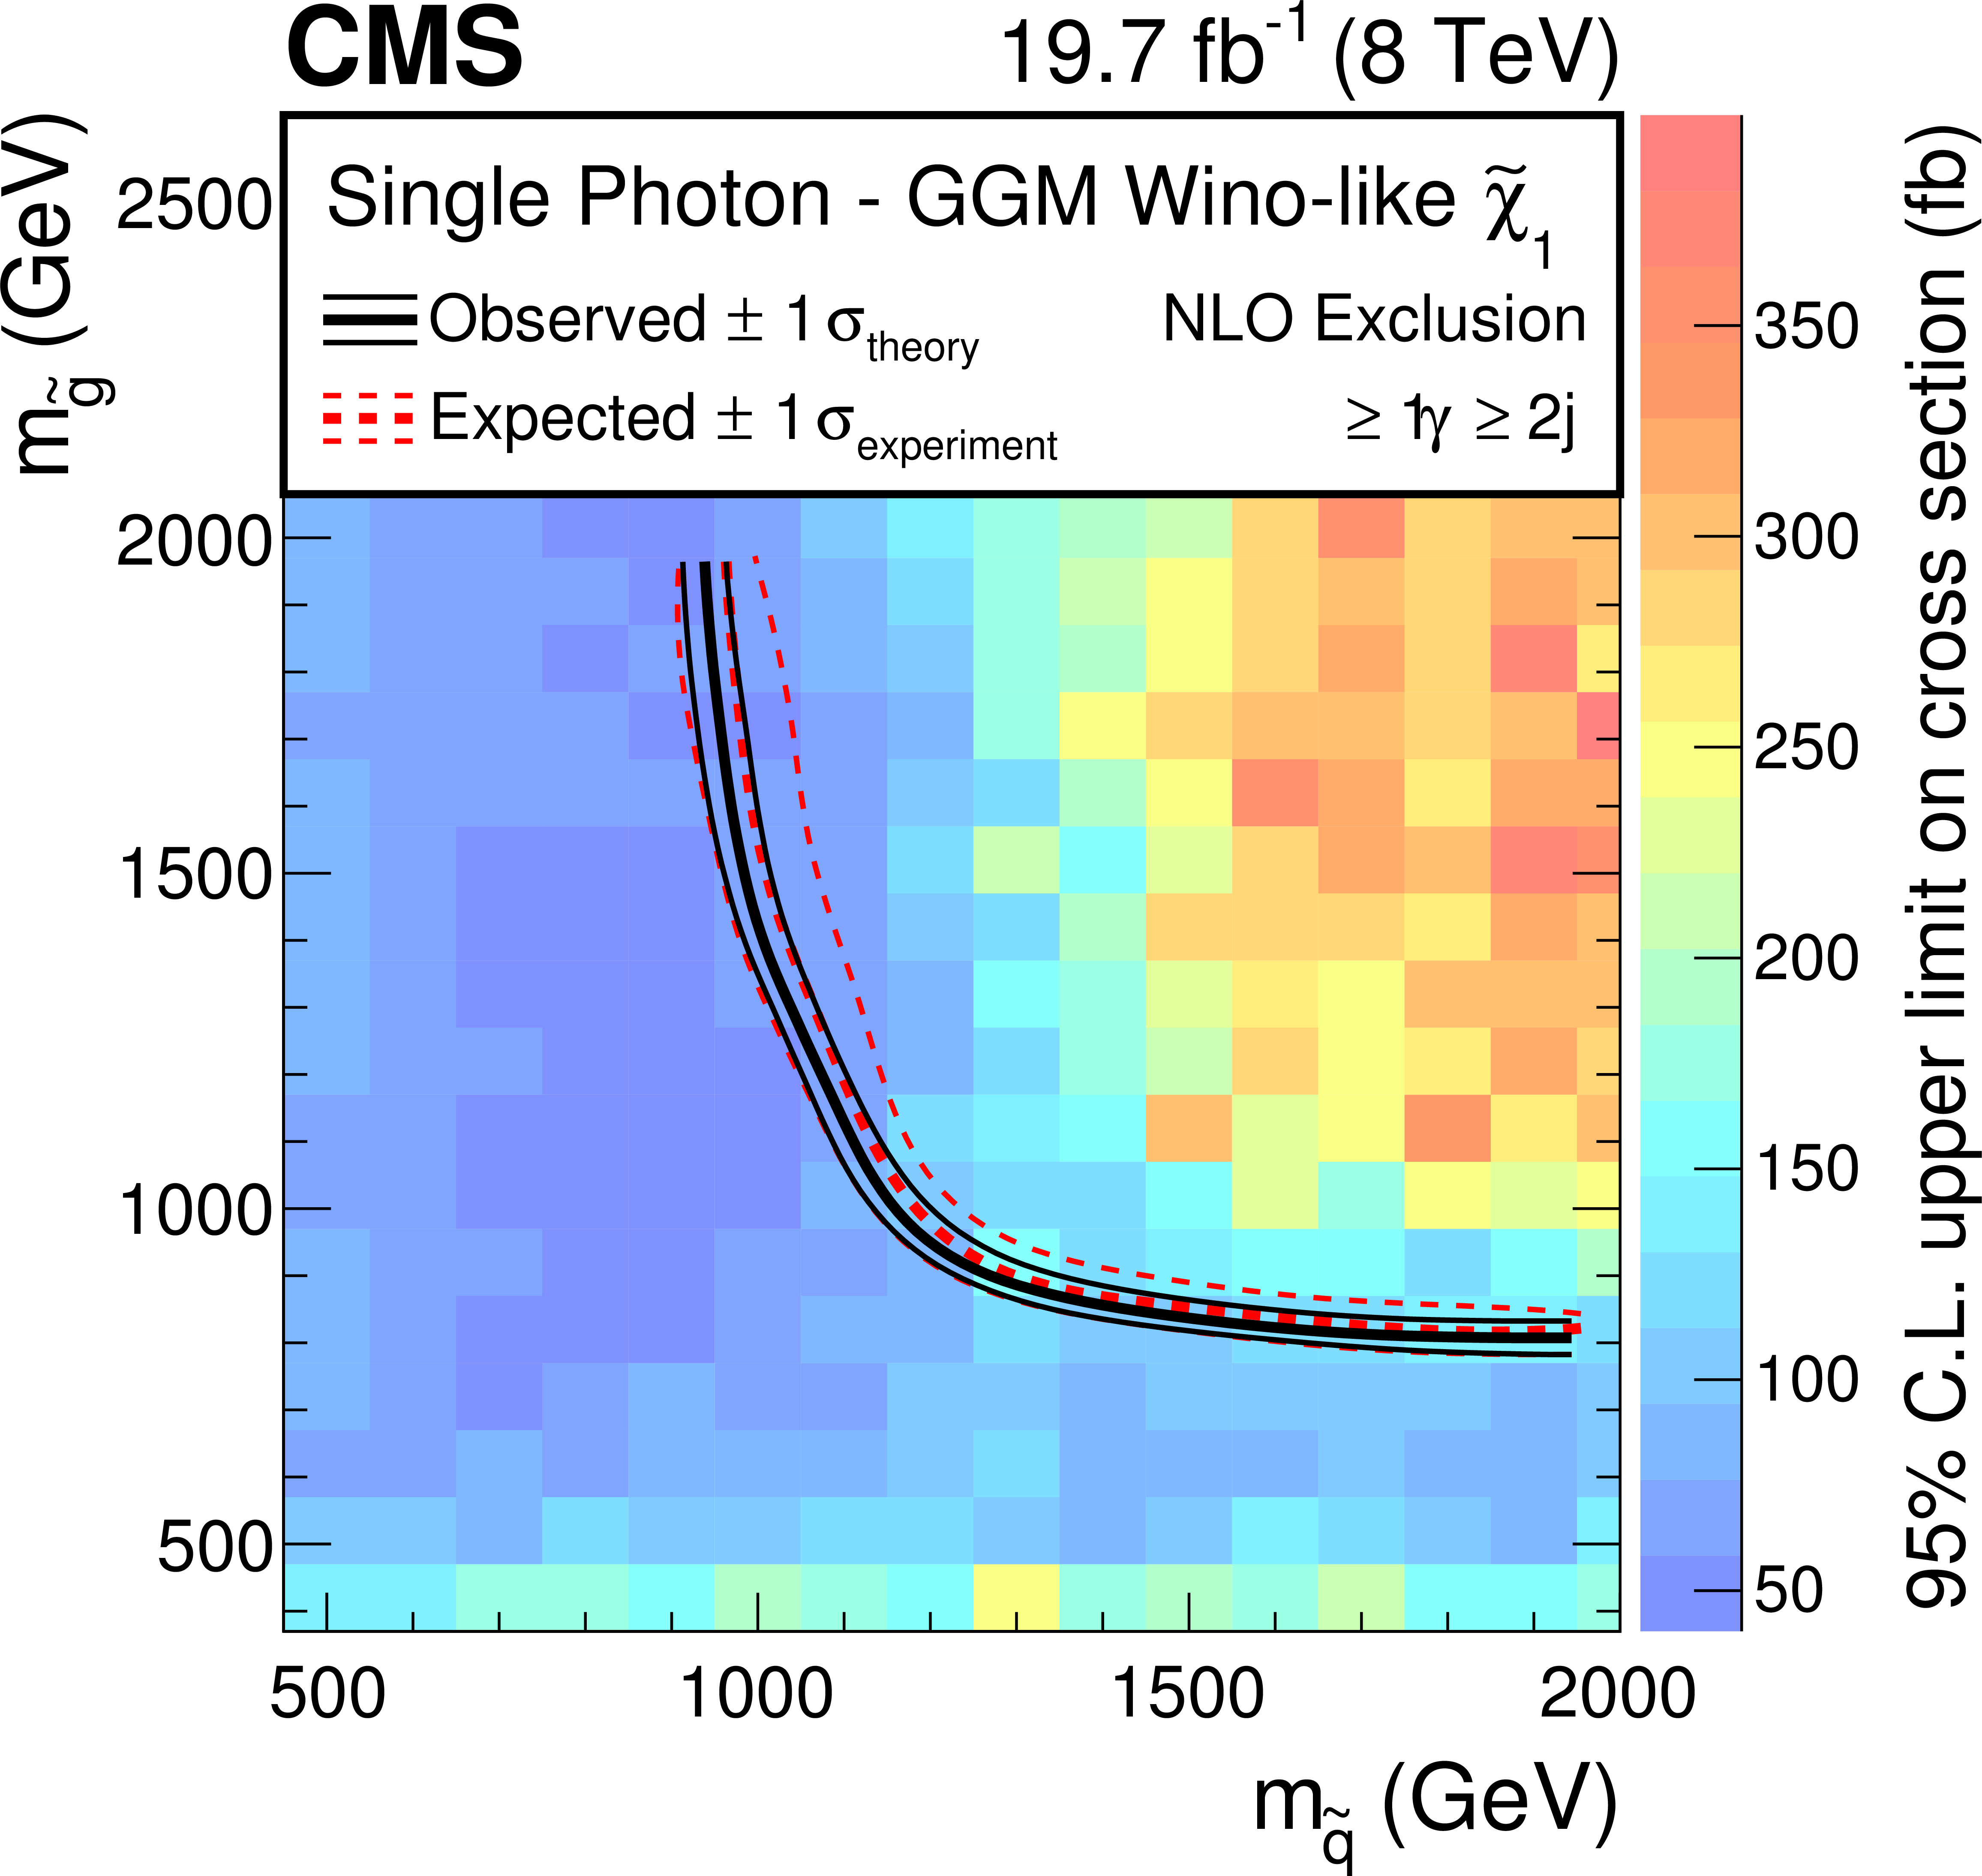
Figure 8-b:
Single-photon analysis 95% CL observed upper limits on the signal cross section and exclusion contours in the gluino-squark (a,b) and gaugino-gluino (c,d) mass plane for the GGMbino (a), GGMwino (b), T5gg (c), and T5wg (d) models. The thick red dashed (black solid) line shows the expected (observed) limit. The thin dashed line and band show the 68% CL range about the expected limit. The solid line quantifies the impact of the theoretical uncertainty in the cross section on the observed limit. The color scale shows the excluded cross section for each set of mass values. |
png pdf |
Figure 8-c:
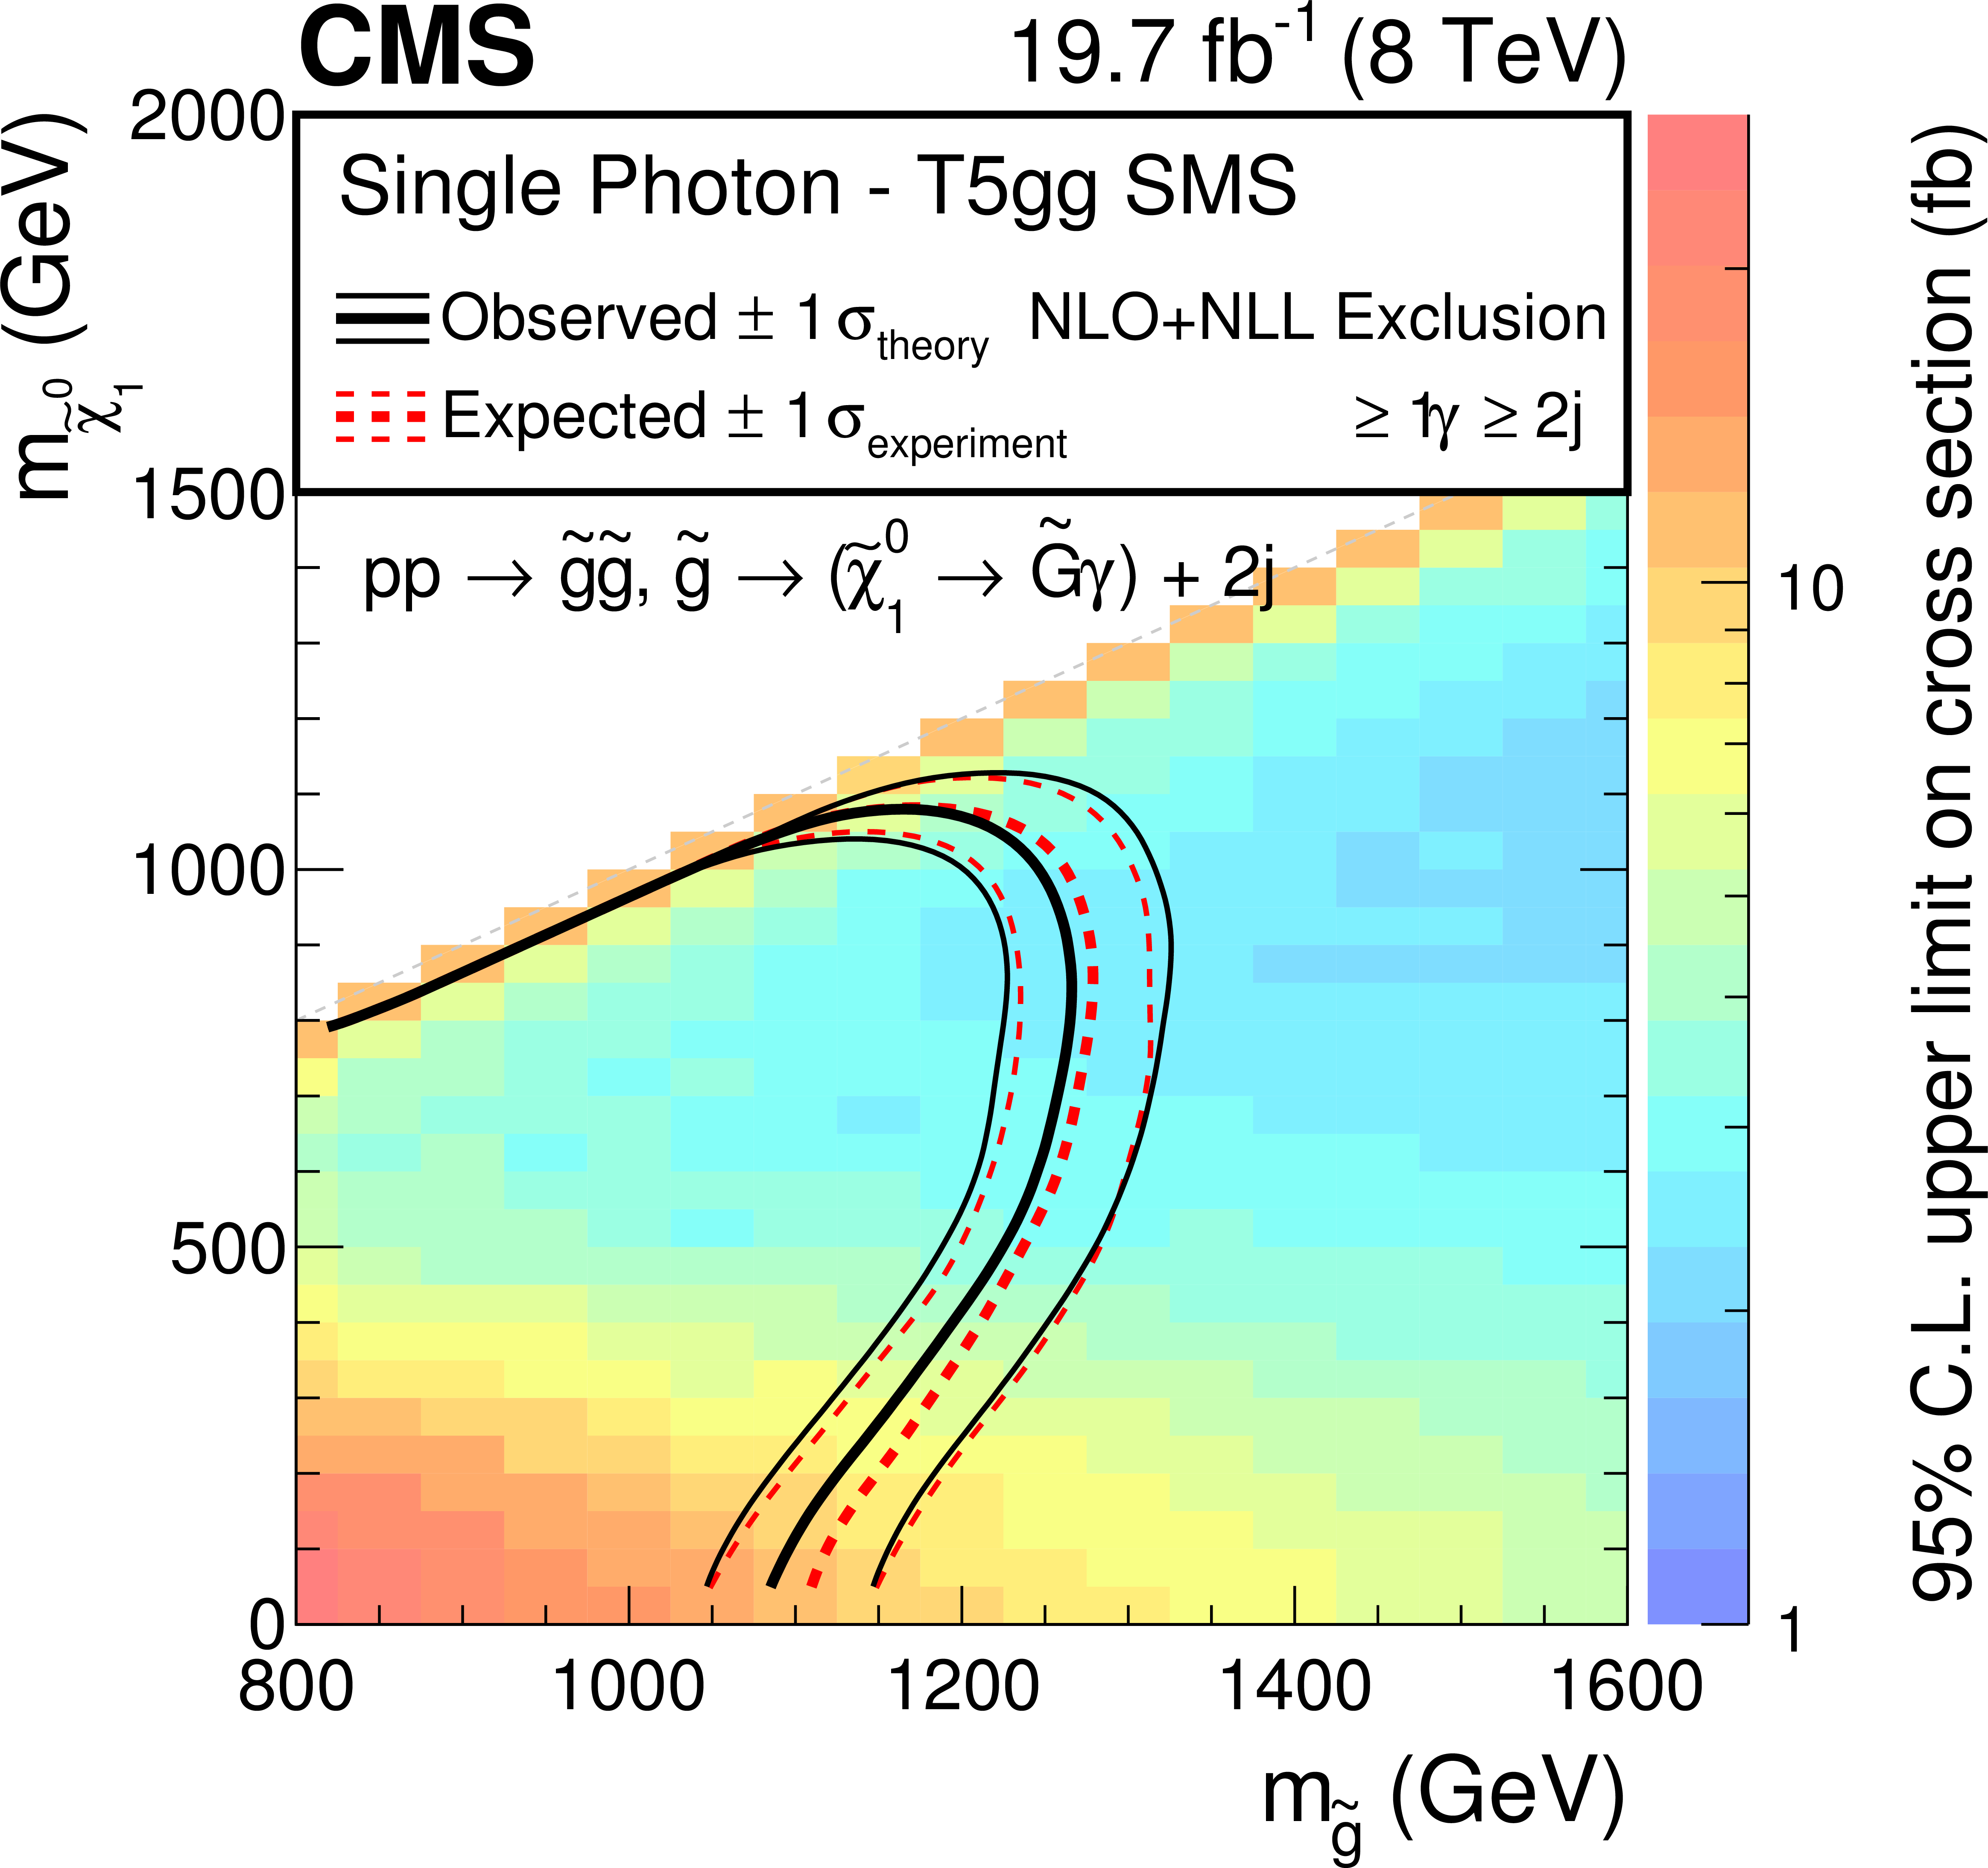
Single-photon analysis 95% CL observed upper limits on the signal cross section and exclusion contours in the gluino-squark (a,b) and gaugino-gluino (c,d) mass plane for the GGMbino (a), GGMwino (b), T5gg (c), and T5wg (d) models. The thick red dashed (black solid) line shows the expected (observed) limit. The thin dashed line and band show the 68% CL range about the expected limit. The solid line quantifies the impact of the theoretical uncertainty in the cross section on the observed limit. The color scale shows the excluded cross section for each set of mass values. |
png pdf |
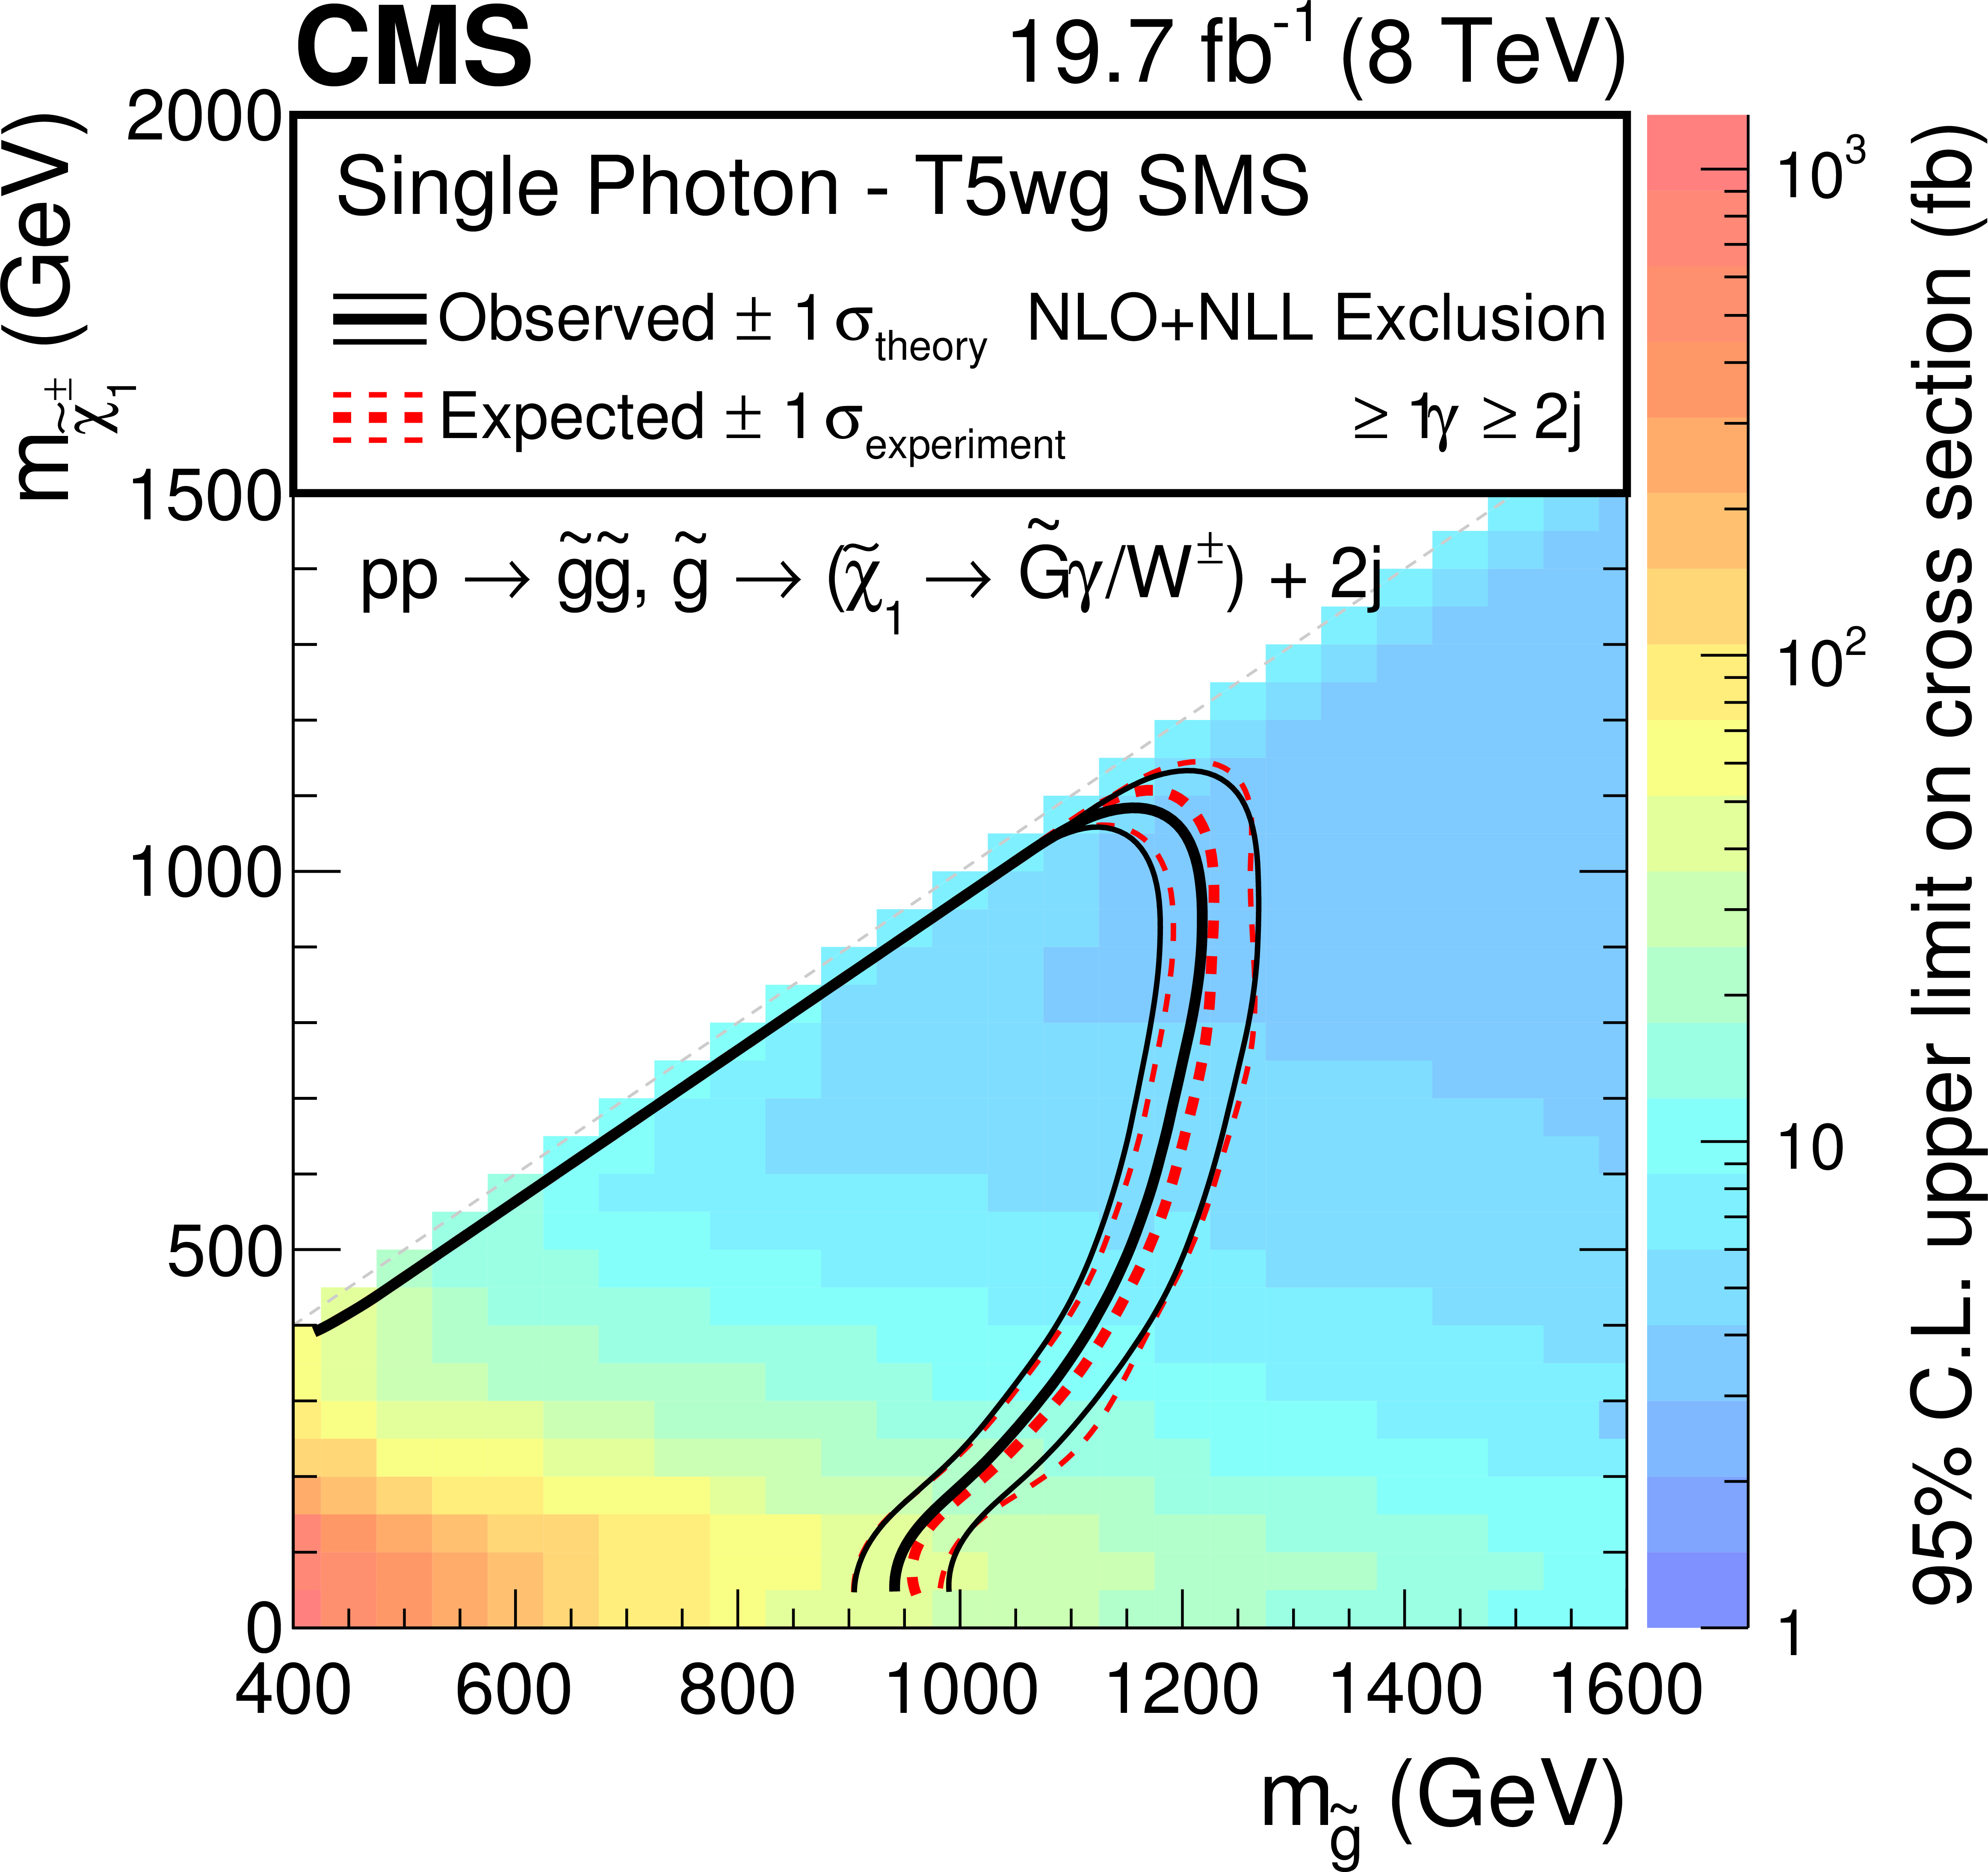
Figure 8-d:
Single-photon analysis 95% CL observed upper limits on the signal cross section and exclusion contours in the gluino-squark (a,b) and gaugino-gluino (c,d) mass plane for the GGMbino (a), GGMwino (b), T5gg (c), and T5wg (d) models. The thick red dashed (black solid) line shows the expected (observed) limit. The thin dashed line and band show the 68% CL range about the expected limit. The solid line quantifies the impact of the theoretical uncertainty in the cross section on the observed limit. The color scale shows the excluded cross section for each set of mass values. |
png pdf |
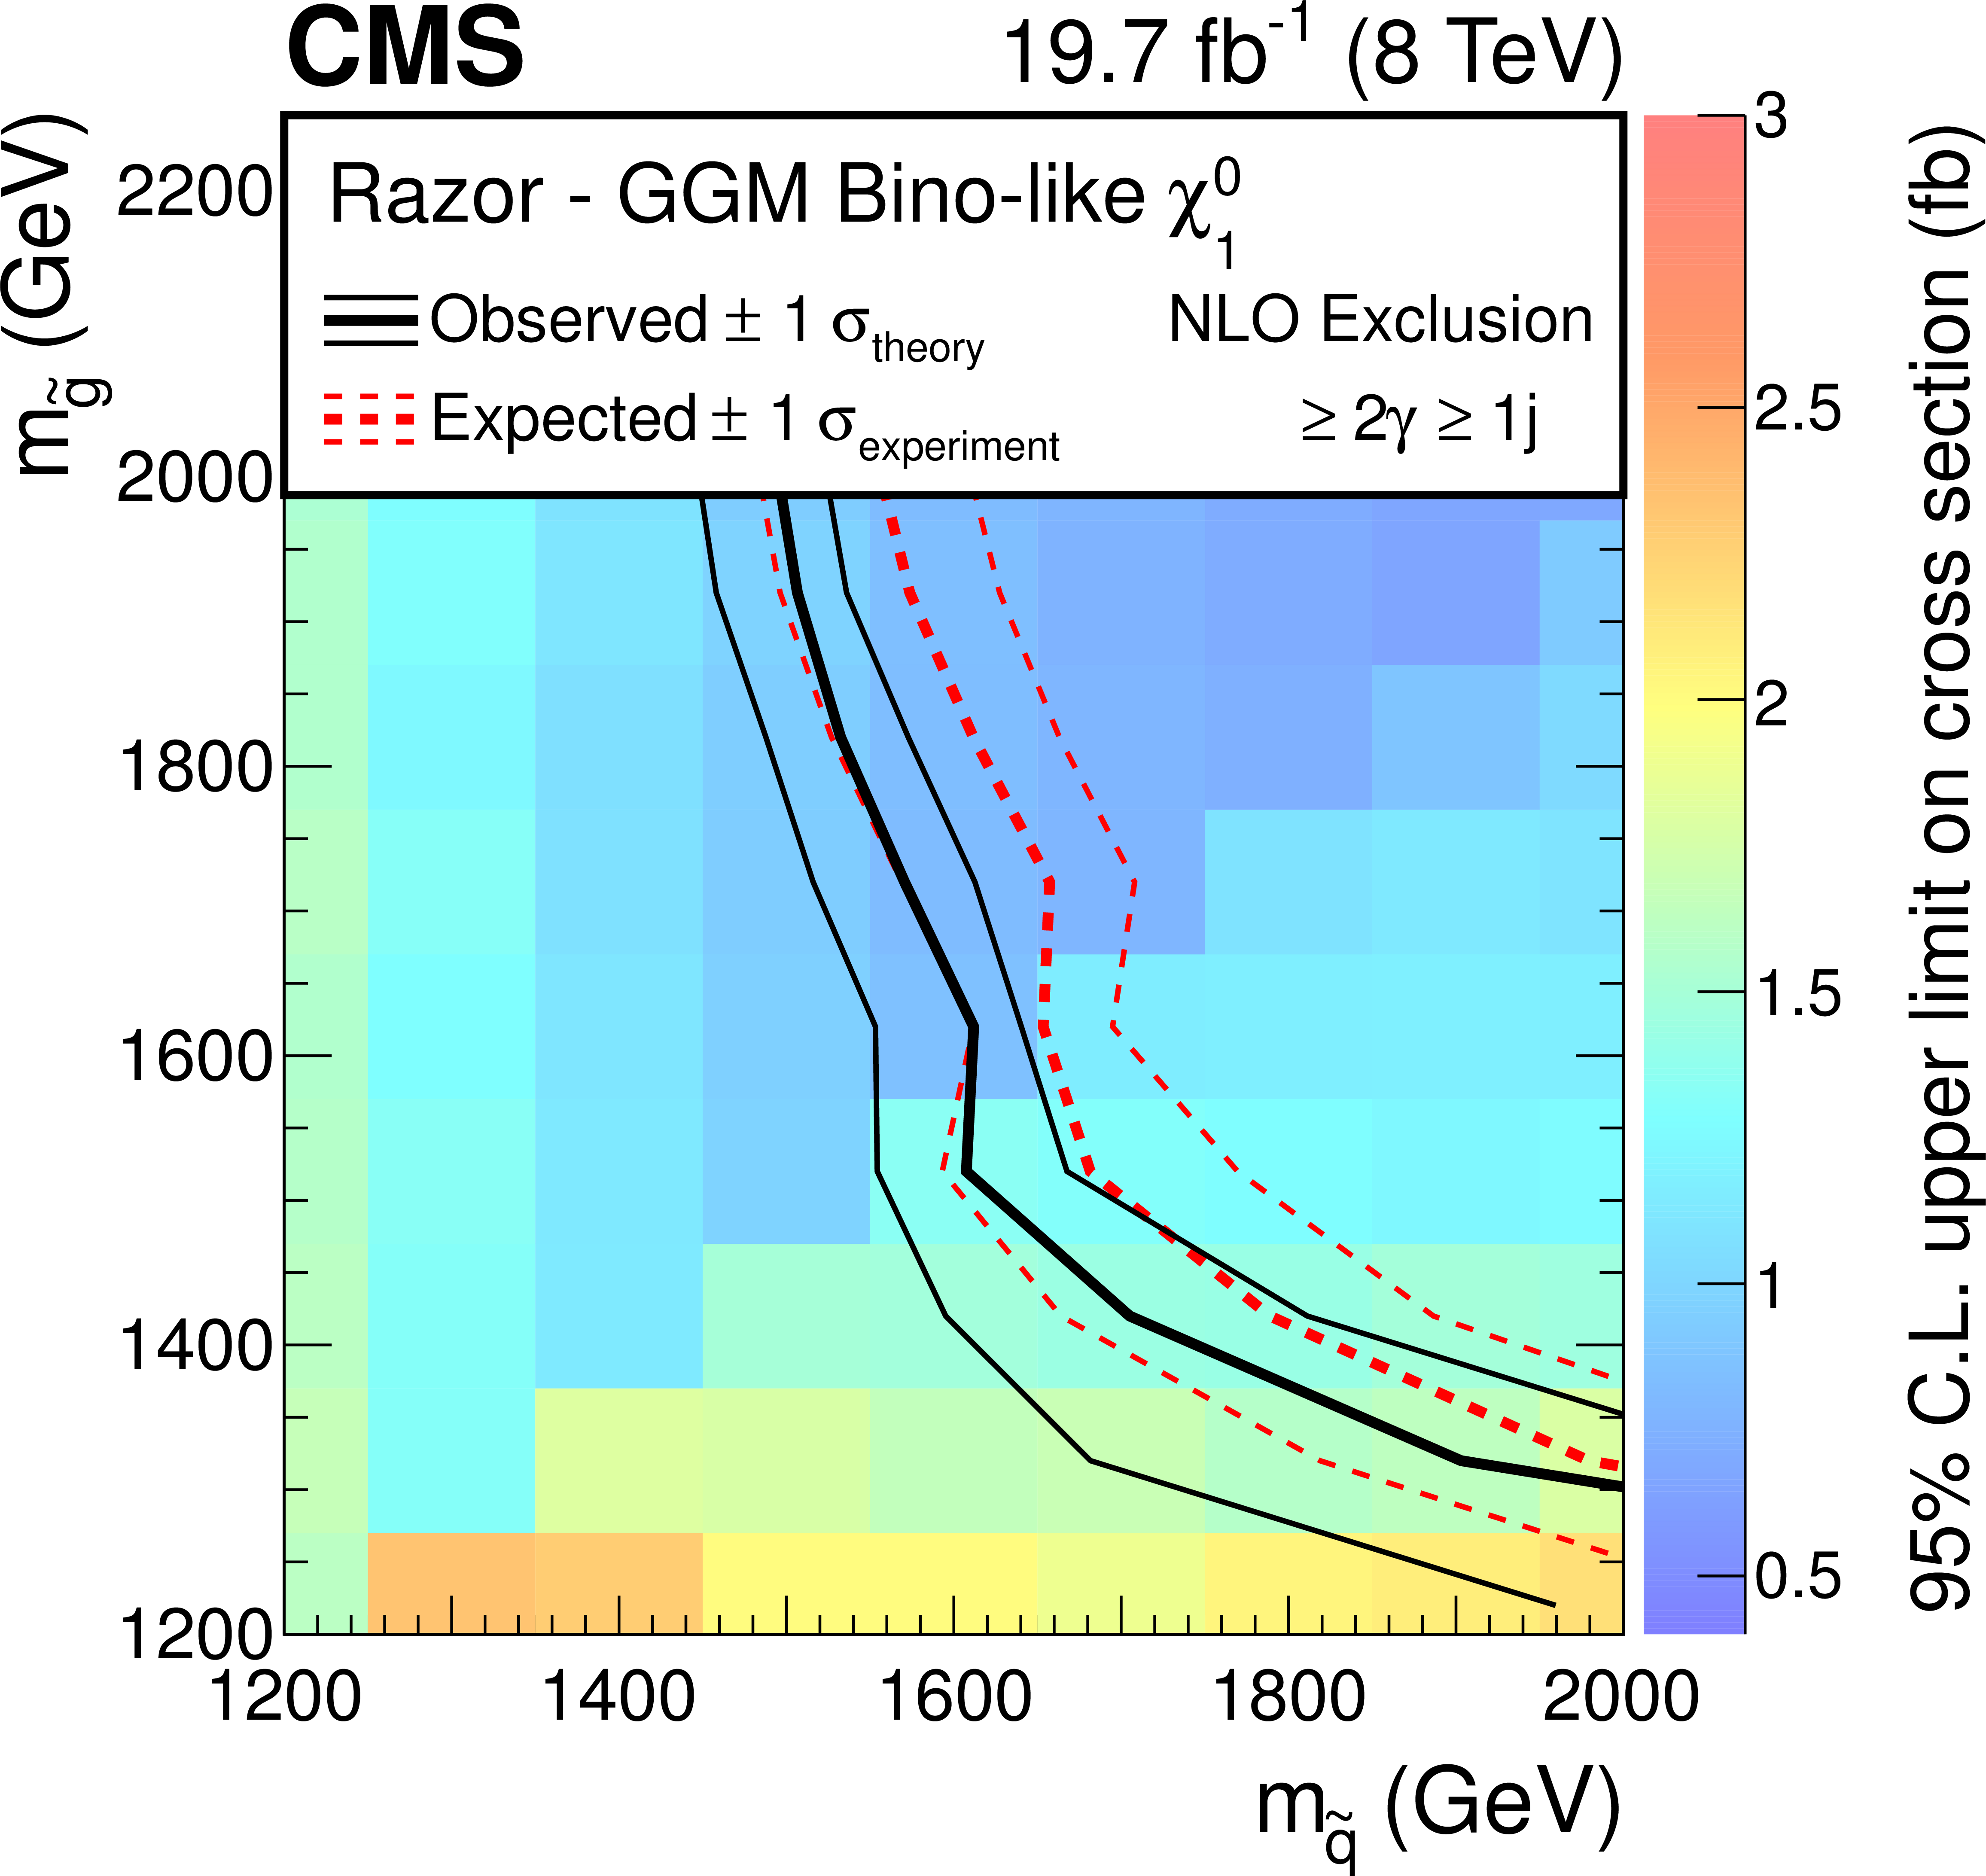
Figure 9-a:
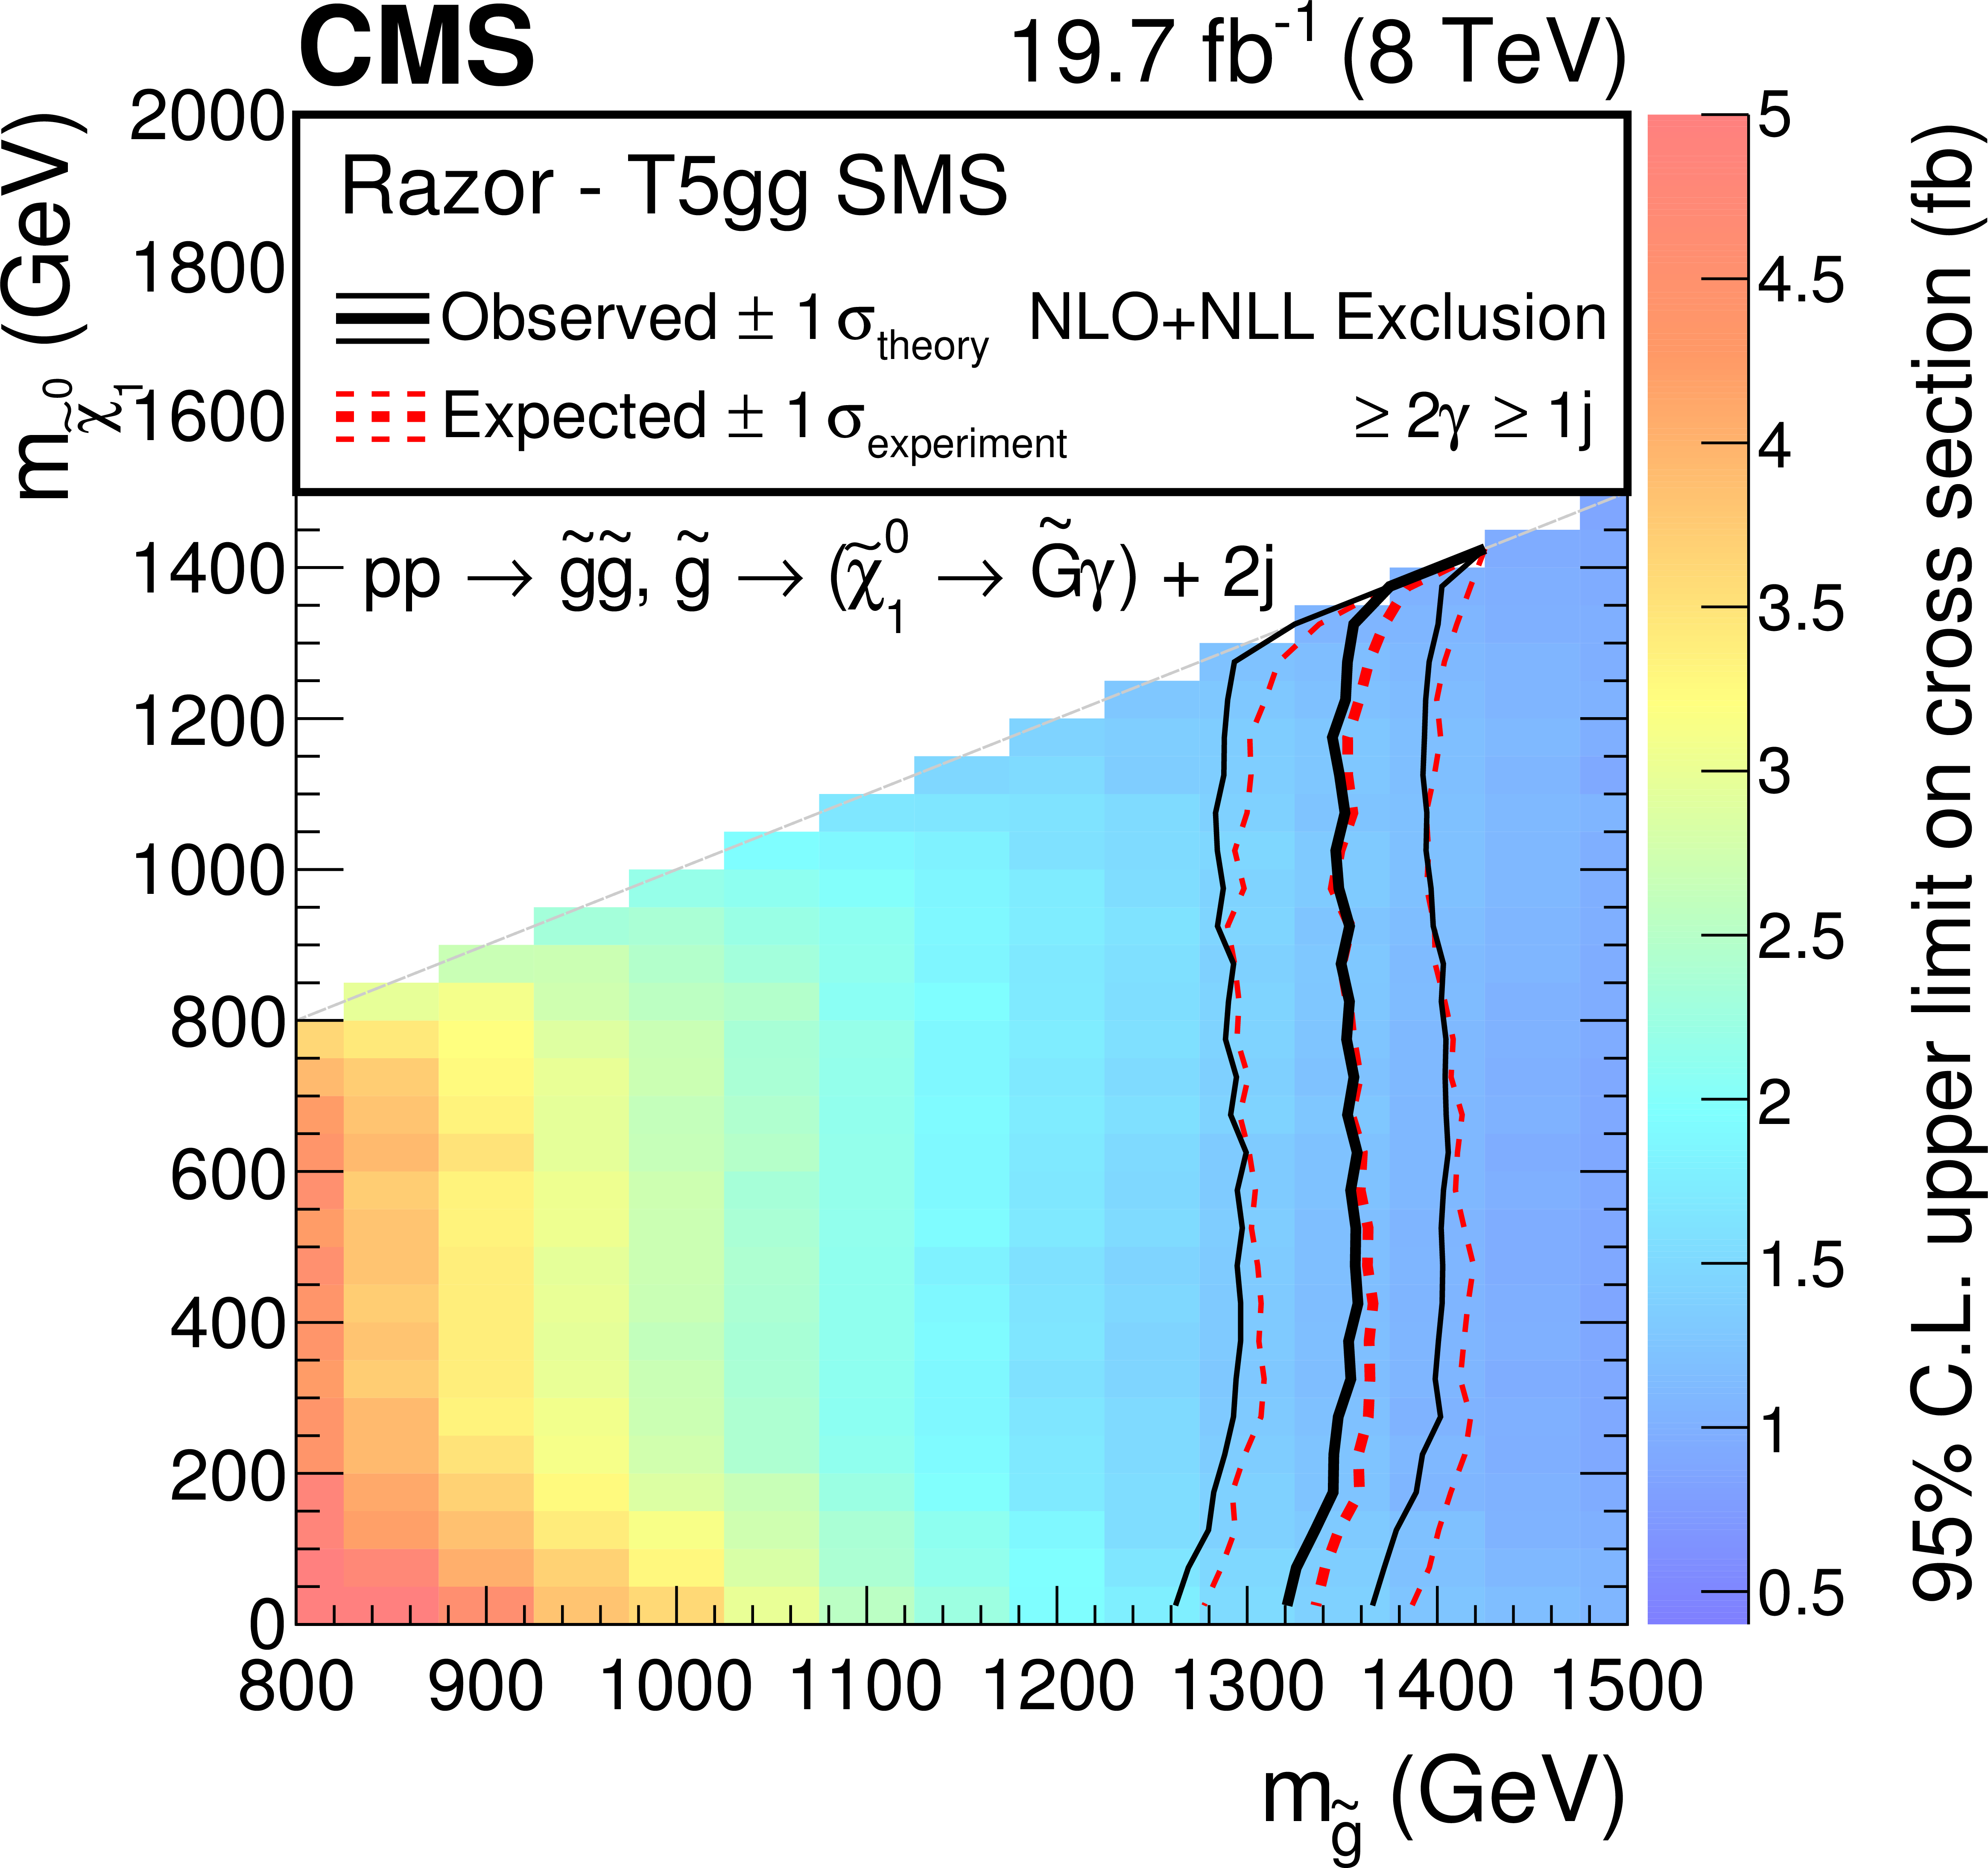
Double-photon analysis 95% CL observed cross section upper limits and excluded mass regions for the GGMbino (left) and T5gg (right) models. The representations of excluded regions and cross sections are the same as in Fig. 8. |
png pdf |
Figure 9-b:
Double-photon analysis 95% CL observed cross section upper limits and excluded mass regions for the GGMbino (left) and T5gg (right) models. The representations of excluded regions and cross sections are the same as in Fig. 8. |
| Tables | |
png pdf |
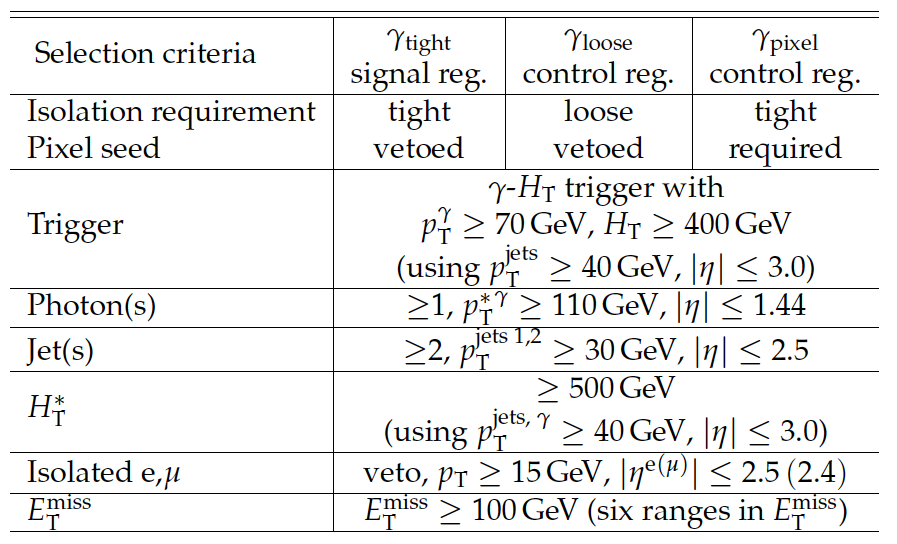
Table 1:
Summary of the single-photon analysis selection criteria. |
png pdf |
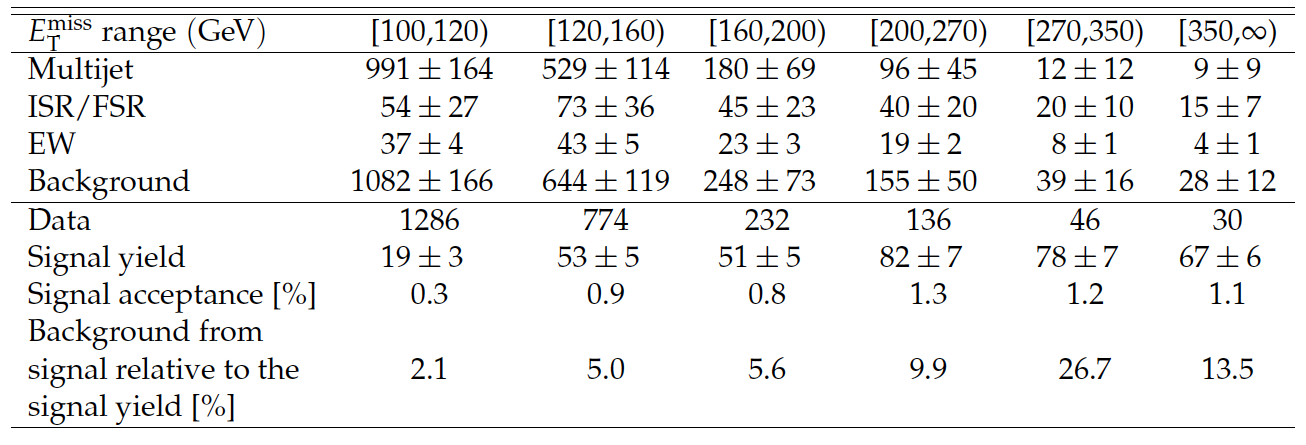
Table 2:
Observed numbers of events and standard model background predictions for the single-photon search. The signal yield and acceptance for the GGMwino model with $m_{ \mathrm{ \tilde{q} } }=$ 1700 GeV and $m_{ {\mathrm {\tilde{g}}} }=$ 720 GeV, with a total signal cross section of $\sigma_{\text{NLO}}=$ 0.32 pb, are also shown. The last line gives the additional number of background events, normalized to the signal yield, that is associated with signal contributions to the two control regions. |

png pdf |
Table 3:
The systematic uncertainties associated with signal model yields. For the double-photon razor analysis, the contributions labeled as ``shape'' have different sizes, depending on $ {M_\mathrm {R}} $. |
| Summary |
| Two searches for gauge-mediated supersymmetry are presented: a search based on events with at least one photon and at least two jets, and a search based on events with at least two photons and at least one jet. The single-photon search characterizes a potential signal as an excess in the tail of the $E_{\mathrm{T}}^{\text{miss}}$ spectrum beyond 100 GeV, while the double-photon search exploits the razor variables $M_{\mathrm{R}}$ and $\mathrm{R}^2$. These searches are based on pp collision data collected with the CMS experiment at a center-of-mass energy of $\sqrt{s} = $ 8 TeV, corresponding to an integrated luminosity of of 19.7 fb$^{-1}$. No evidence for supersymmetry production is found, and 95% CL upper limits are set on the production cross sections, in the context of simplified models of gauge-mediated supersymmetry breaking and general gauge-mediation (GGM) models. Lower limits from the double-photon razor analysis range beyond 1.3 TeV for the gluino mass and beyond 1.5 TeV for the squark mass for bino-like neutralino mixings in the studied GGM phase space, extending previous limits by up to 300 and 500 GeV, respectively. The limits from the single-photon analysis for wino-like neutralino mixings range beyond 0.8 TeV for the gluino mass and 1 TeV for the squark mass in the same GGM phase space, extending previous limits by about 100 and 200 GeV. Within the discussed supersymmetry scenarios, these results represent the current most stringent limits. |
|
|
Compact Muon Solenoid LHC, CERN |
|

|

|

|

|

|