

Compact Muon Solenoid
LHC, CERN
| CMS-SUS-14-013 ; CERN-PH-EP-2015-169 | ||
| Search for supersymmetry in events with a photon, a lepton, and missing transverse momentum in pp collisions at $\sqrt{s} =$ 8 TeV | ||
| CMS Collaboration | ||
| 5 August 2015 | ||
| _PUBLI-ONL_ | ||
| Abstract: A search for supersymmetry involving events with at least one photon, one electron or muon, and large missing transverse momentum has been performed by the CMS experiment. The data sample corresponds to an integrated luminosity of 19.7 fb$^{-1}$ of pp collisions at $\sqrt{s}=$ 8 TeV, produced at the CERN LHC. No excess of events is observed beyond expectations from standard model processes. The result of the search is interpreted in the context of a general model of gauge-mediated supersymmetry breaking, where the charged and neutral winos are the next-to-lightest supersymmetric particles. Within this model, winos with a mass up to 360 GeV are excluded at the 95\% confidence level. Two simplified models inspired by gauge-mediated supersymmetry breaking are also examined, and used to derive upper limits on the production cross sections of specific supersymmetric processes. | ||
| Links: e-print arXiv:1508.01218 [hep-ex] (PDF) ; CDS record ; inSPIRE record ; CADI line (restricted) ; | ||
| Figures | |
png pdf |
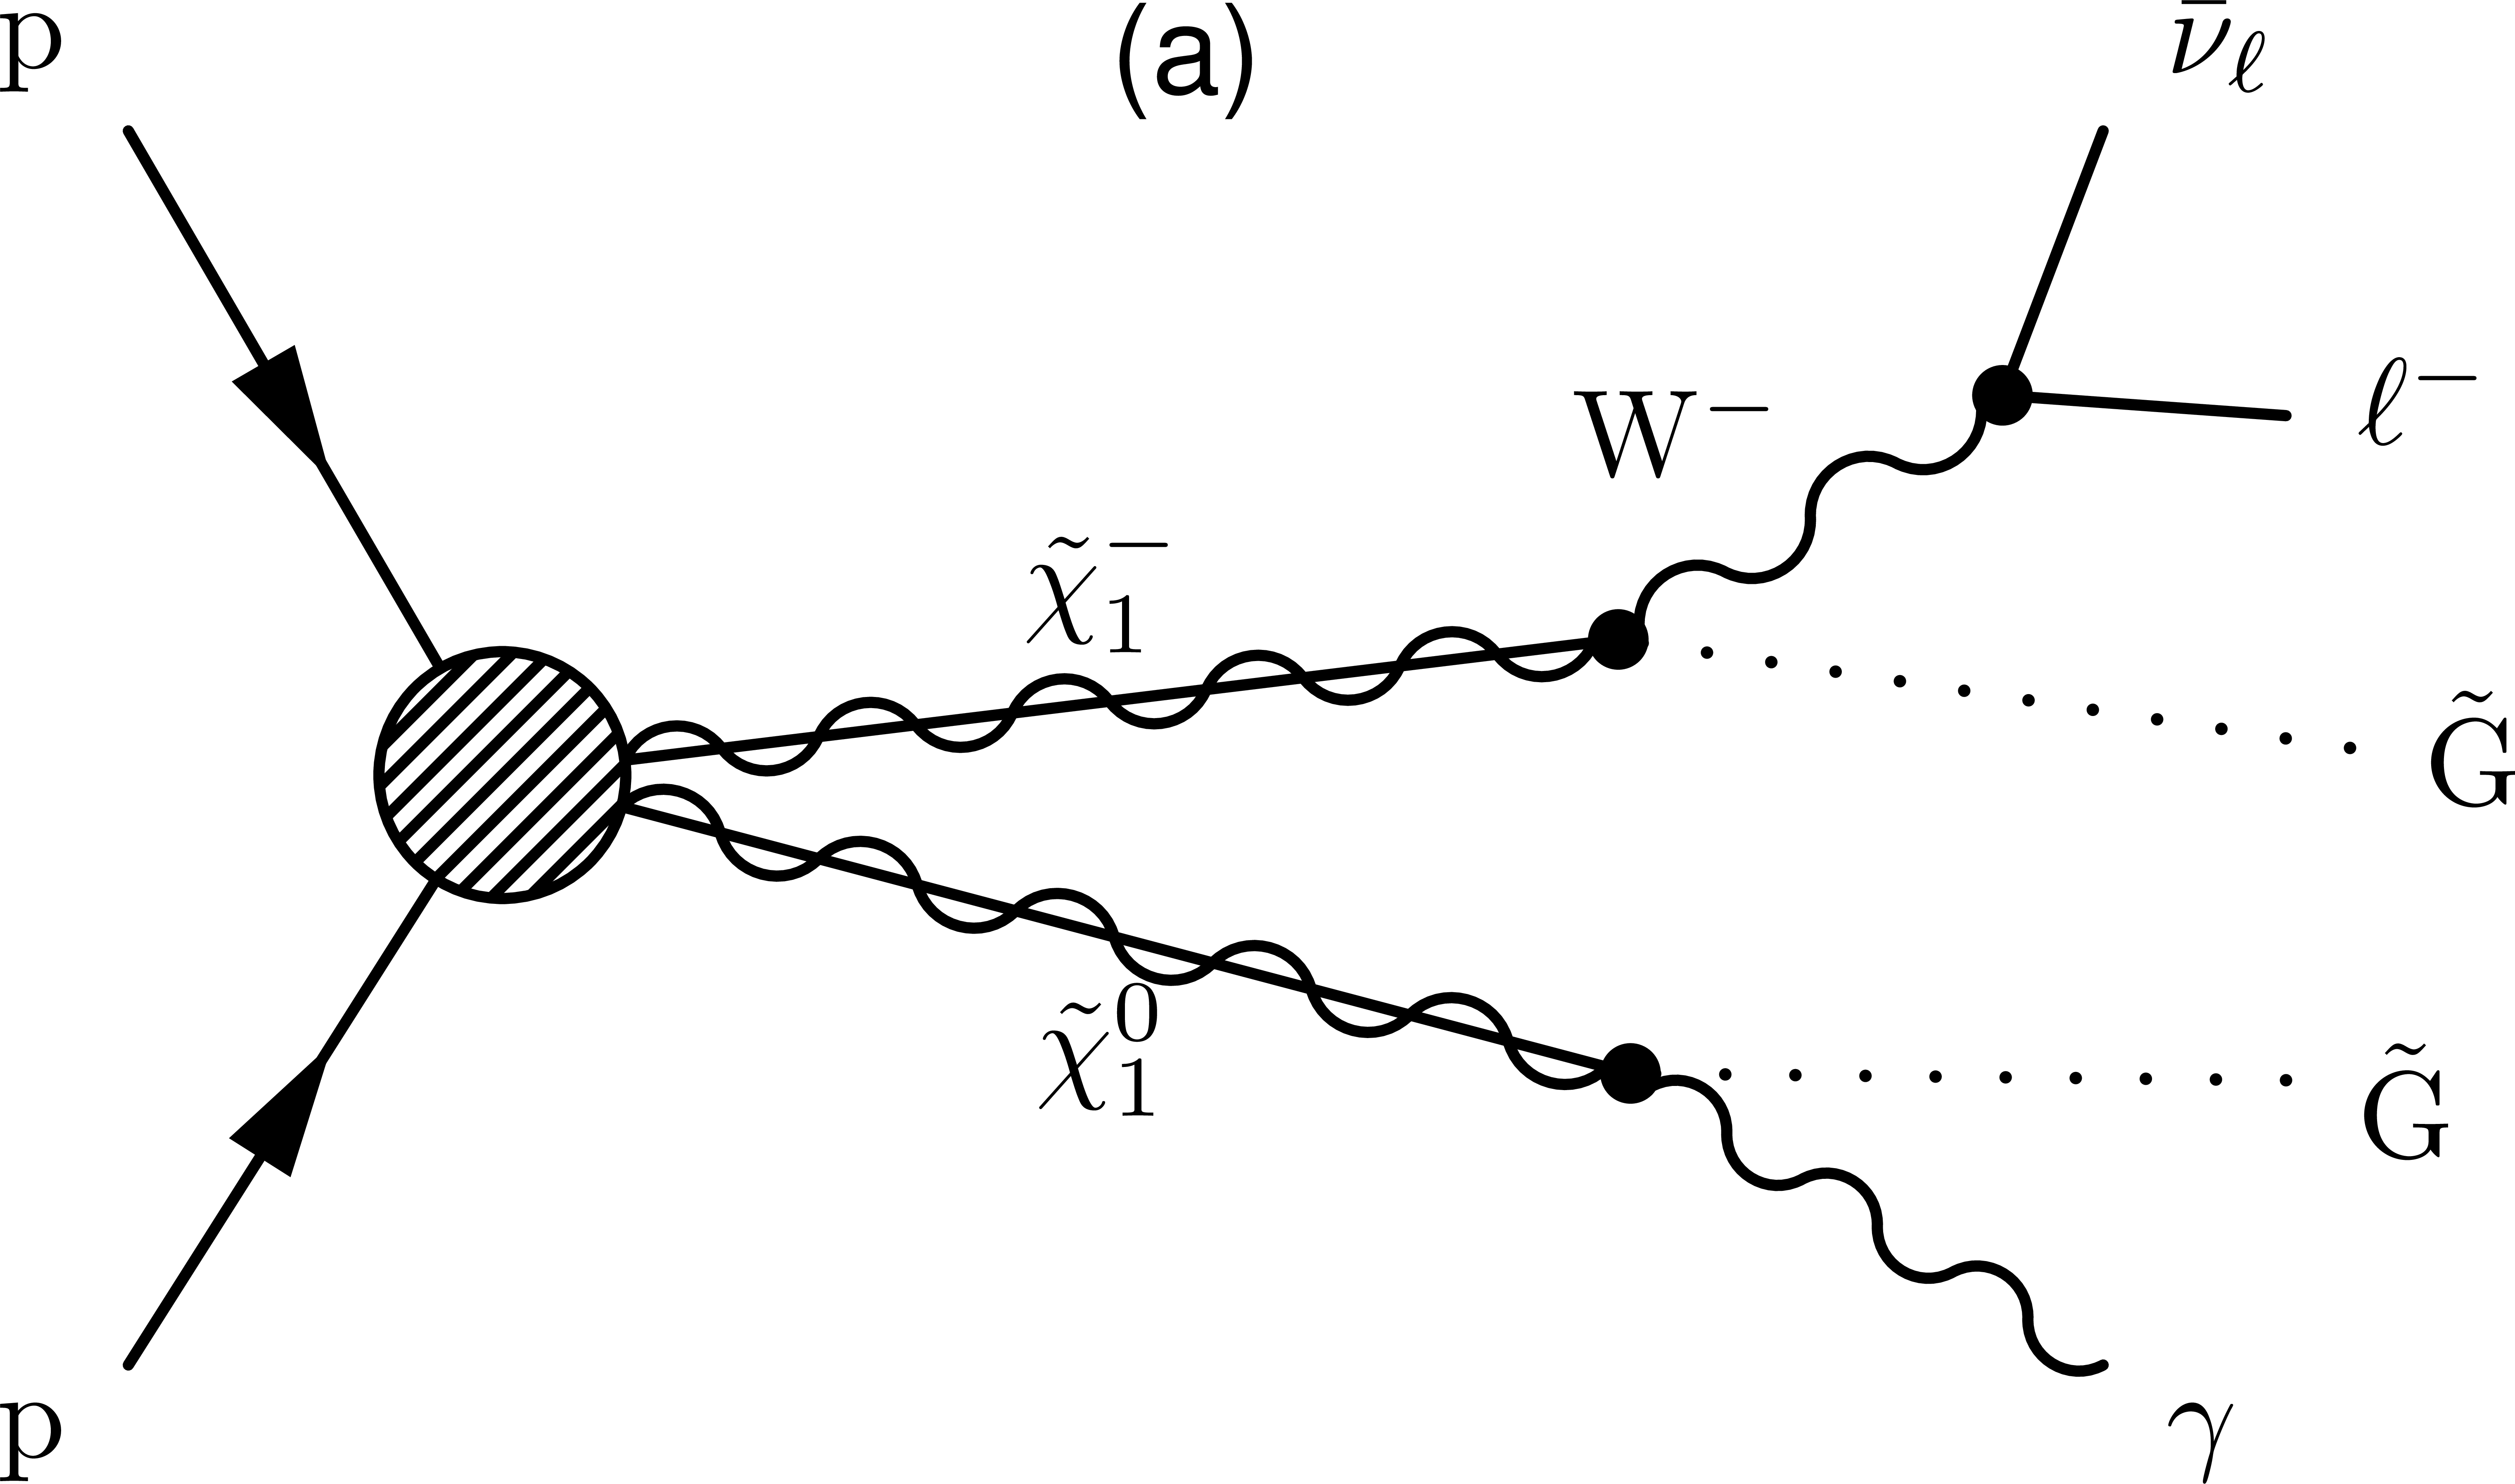
Figure 1-a:
Diagrams showing the production and decays of wino-like co-NLSPs ($ \tilde{\chi}^\pm _{1}$ and $\tilde{\chi}^{0}_{1}$) leading to final states with a photon, an electron or muon, and missing momentum from undetected gravitinos $ \mathrm { \tilde {G}} $ (a) without and (b) with involvement of coloured SUSY particles. |
png pdf |
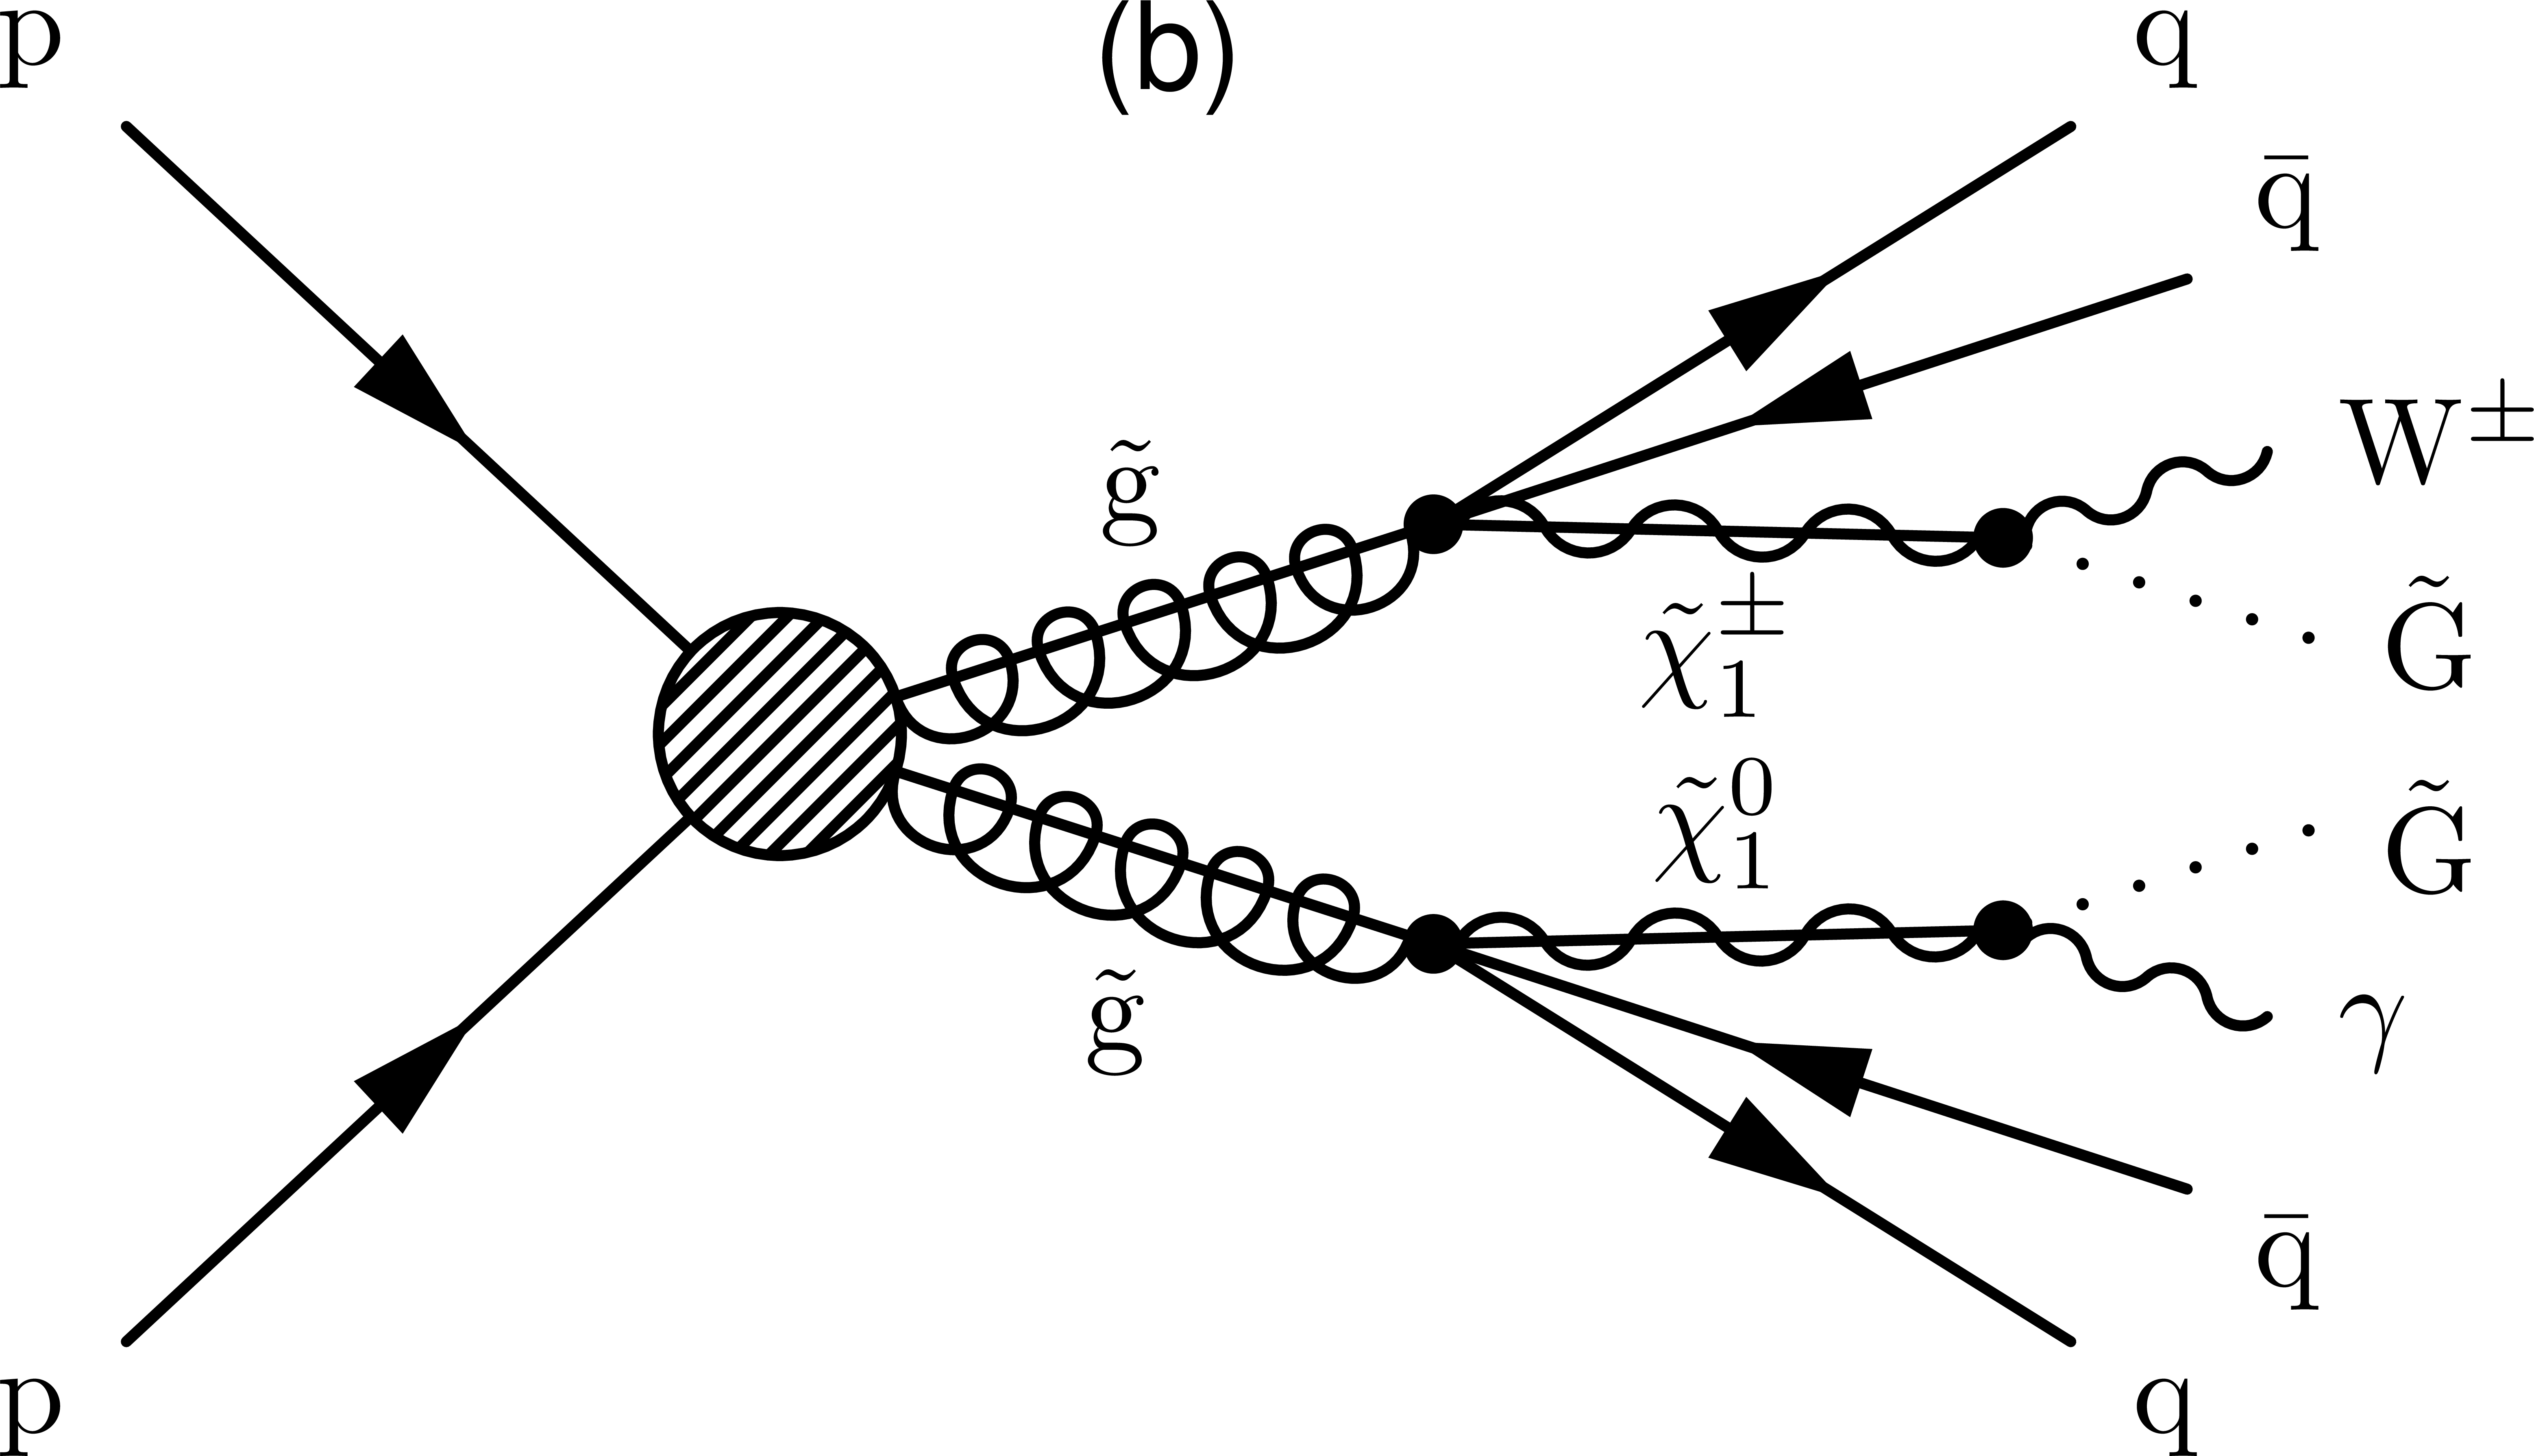
Figure 1-b:
Diagrams showing the production and decays of wino-like co-NLSPs ($ \tilde{\chi}^\pm _{1}$ and $\tilde{\chi}^{0}_{1}$) leading to final states with a photon, an electron or muon, and missing momentum from undetected gravitinos $ \mathrm { \tilde {G}} $ (a) without and (b) with involvement of coloured SUSY particles. |
png pdf |
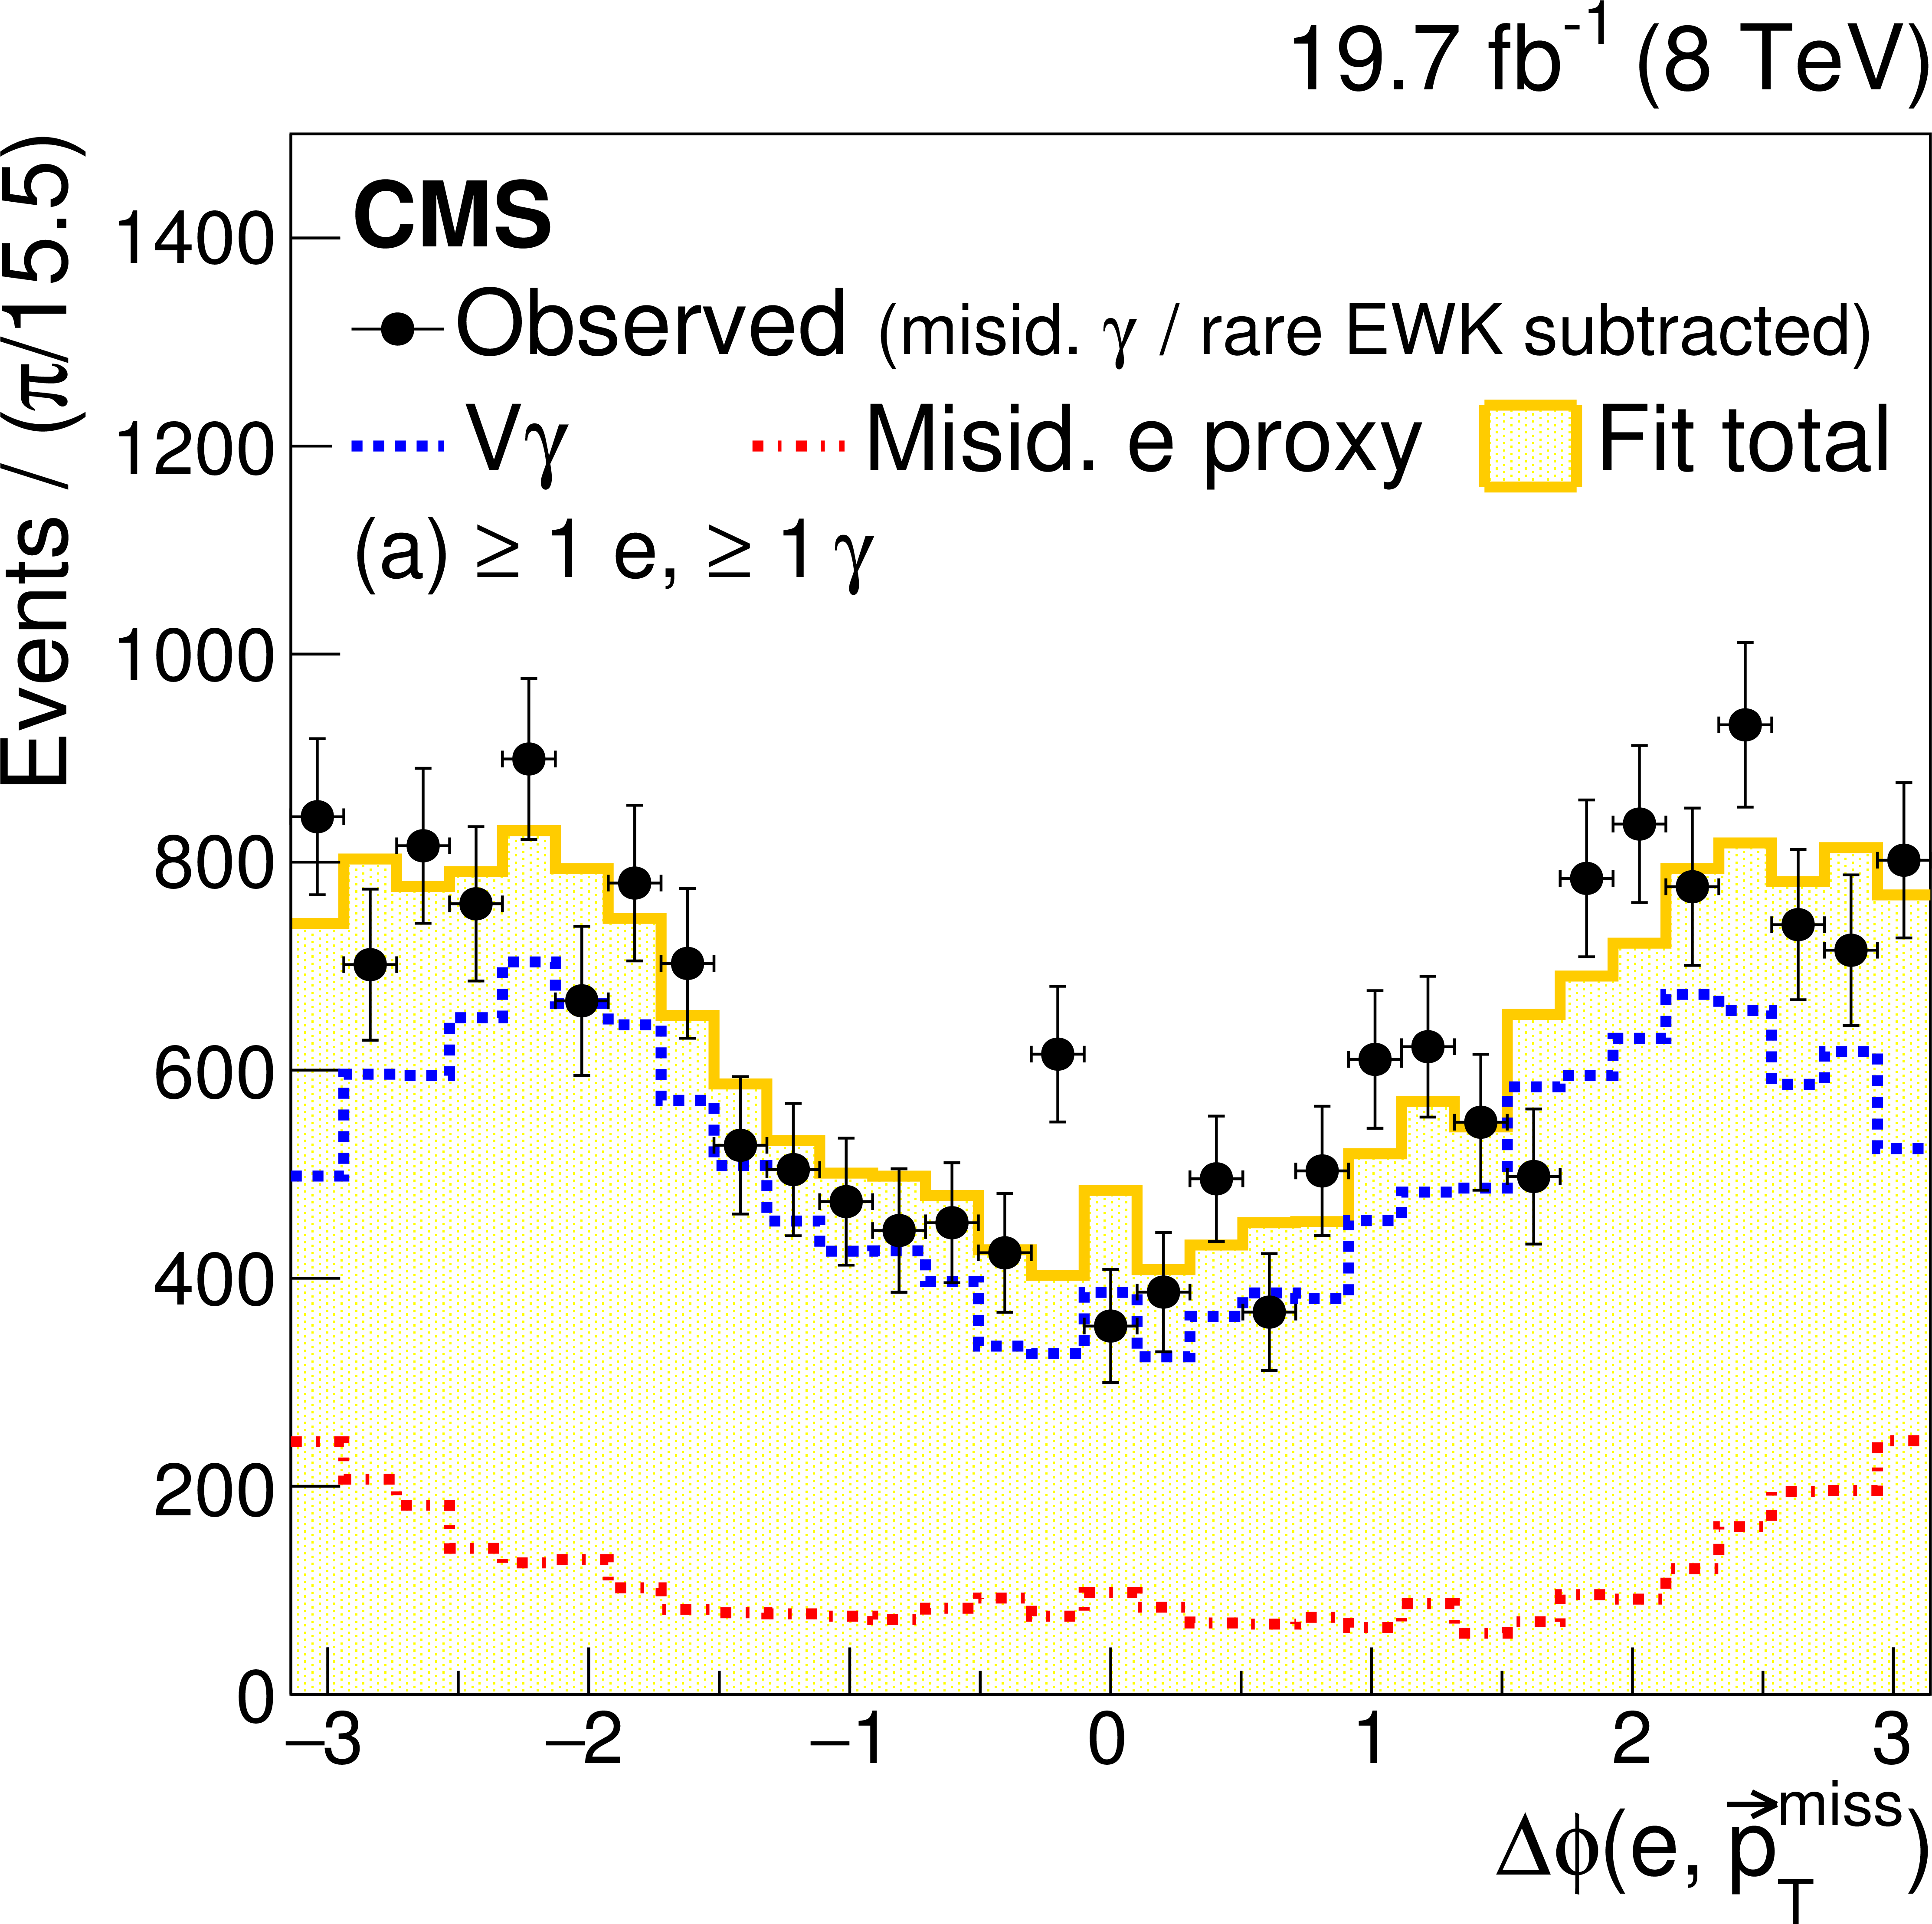
Figure 2-a:
Results of the $\Delta \phi (\ell , {\vec{p}_{\mathrm {T}}}^{\text {miss}} )$ template fit for events with 40 $< {E_{\mathrm {T}}^{\text {miss}}} <$ 70 GeV, used to determine the $\mathrm{V}\gamma $ and misidentified-lepton background for the (a) $ {\mathrm {e}} {\gamma }$ and (b) $ {{\mu }} {\gamma }$ channels. |
png pdf |
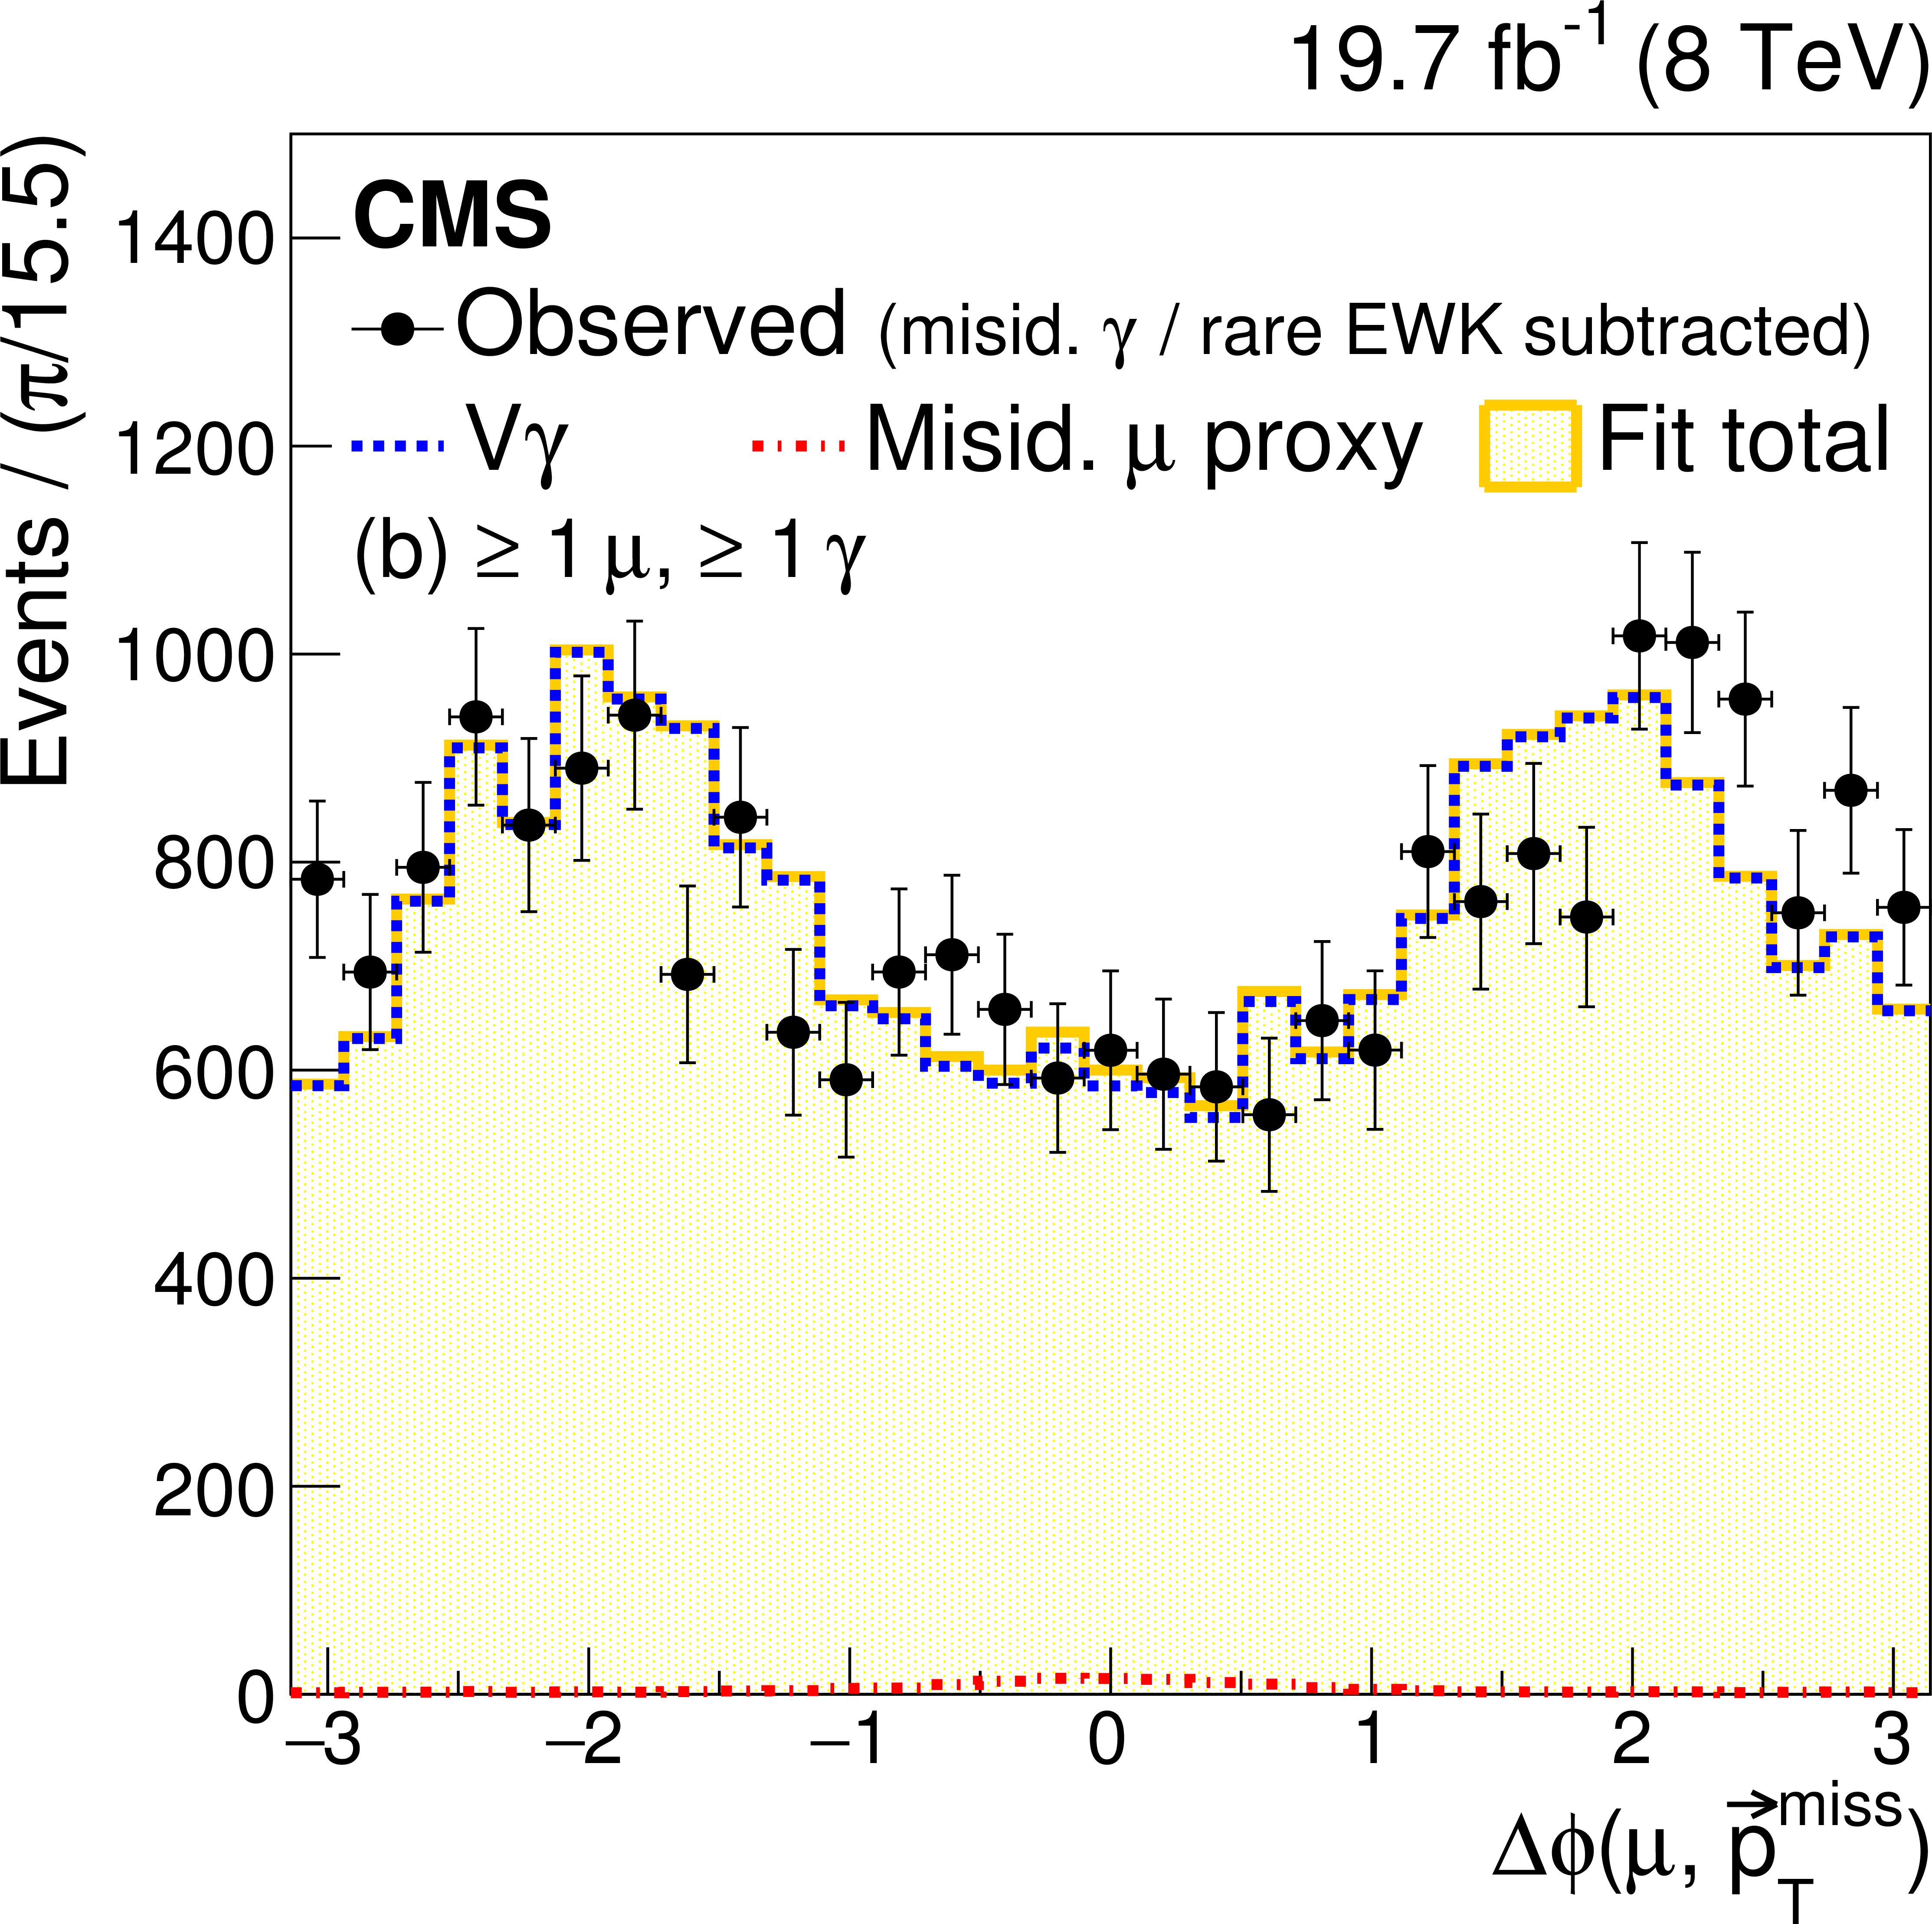
Figure 2-b:
Results of the $\Delta \phi (\ell , {\vec{p}_{\mathrm {T}}}^{\text {miss}} )$ template fit for events with 40 $< {E_{\mathrm {T}}^{\text {miss}}} <$ 70 GeV, used to determine the $\mathrm{V}\gamma $ and misidentified-lepton background for the (a) $ {\mathrm {e}} {\gamma }$ and (b) $ {{\mu }} {\gamma }$ channels. |
png pdf |
Figure 3-a:
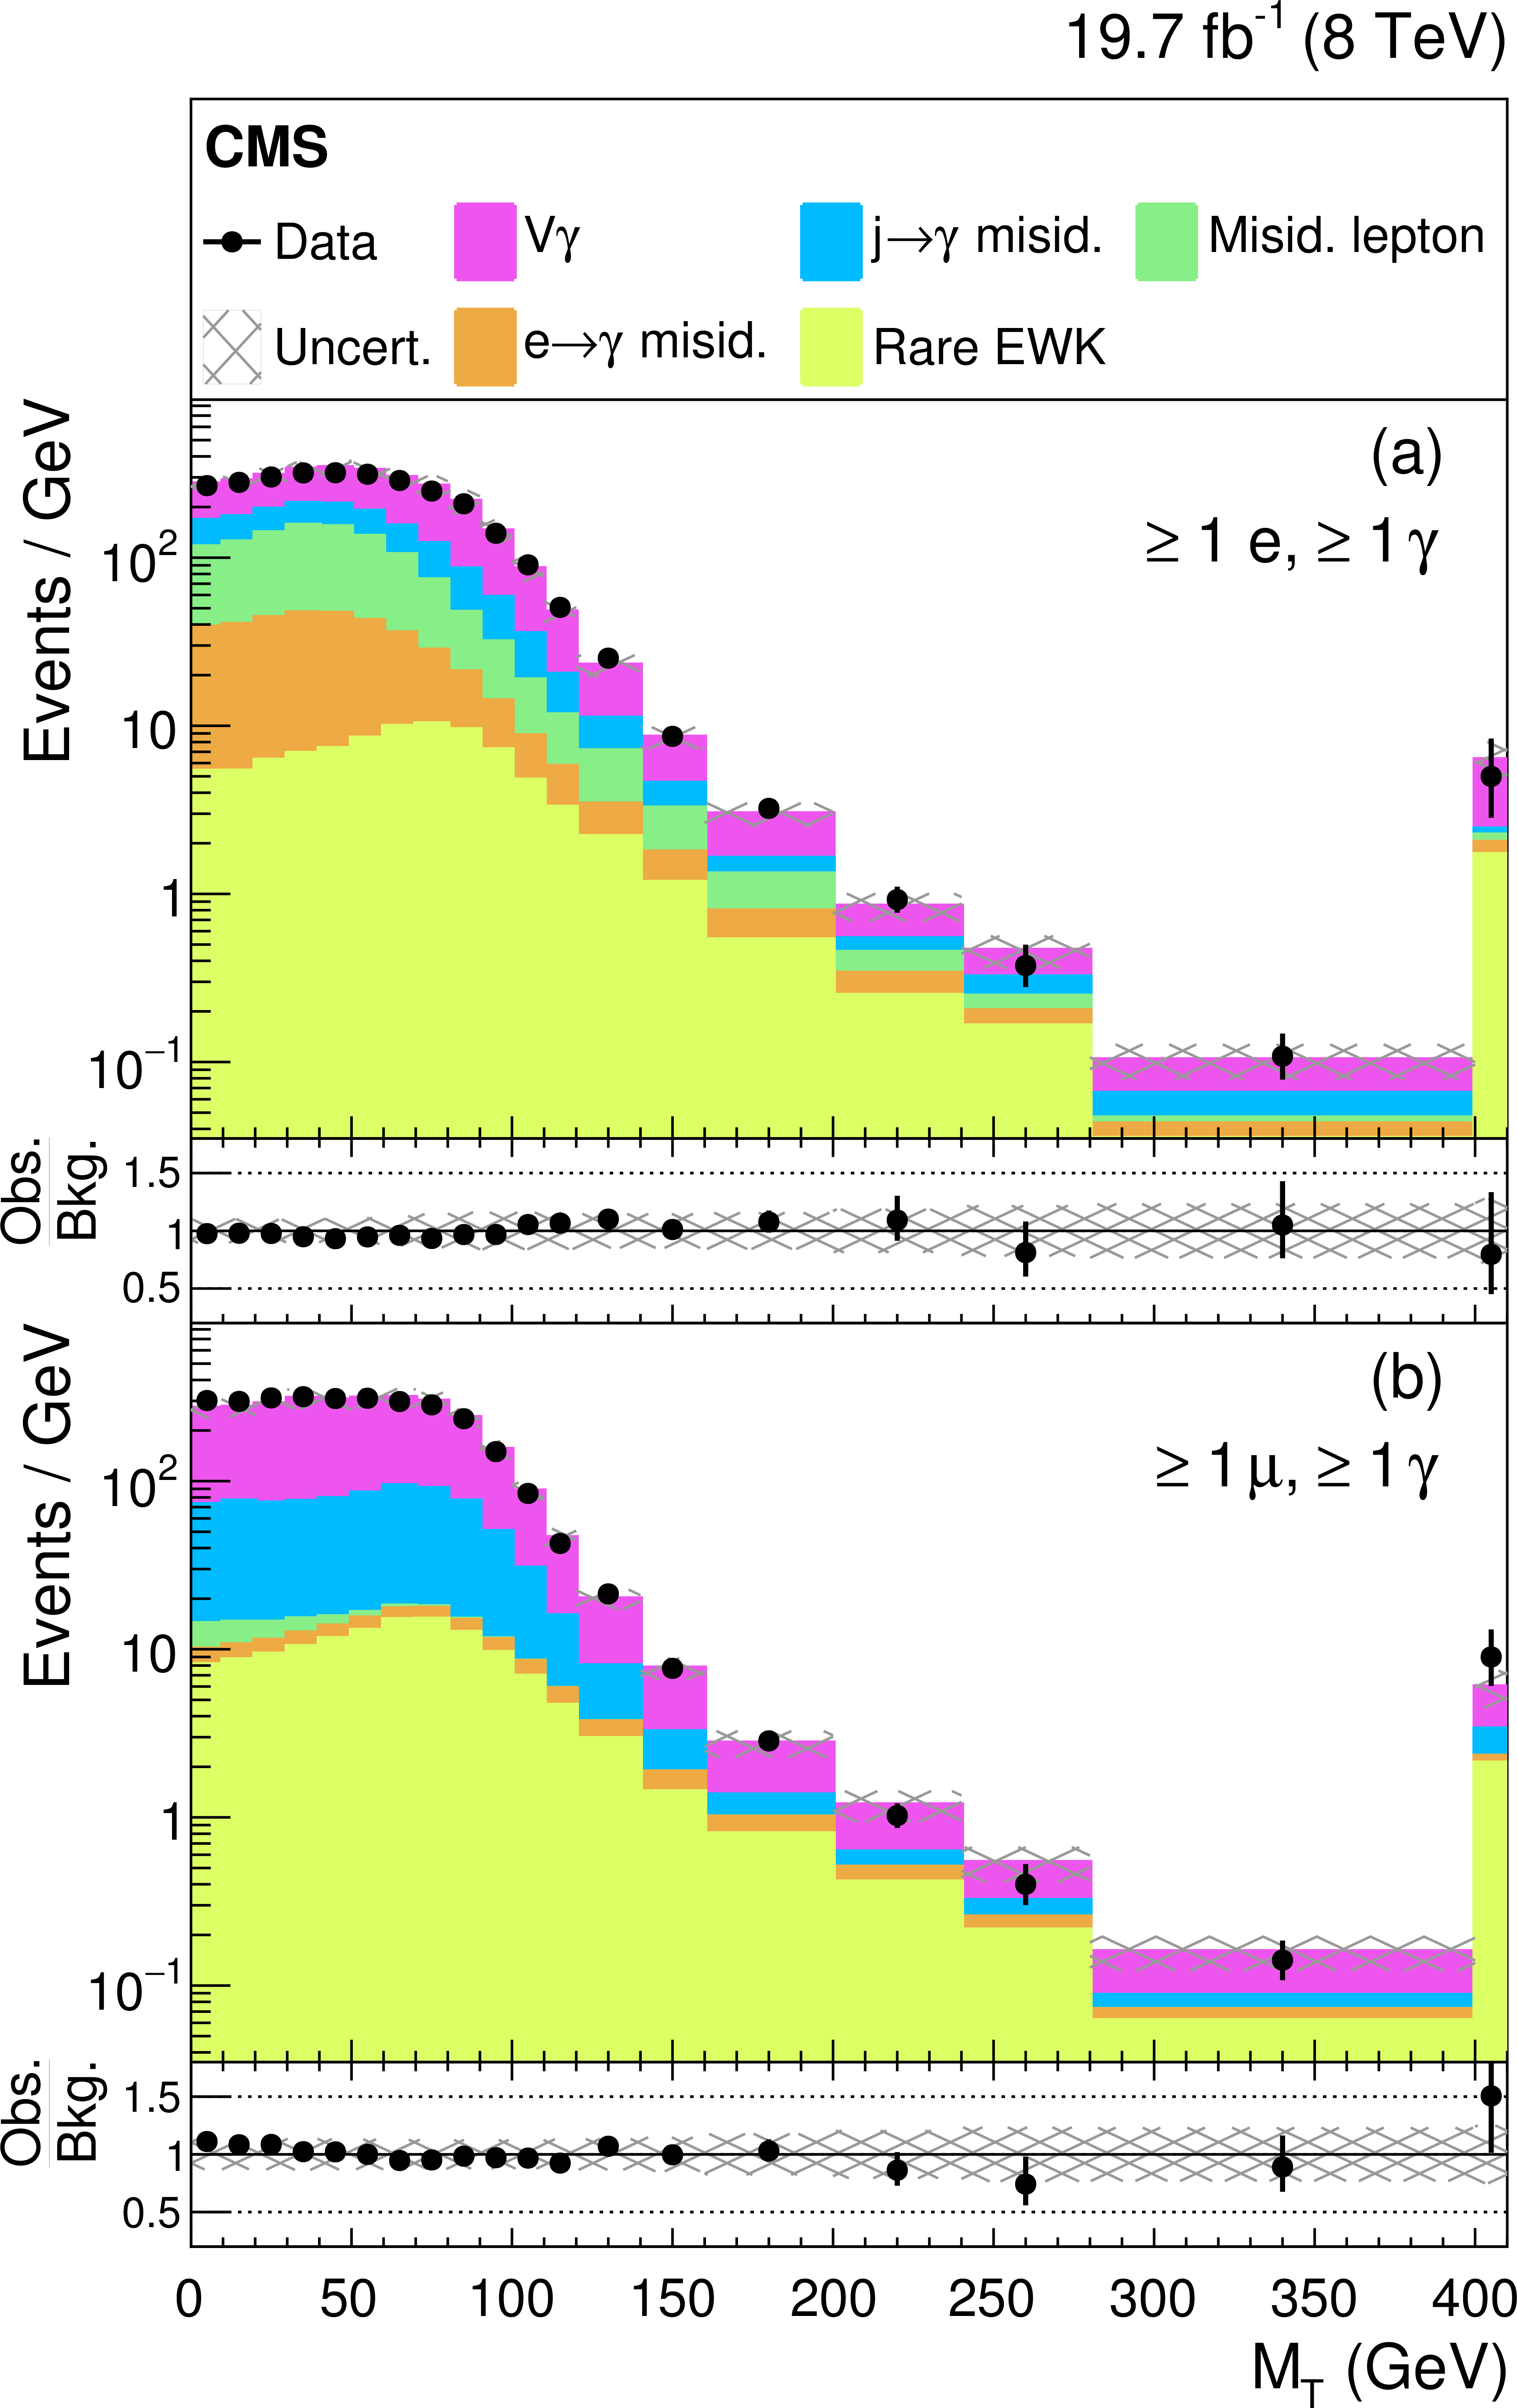
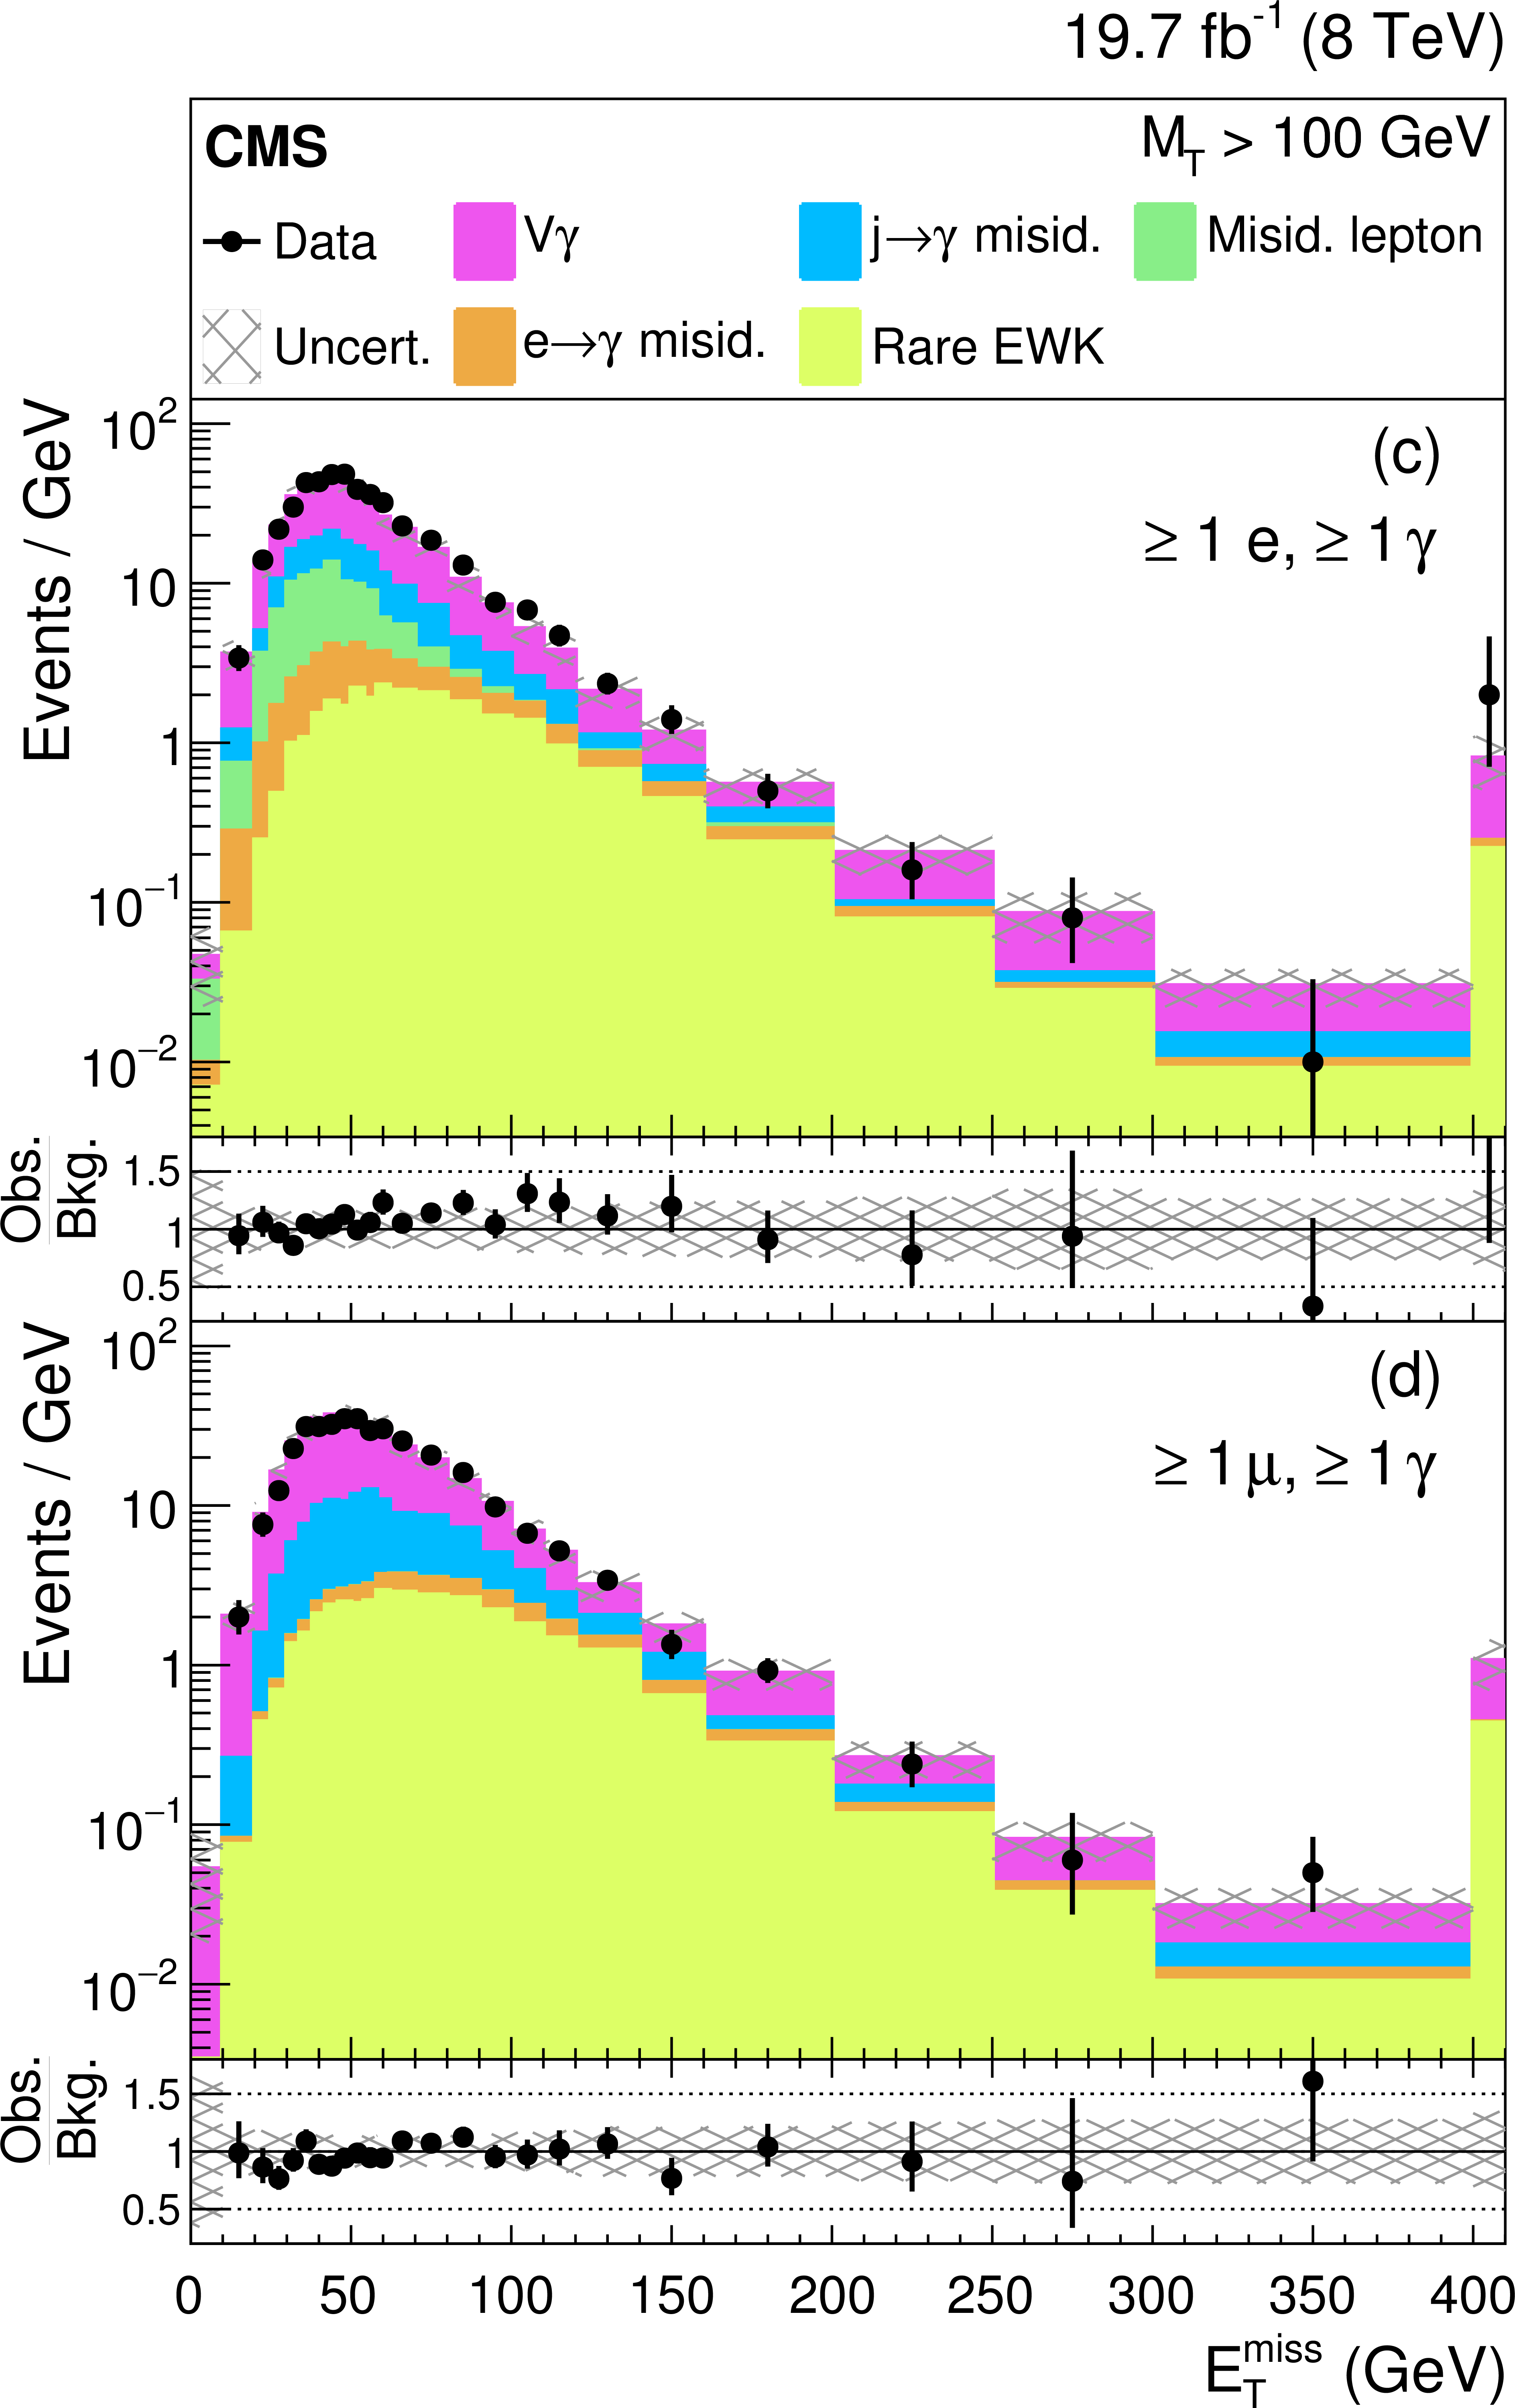
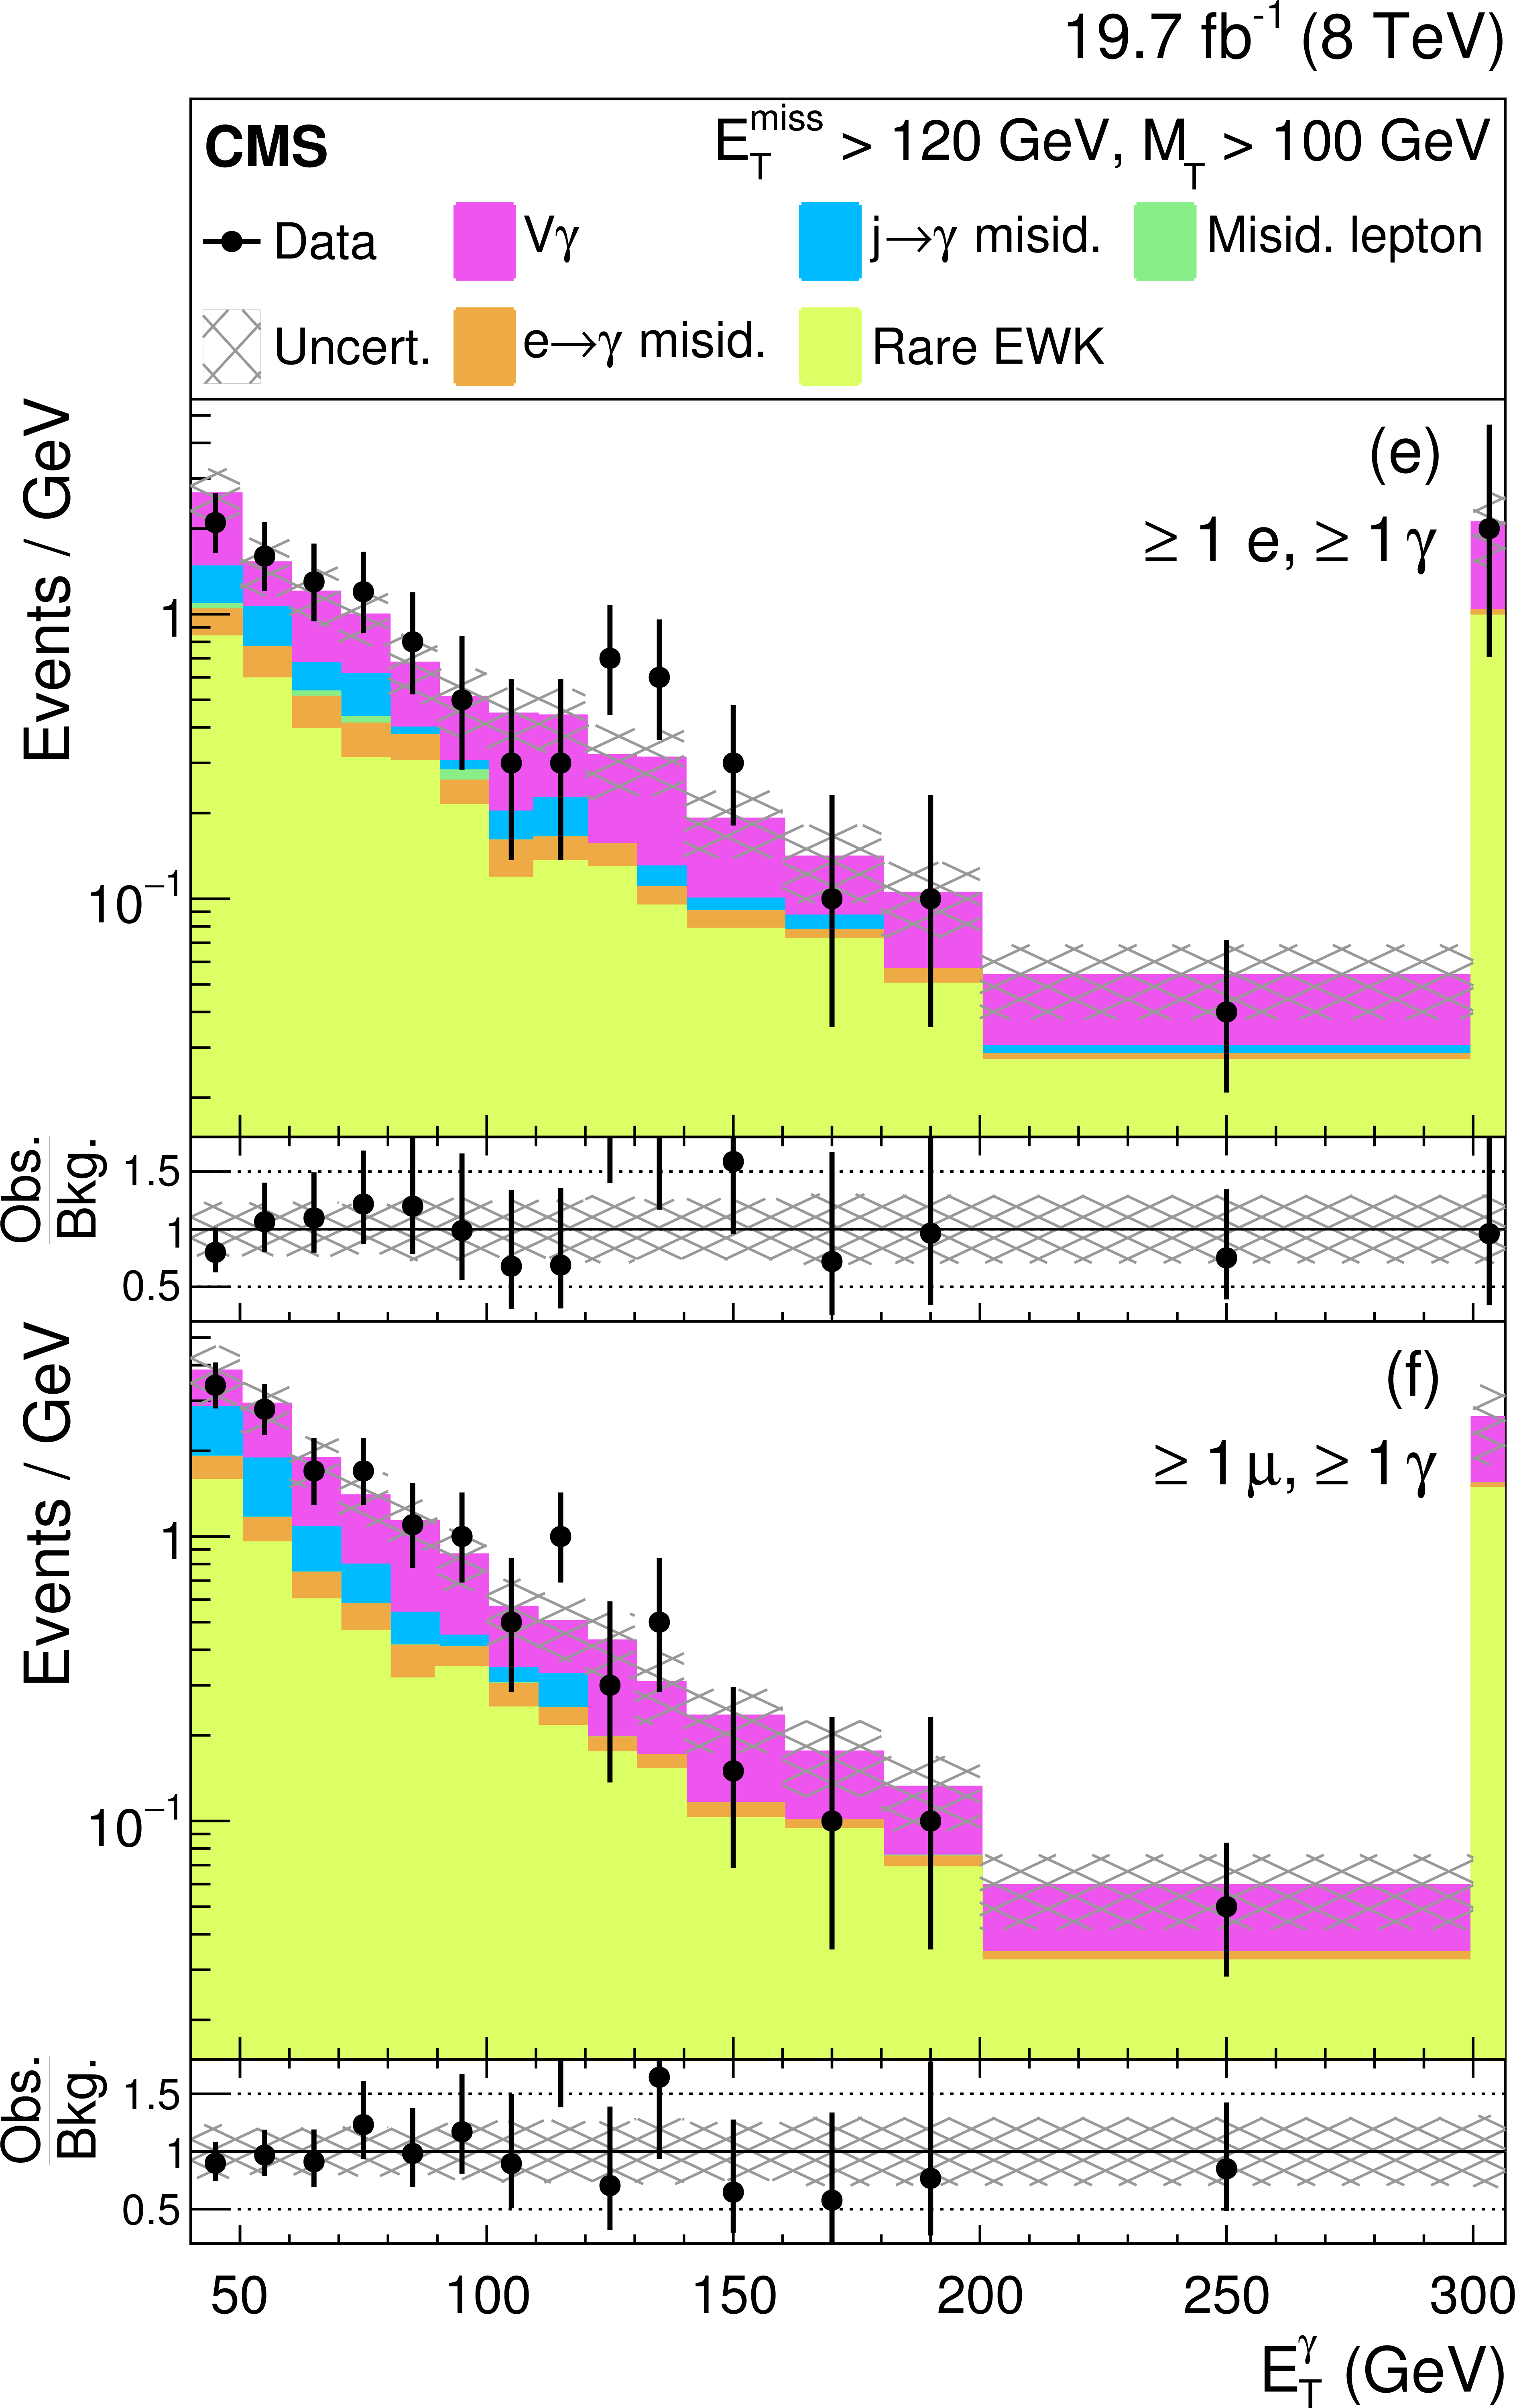
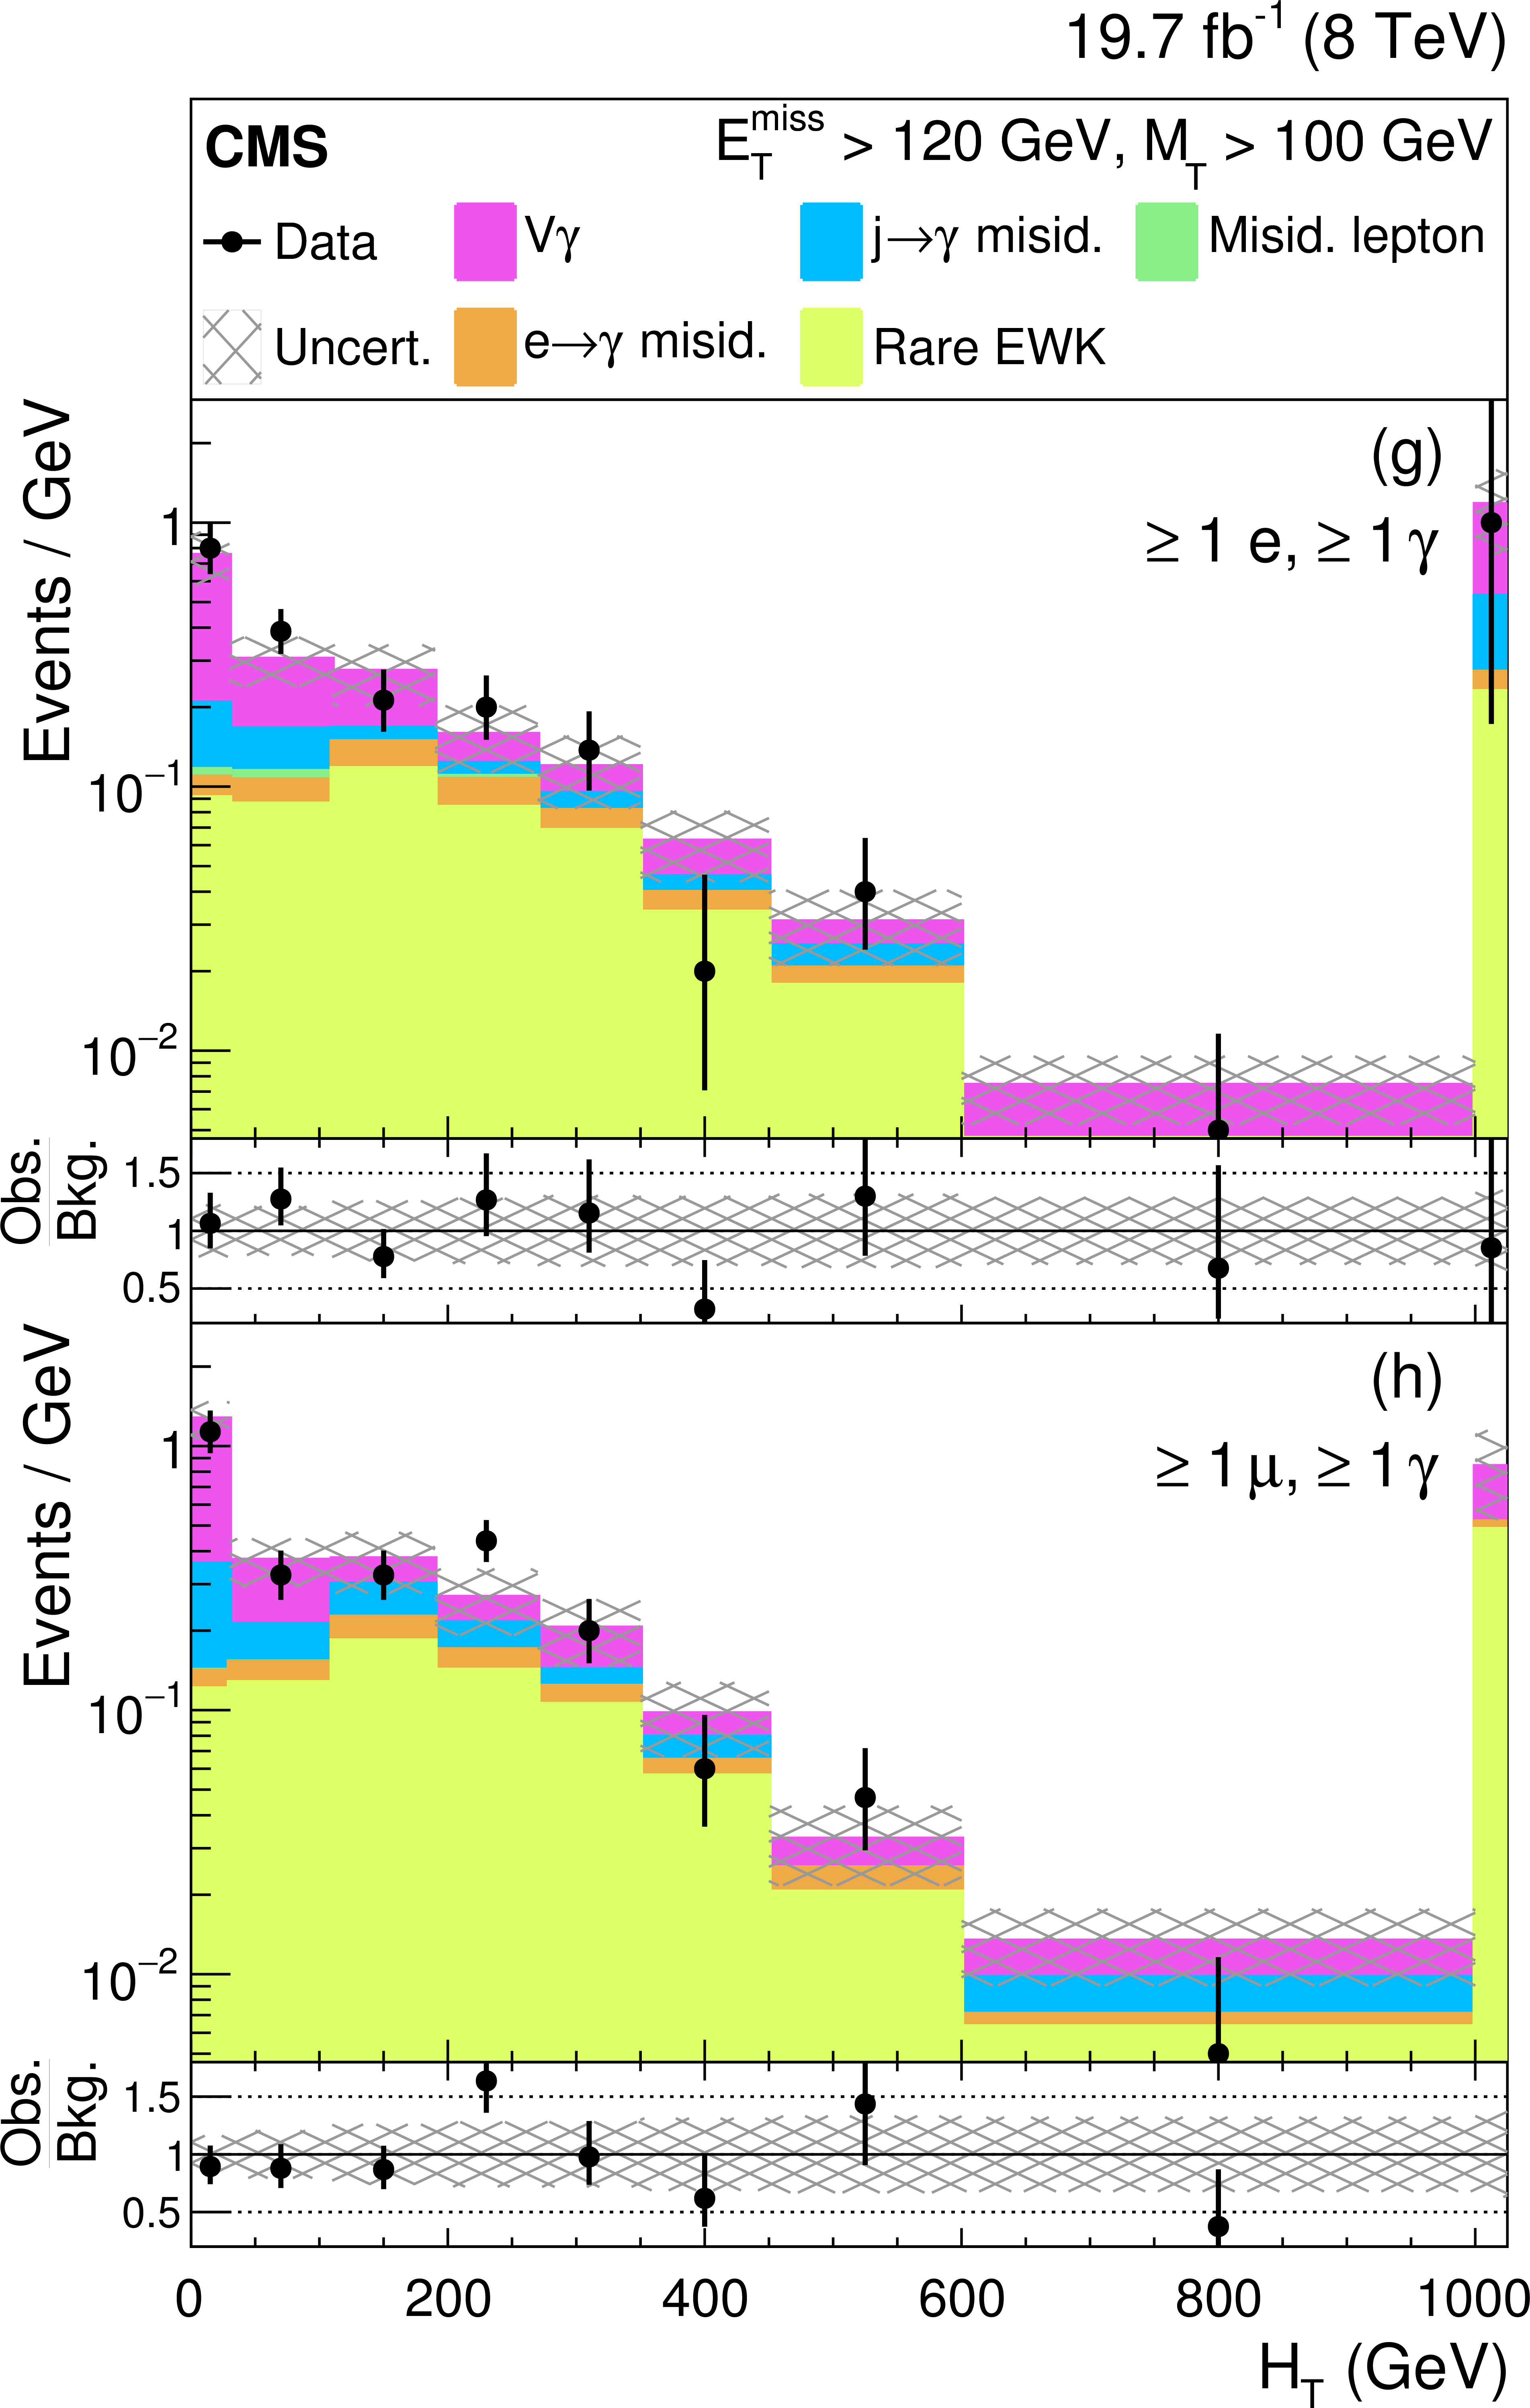
Distributions of (a, b) $ {M_{\mathrm {T}}} $, (c, d) $ {E_{\mathrm {T}}^{\text {miss}}} $, (e, f) $ {E_{\mathrm {T}}} ^{ {\gamma }}$, and (g, h) $ {H_{\mathrm {T}}} $ compared with the stacked background expectations. The upper and lower halves of each panel show the $ {\mathrm {e}} {\gamma }$ and $ {{\mu }} {\gamma }$ channels, respectively. The rightmost bin of each plot shows the overflow, with contents that are not normalized by the bin width. The lower part of each panel shows the ratio of the data to the predicted background. The uncertainty bands represent the statistical and systematic terms added in quadrature. |
png pdf |
Figure 3-b:
Distributions of (a, b) $ {M_{\mathrm {T}}} $, (c, d) $ {E_{\mathrm {T}}^{\text {miss}}} $, (e, f) $ {E_{\mathrm {T}}} ^{ {\gamma }}$, and (g, h) $ {H_{\mathrm {T}}} $ compared with the stacked background expectations. The upper and lower halves of each panel show the $ {\mathrm {e}} {\gamma }$ and $ {{\mu }} {\gamma }$ channels, respectively. The rightmost bin of each plot shows the overflow, with contents that are not normalized by the bin width. The lower part of each panel shows the ratio of the data to the predicted background. The uncertainty bands represent the statistical and systematic terms added in quadrature. |
png pdf |
Figure 3-c:
Distributions of (a, b) $ {M_{\mathrm {T}}} $, (c, d) $ {E_{\mathrm {T}}^{\text {miss}}} $, (e, f) $ {E_{\mathrm {T}}} ^{ {\gamma }}$, and (g, h) $ {H_{\mathrm {T}}} $ compared with the stacked background expectations. The upper and lower halves of each panel show the $ {\mathrm {e}} {\gamma }$ and $ {{\mu }} {\gamma }$ channels, respectively. The rightmost bin of each plot shows the overflow, with contents that are not normalized by the bin width. The lower part of each panel shows the ratio of the data to the predicted background. The uncertainty bands represent the statistical and systematic terms added in quadrature. |
png pdf |
Figure 3-d:
Distributions of (a, b) $ {M_{\mathrm {T}}} $, (c, d) $ {E_{\mathrm {T}}^{\text {miss}}} $, (e, f) $ {E_{\mathrm {T}}} ^{ {\gamma }}$, and (g, h) $ {H_{\mathrm {T}}} $ compared with the stacked background expectations. The upper and lower halves of each panel show the $ {\mathrm {e}} {\gamma }$ and $ {{\mu }} {\gamma }$ channels, respectively. The rightmost bin of each plot shows the overflow, with contents that are not normalized by the bin width. The lower part of each panel shows the ratio of the data to the predicted background. The uncertainty bands represent the statistical and systematic terms added in quadrature. |
png pdf |
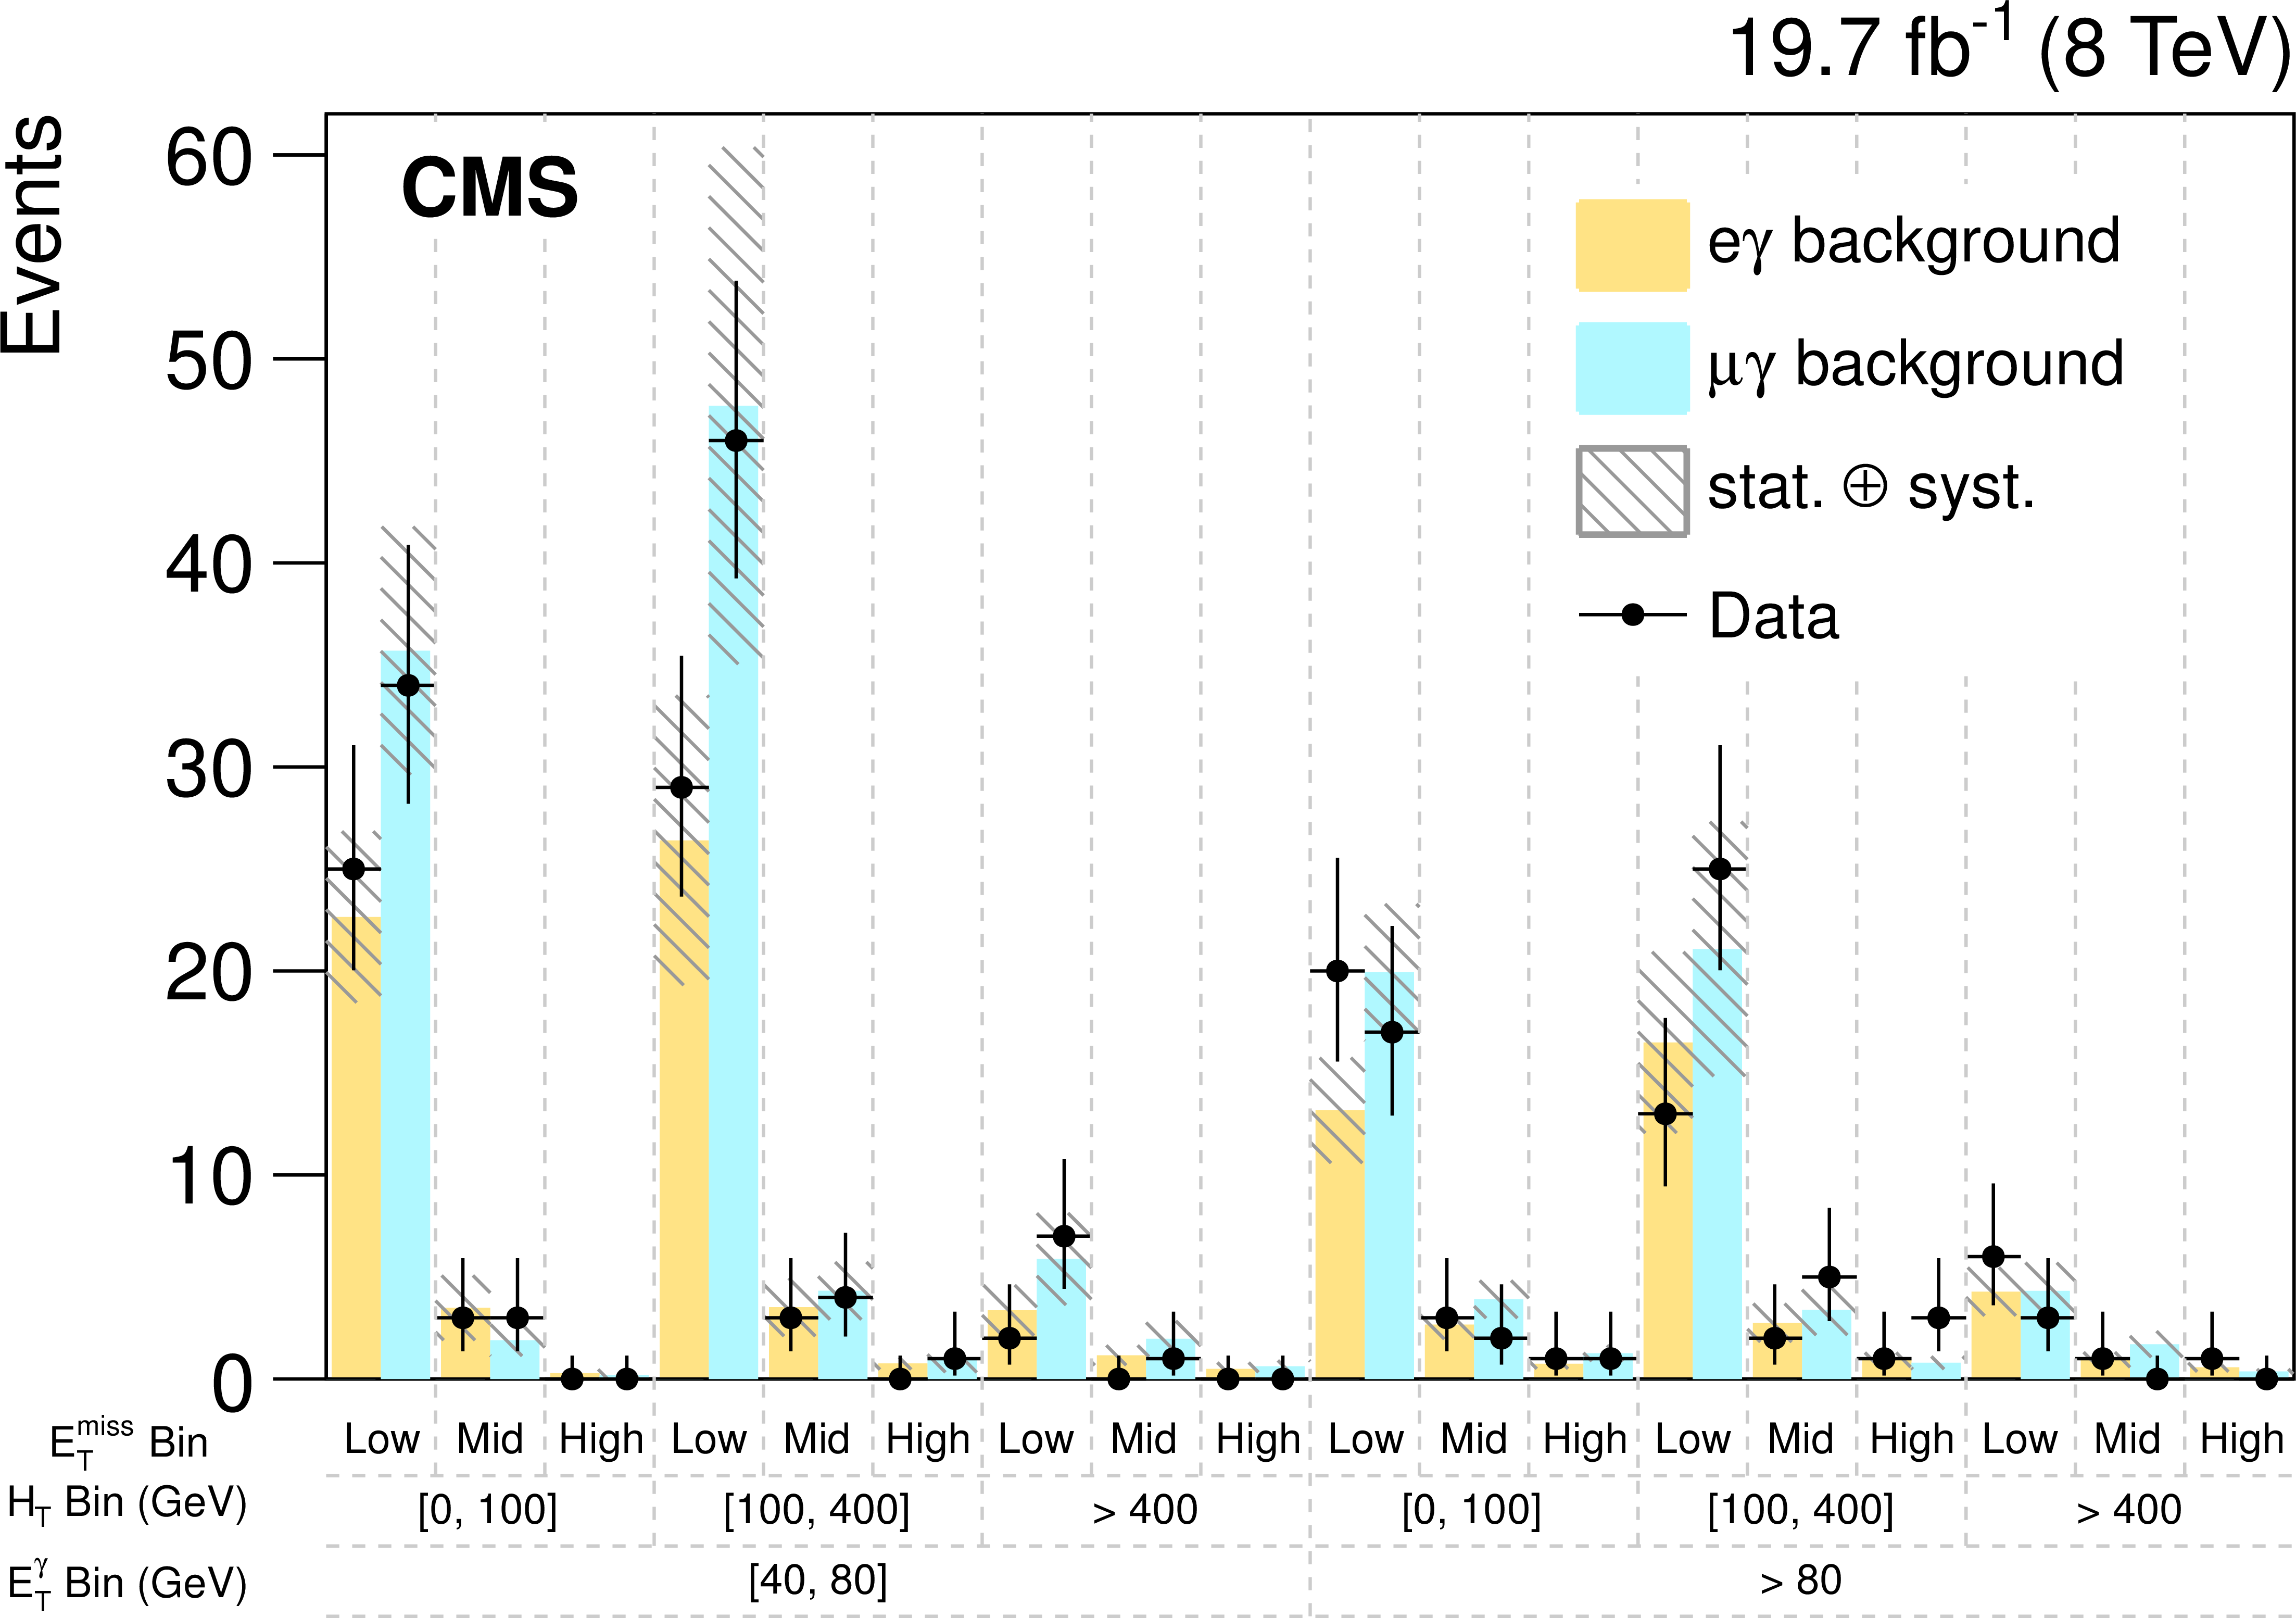
Figure 4:
Event yields in all signal region bins, compared with the combined SM background predictions. The numbers in brackets indicate the range of the bins in the signal region variables $ {E_{\mathrm {T}}^{\text {miss}}} $, $ {H_{\mathrm {T}}} $, and $ {E_{\mathrm {T}}} ^{ {\gamma }}$. For the ${E_{\mathrm {T}}^{\text {miss}}} $ bins, Low, Mid, and High correspond to the intervals $[120,200]$, $[200,300]$, and ${>}300 GeV $, respectively. |
png pdf |
Figure 5:
Observed and expected 95% confidence level upper limits on the cross section and corresponding exclusion limits for the GMSB model. |
png pdf |
Figure 6-a:
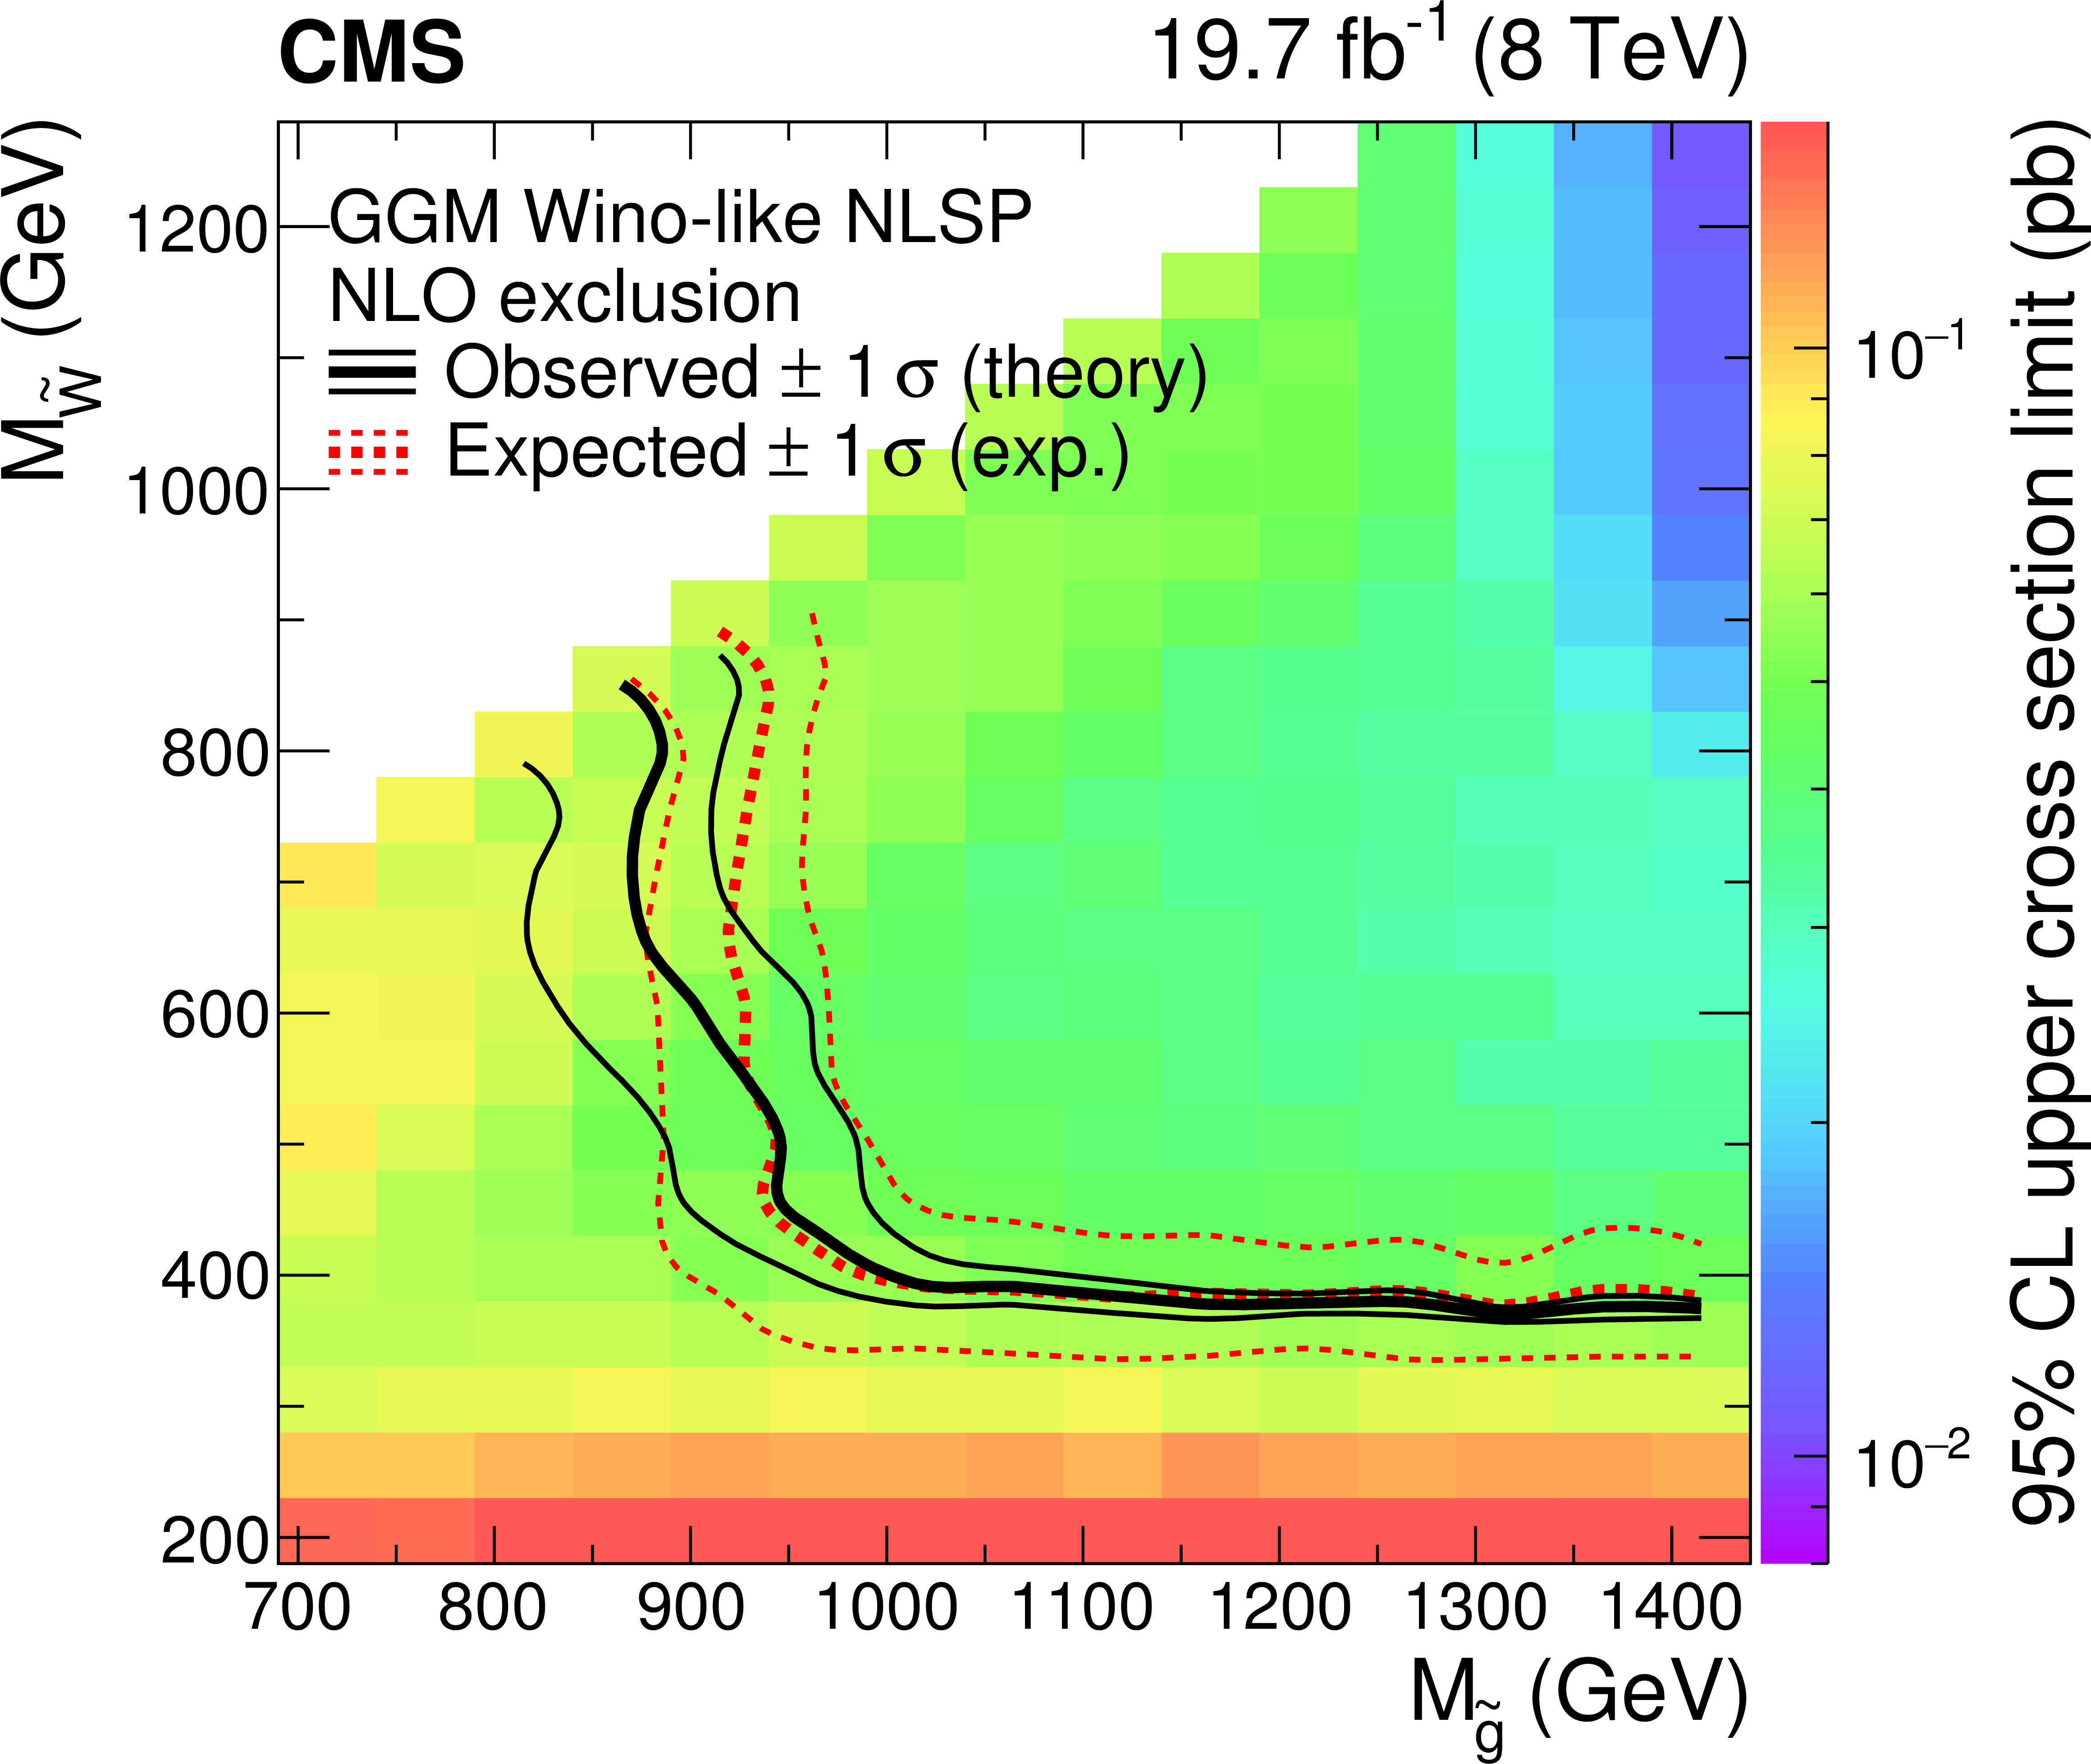
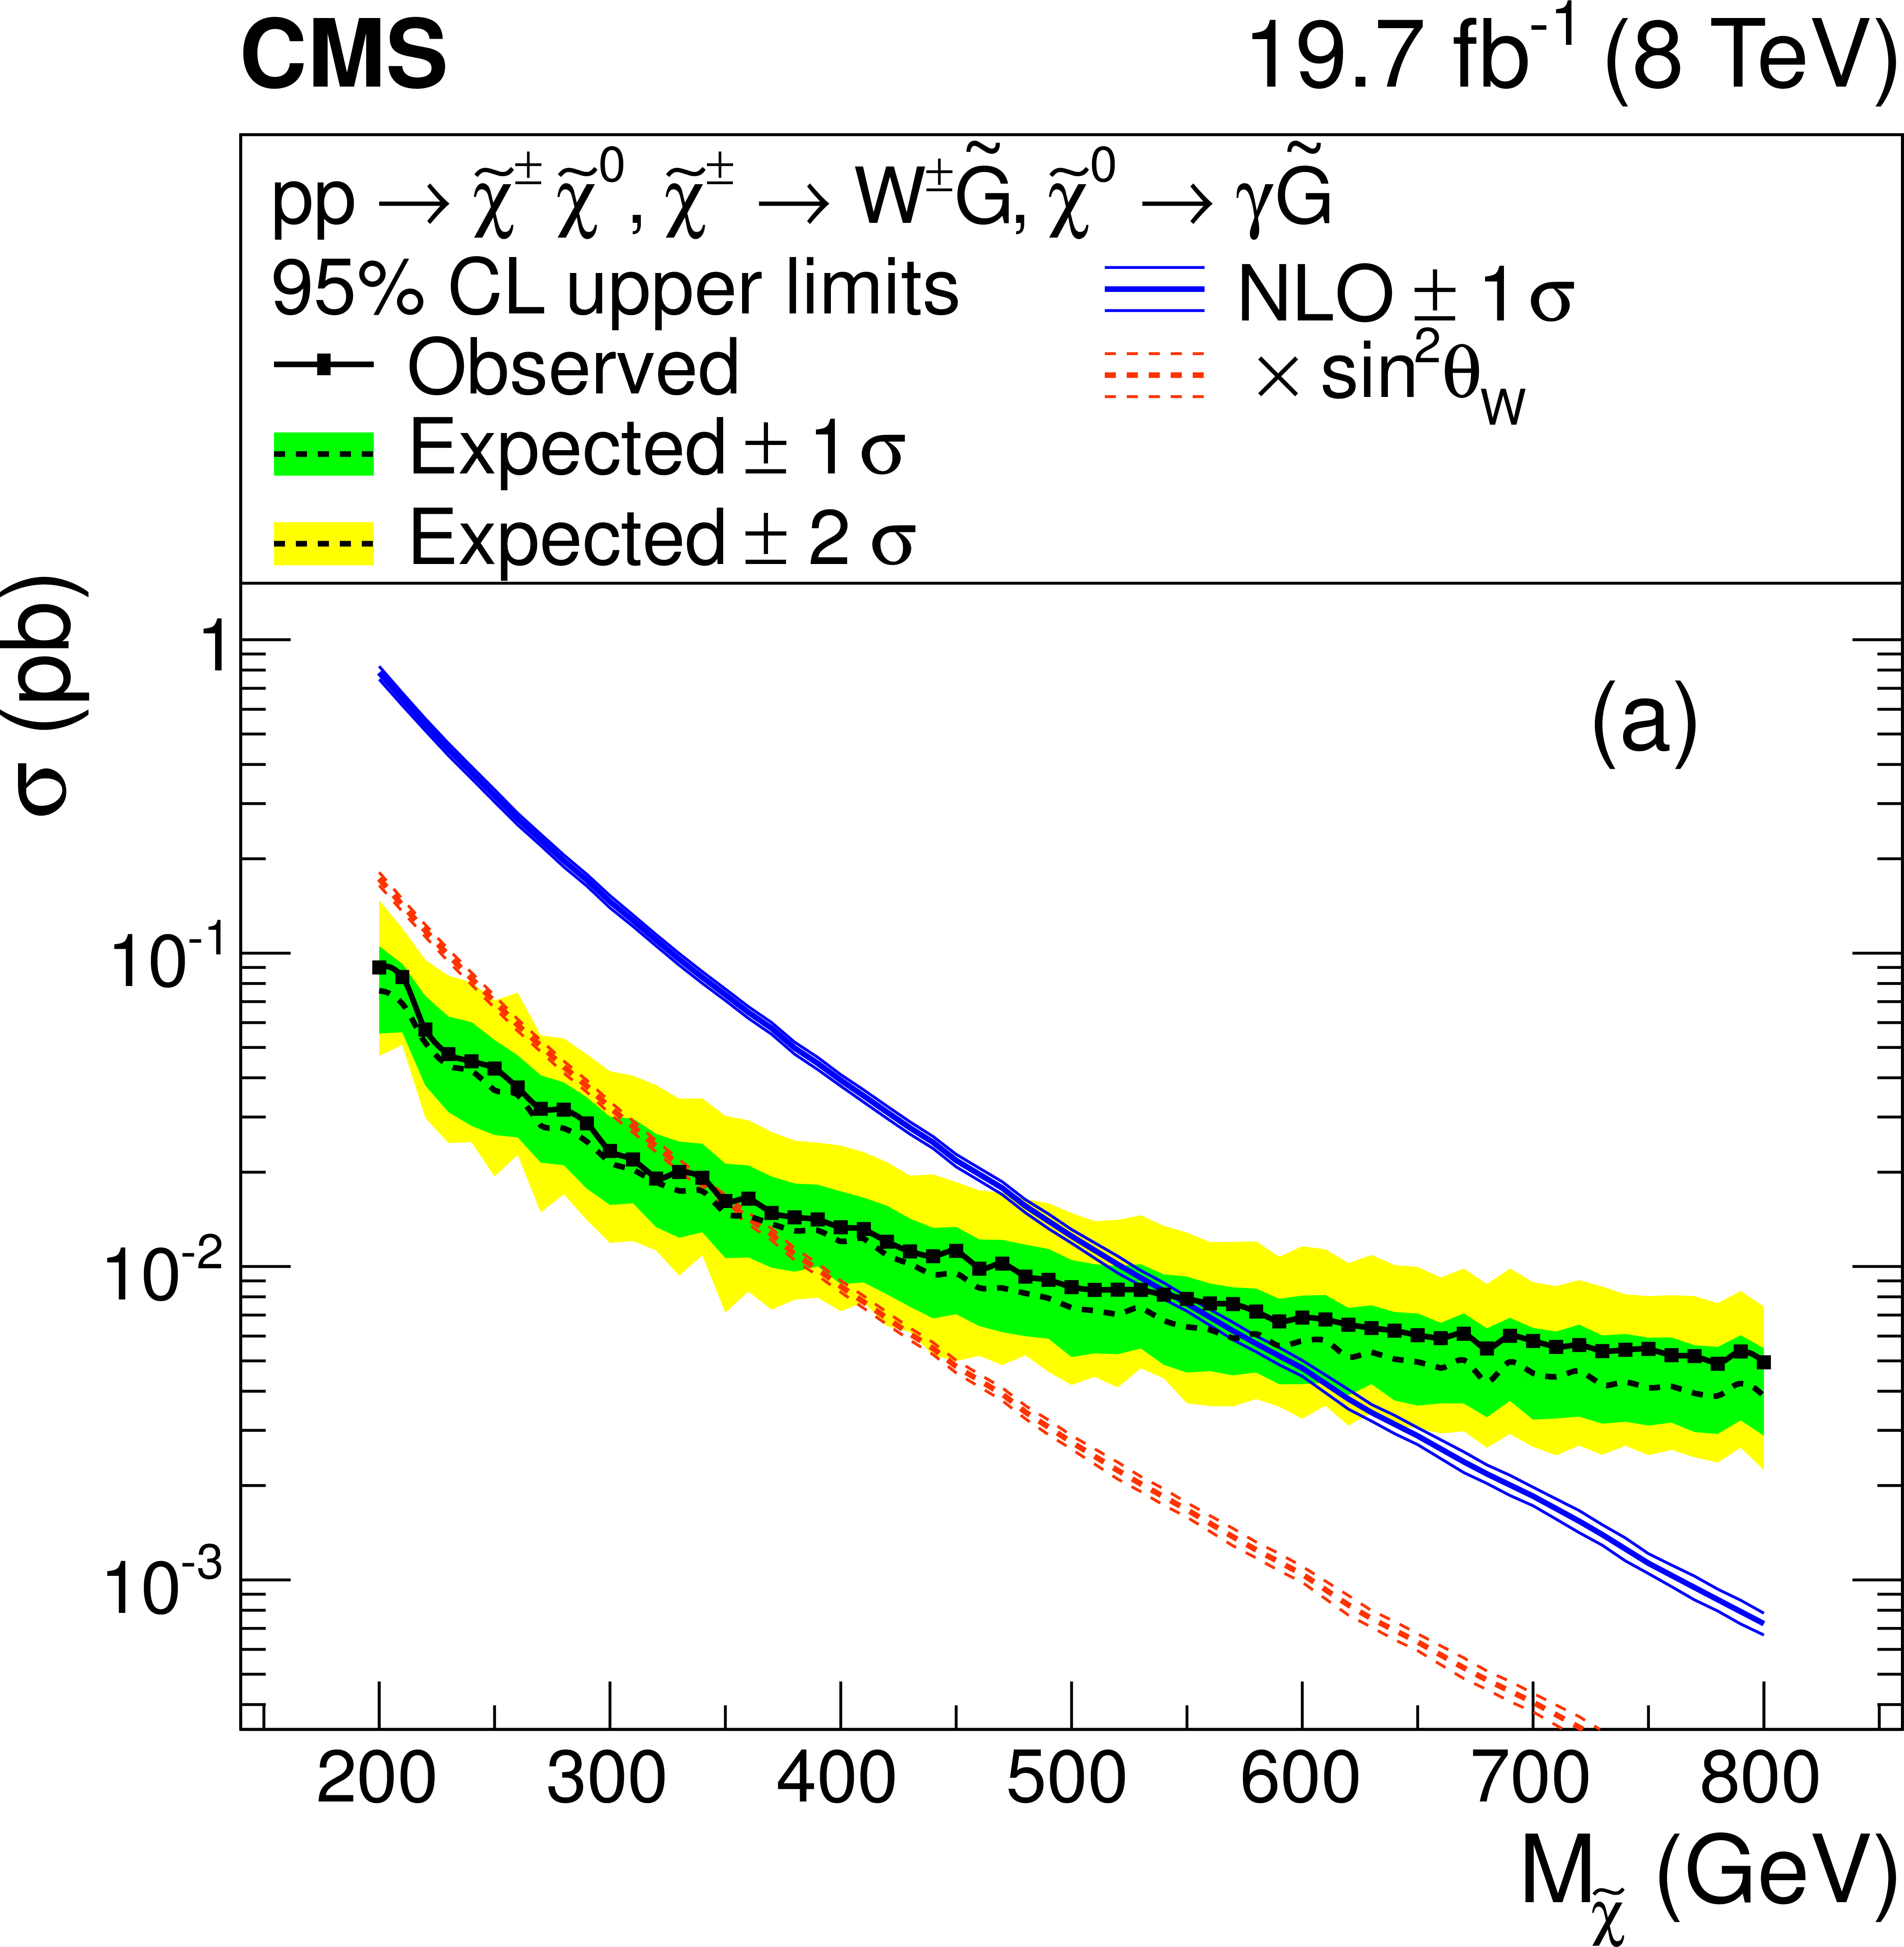
Observed and expected 95% confidence level upper limits on the (a) TChiWg and (b) T5Wg simplified models. For the T5Wg model, the 95% confidence level exclusion contour is also shown. |

png pdf |
Figure 6-b:
Observed and expected 95% confidence level upper limits on the (a) TChiWg and (b) T5Wg simplified models. For the T5Wg model, the 95% confidence level exclusion contour is also shown. |
| Tables | |
png pdf |
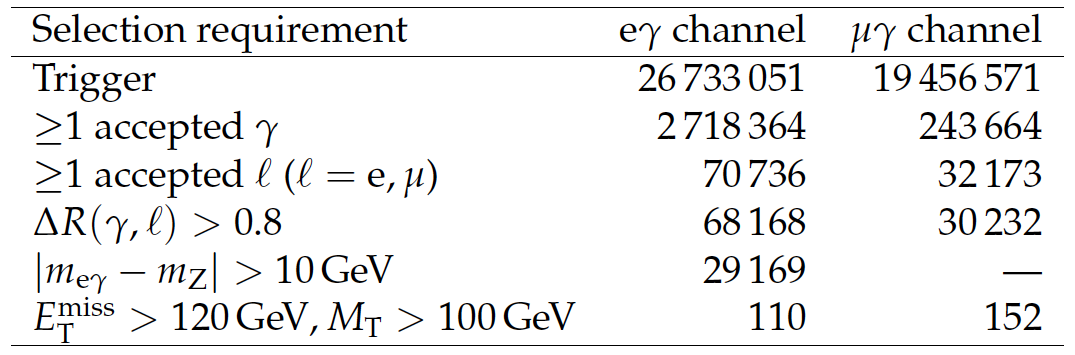
Table 1:
Summary of event selection requirements, and observed number of events after applying the listed selection requirements in successive order. The symbol $m_{ {\mathrm {e}} {\gamma }}$ and $m_{ {\mathrm {Z}}}$ denote the invariant mass of the electron-photon system and the nominal Z boson mass, respectively. |
png pdf |
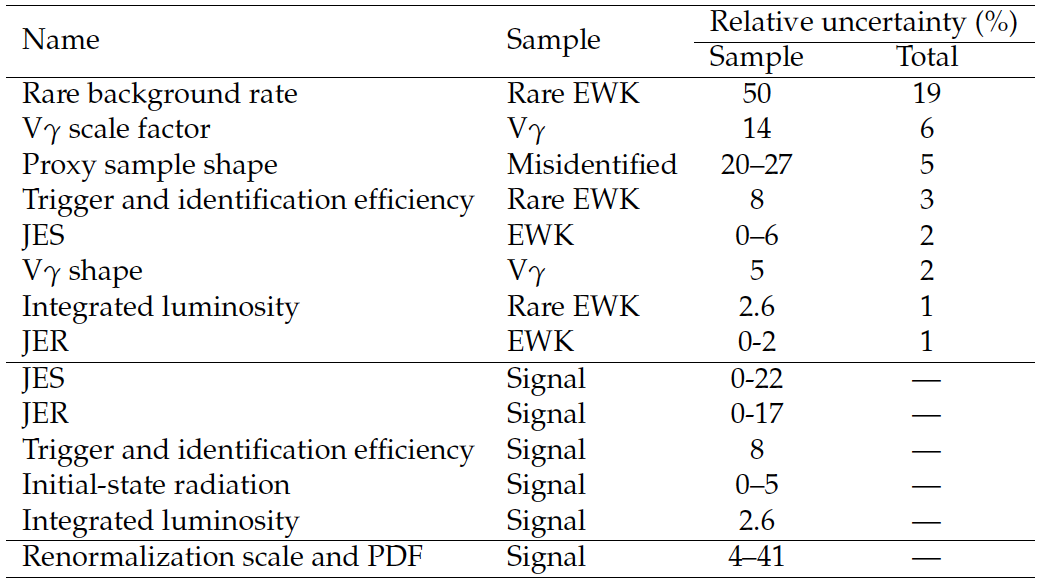
Table 2:
Summary of systematic uncertainties. The third column gives the uncertainty relative to the number of events in the corresponding background or signal sample. The fourth column shows, for the background terms, the uncertainty relative to the total number of background events in the signal region. |
| Summary |
| This paper presents a search for the anomalous production of events with a photon, an electron or muon, and large missing transverse momentum produced in proton-proton collisions at $\sqrt{s} = $ 8 TeV. The data are examined in bins of the photon transverse energy, the magnitude of the missing momentum, and $H_{\mathrm{T}}$, the scalar sum of jet energies. The standard model background is evaluated primarily using control samples in the data, with simulation used to evaluate backgrounds from electroweak processes. No excess of events above the standard model expectation is observed. The results of the search are interpreted as 95% confidence level upper limits on the production of new-physics events in the context of a gauge-mediated supersymmetry breaking (GMSB) model. The GMSB model is excluded for wino masses below 360 GeV. Results are also interpreted in the context of two simplified models inspired by GMSB, denoted TChiWg and T5Wg. The TChiWg model is excluded for gaugino masses below 540 GeV or, if the cross sections are scaled by the weak mixing angle, below 340 GeV. The T5Wg model with gaugino mass above 200GeV is excluded for gluino masses below 1 TeV. |
|
|
Compact Muon Solenoid LHC, CERN |
|

|

|

|

|

|