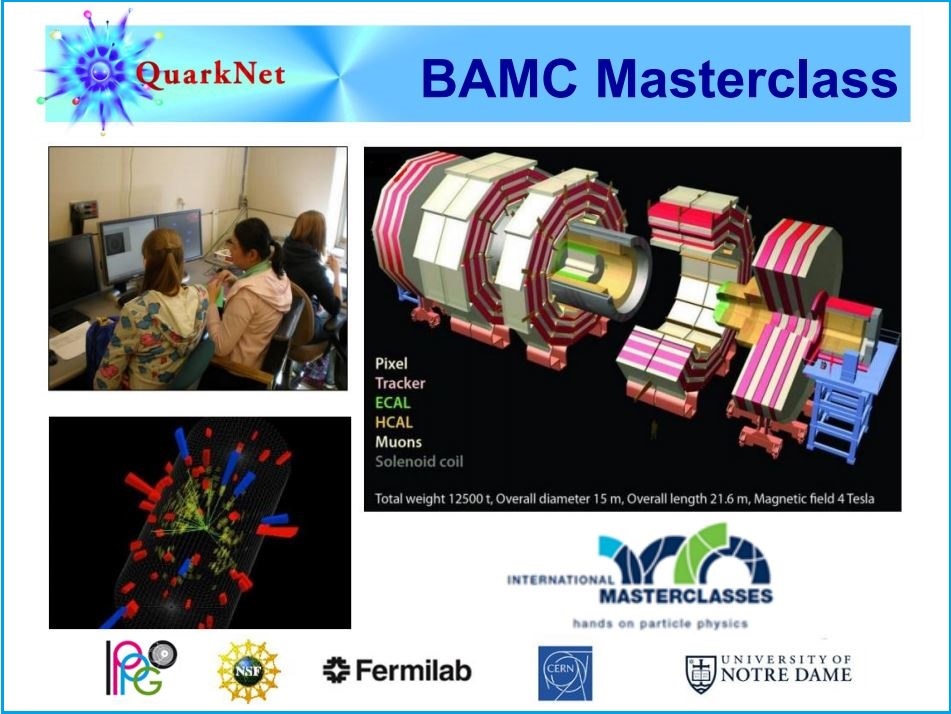
Big Analysis of Muons in CMS

Small URL for this page: http://cern.ch/go/dC6v.
BAMC in 3 Steps / 3 Screencasts

Learn more! Go to BAM Video Extras!
Introduction
Welcome to the Big Analysis of Muons in CMS. We will study interactions in the CMS Detector at CERN that result in:
All other interactions are to be considered background - perhaps interesting but not subjects of our research. Our purposes are to:
- find the ratio of W+ to W- events (from one muon and one neutrino)
- fiind the masses of parent particles - the particles that transform into 2 muons or 4 muons.
Set up and do the measurement
Your teacher will assign you a data file to study. Each file number will be of the form N.M. N refers to the Group the data file is in: N5, N10, N25, N50, or N100. M is the ordinal number after that to specify the exact data file in the group. Thus data file 5.2 is Group N5, 2nd file.
Here is what you do to set up iSpy:
- Go to iSpy-webgl (or go to mirror site). Best browsers to use: Chrome, Safari, Edge.
- Do not change any settings from the column on the left.
- Open the file folder at the upper left. This will open the "Open File" window.
- In the Open File window, choose "Open File(s) from the Web".
- This will give you a list of "N numbers" in the "Files" column. Choose the one that matches your assigned data file.
- The list under Files will change to a list of individual files, each of the form "masterclass2019_M.ig, except the M is an actual orfinal number - the second part of your data file number. Find your and choose it. [If your file is 5.2, then you chose N5 and then masterclass2019_2.ig.]
- A list will appear on the right side of the box under Events. Go to the topmost event ("EventsRunM/Event1" where M is your data file number) and choose it. Then choose the "Load" button at the bottom right of the box.
- You ar eread to start using iSpy.
Next, open the BAMC-2021 Google data form..
You shoild now have iSpy and the Google form open, with iSpy on the first event of the same data file, e.g. 5.2.
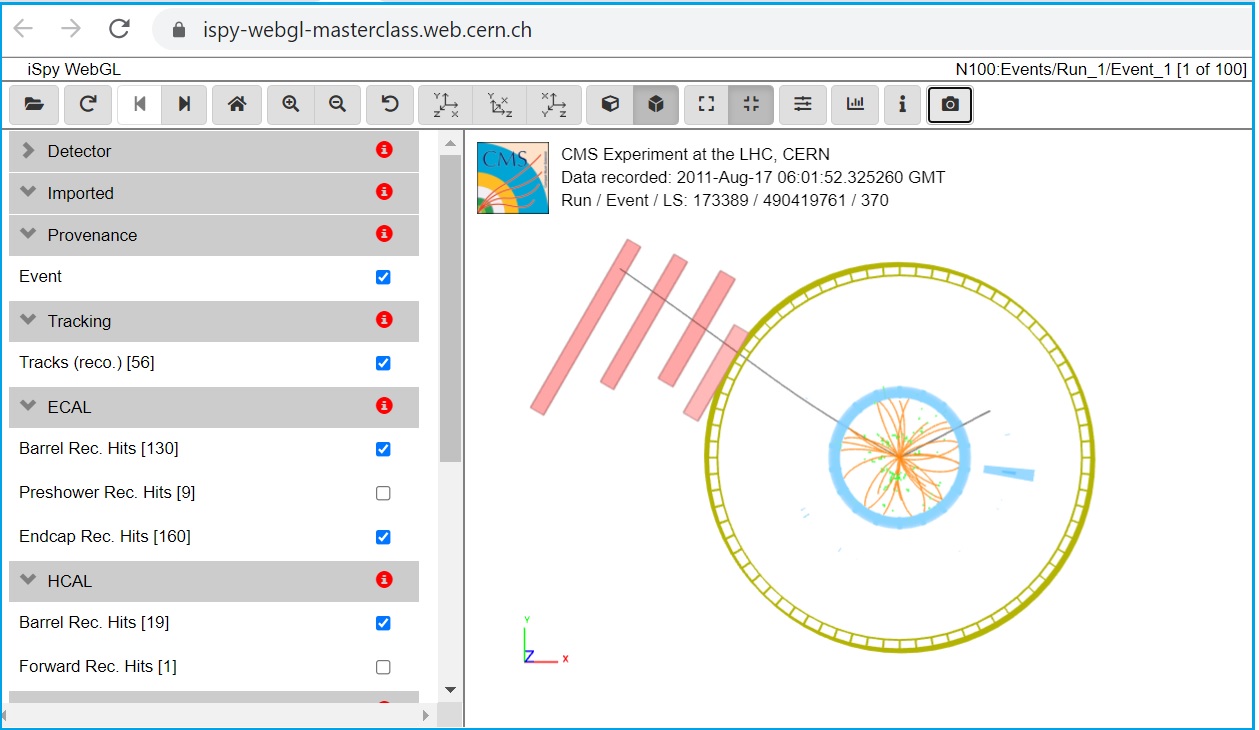
Check out iSpy again. In the buttons at the top of iSpy, you will see three buttons that look like little xyz coordinate systems. The first is for the YX view.. Choose this to get the cutaway view of the cylindrical detector. The other two are for side views but the YX view is the most useful of the three and should be sort of your "home base". You can rotate the view almost any direction by dragging your cursor on the cylinder while pressing your (left) mouse button. You can zoom in or out using the magnifying glass buttons at the top. These are just about the only controls you need, aside from the arrows to go to the previous or next event. Play with it a bit to get used to it.
Let's measure data:
- In iSpy, make sure you are at event 1, YX view. You are looking for long, red tracks. These are from muons. Do you see 0, 1, 2, or 4 of these? [Note: there is sometimes also a purple or pink track for "missing energy". It can be important but it is not a muon.] Everyting in the event except the red muon tracks and the purple or pink missing energy track (in the case of one muon) is background to us. We can ignore it.
- If you see 0 (no) red tracks, go to the next event.
- If you see 1 muon, you should also see a purple or pink "missing energy" track. This indicates a possible neutrino. If (and only if) you do not see the missing energy track, go to the next event. If you do see a missing energy track, the you have a little more work to do before you enter a result in the Google form:
- In the YX view take a close look at the muon track. It should curve clockwise or counterclockwise. You might want to use a straight edge to figure this out.
- If the red track curves clockwise, the muon has a positive charge (technically, it is an antimuon) and it, along with the neutrino, came from a W+ particle that decayed. In the Google form, go the the Q1 box and choose "positive". Leave the other boxes empty. Choose the Submit button.
- If the red track curves counter-clockwise, the muon has a negative charge and it, along with the neutrino, came from a W- particle that decayed. In the Google form, go the the Q1 box and choose "negative". Leave the other boxes empty. Choose the Submit button.
- If you see two muons, it is possible that the two muons came from the decay of a single particle. We can measure the mass by measuring the muons:
- Bring your cursor close to one of the red tracks. When it turns gray, (left) click your mouse. Do the same for the other track. Then press "m" on your keyboard. A box should pop up with a mass. You need that number.
- Go to the Q2 box in the Google form and enter the mass as a pure number (no text, no punctuation aside from the decimal point, no untits) Leave the other boxes empty. Choose the Submit button..
- If you see four muons, it is possible that the four muons came from the decay of a single particle. We can measure the mass by measuring the muons:
- Bring your cursor close to one of the red tracks. When it turns gray, (left) click your mouse. Do the same for the other three tracks. Then press "m" on your keyboard. A box should pop up with a mass. You need that number.
- Go to the Q4 box in the Google form and enter the mass as a pure number (no text, no punctuation aside from the decimal point, no untits) Leave the other boxes empty. Choose the Submit button.
- Any event that is not described above is conisdered background. Skip it.
You have 100 events in your data file. Try to get as many analyzed as you can (statistics are important) but do not worry if you do not get them all done. You do not want to rush either - the quality of your measurement is important too.
Wrap-Up
Once you have finished your analysis, relax until the masterclass videoconference. All of the data submitted in the Google form will go to a Google sheet. The QuarkNet staff will take this information and create three BAMC-wide results: the ration W+/W-, a 2-muon ass plot, and a 4-muon mass plot. The "mass plots" are histograms whihc show how many events ended up in each msall mass range, called a "bin".
The plot at the bottom is the four-muon plot. It shows how many events were in each 6 GeV wide bin. There, too, we hope to find peaks to indicate particles.