Measurement of the cross-section for $Z\to e^+e^-$ production in $pp$ collisions at $\sqrt{s} =7$ TeV
[to restricted-access page]Information
LHCb-PAPER-2012-036
CERN-PH-EP-2012-363
arXiv:1212.4620 [PDF]
(Submitted on 19 Dec 2012)
JHEP 02 (2013) 106
Inspire 1208102
Tools
Abstract
A measurement of the cross-section for pp->Z->e+e- is presented using data at sqrt{s}=7TeV corresponding to an integrated luminosity of 0.94 fb^{-1}. The process is measured within the kinematic acceptance pT>20GeV/c and 2<\eta<4.5 for the daughter electrons and dielectron invariant mass in the range 60--120GeV/c^2. The cross-section is determined to be \sigma(pp->Z->e+e-)=76.0+-0.8+-2.0+-2.6pb where the first uncertainty is statistical, the second is systematic and the third is the uncertainty in the luminosity. The measurement is performed as a function of Z rapidity and as a function of an angular variable which is closely related to the Z transverse momentum. The results are compared with previous LHCb measurements and with theoretical predictions from QCD.
Figures and captions
|
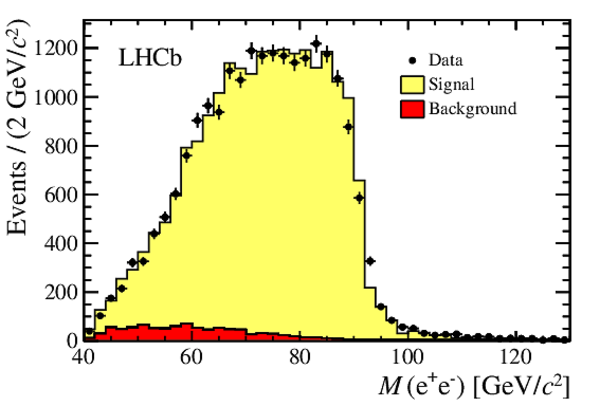
Invariant mass distribution of $\rm Z\rightarrow e ^+ e ^- $ candidates. The data are shown as points with error bars, the background obtained from same-sign data is shown in red (dark shading), to which the expectation from signal simulation is added in yellow (light shading). The $\rm Z\rightarrow e ^+ e ^- $ simulated distribution has been normalised to the (background-subtracted) data. |
Z0_M_1[..].pdf [21 KiB] HiDef png [166 KiB] Thumbnail [154 KiB] *.C file |
|
|
Distribution of $p_{\rm T}$ for the "tag" electron in cases where an isolated cluster of energy of high $E_{\rm T}$ \ is found in the electromagnetic calorimeter. This is fitted with two components obtained from data, the $\rm Z\rightarrow e ^+ e ^- $ signal whose shape is taken from those candidates where the cluster is associated with an identified electron track, and background whose shape is obtained from candidates where the cluster is not isolated. |
TrackE[..].pdf [15 KiB] HiDef png [134 KiB] Thumbnail [122 KiB] *.C file |

|
|
Cross-section for $ p p \rightarrow \rm Z\rightarrow e ^+ e ^- $ at $\sqrt{s}=7\mathrm{ Te V} $ measured in LHCb , shown as the yellow band. The inner (darker) band represents the statistical uncertainty and the outer the total uncertainty. The measurement corresponds to the kinematic acceptance, $ p_{\rm T} >20$ $ {\mathrm{ Ge V /}c}$ and $2<\eta<4.5$ for the leptons and $60<M<120$ $ {\mathrm{ Ge V /}c^2}$ for the dilepton. The points show the various theoretical predictions with their uncertainties as described in the text. |
XSplot.pdf [13 KiB] HiDef png [88 KiB] Thumbnail [76 KiB] *.C file |

|
|
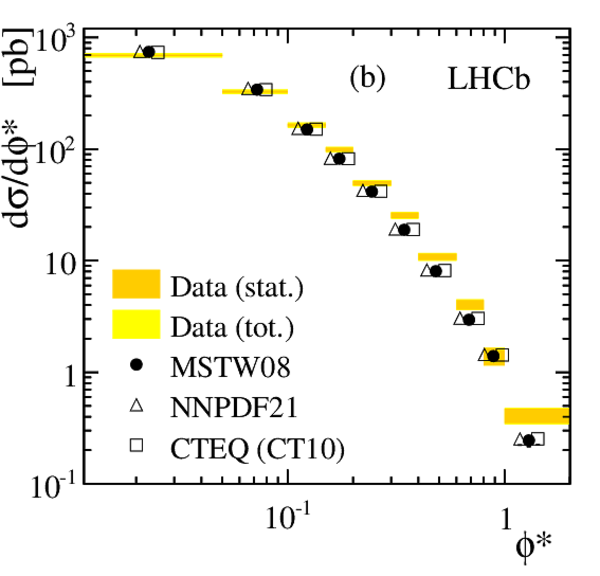
Differential cross-section for $ p p \rightarrow \rm Z\rightarrow e ^+ e ^- $ as a function of (a) \rm Z rapidity and (b) $\phi^*$. The measurements based on the $\sqrt{s}=7\mathrm{ Te V} $ LHCb data are shown as the yellow bands where the inner (darker) band represents the statistical uncertainty and the outer the total uncertainty. NNLO QCD predictions are shown as points with error bars reflecting their uncertainties as described in the text. |
YZNNLOPlot.pdf [15 KiB] HiDef png [187 KiB] Thumbnail [183 KiB] *.C file |

|
|
Phista[..].pdf [14 KiB] HiDef png [159 KiB] Thumbnail [157 KiB] *.C file |
|
|
|
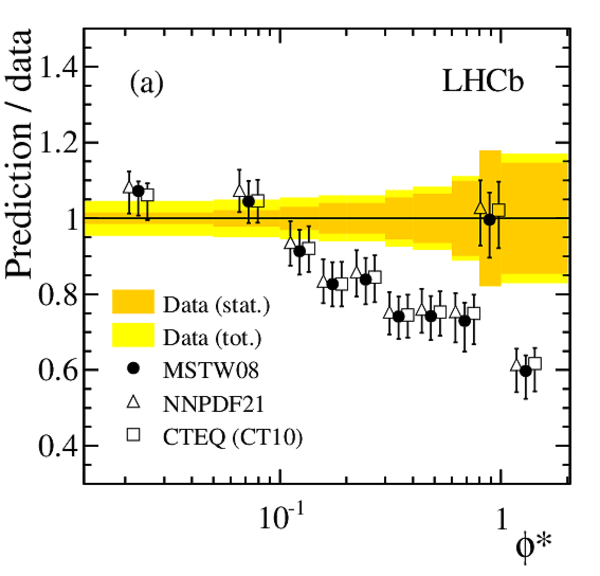
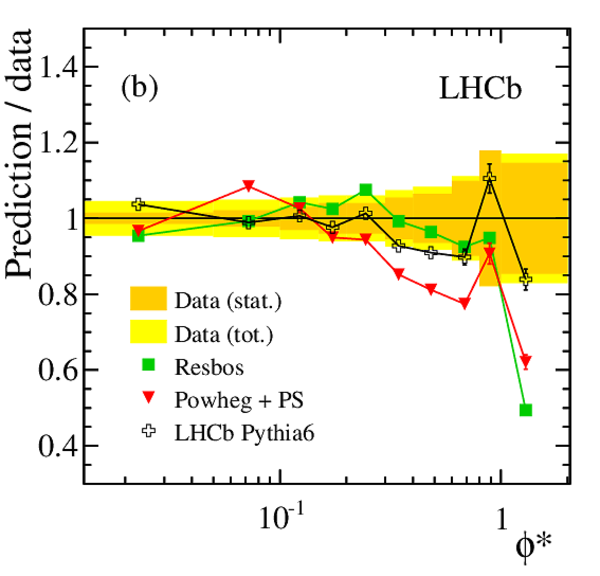
Ratios of various QCD calculations to data for the differential cross-section for $ p p \rightarrow \rm Z\rightarrow e ^+ e ^- $ as a function of $\phi^*$. The measurements based on the $\sqrt{s}=7\mathrm{ Te V} $ LHCb data are shown as the yellow band centred at unity where the inner (darker) band represents the statistical uncertainty and the outer the total uncertainty. (a) NNLO QCD predictions shown as points with error bars reflecting their uncertainties as described in the text. Small lateral displacements of the theory points are made to improve clarity. (b) Ratios of the predictions of Pythia , R{\sc esbos} and P{\sc owheg} to the data shown as points, with error bars that reflect the statistical uncertainties in the predictions. For most points, these errors are so small that they are not visible. |
Phista[..].pdf [15 KiB] HiDef png [176 KiB] Thumbnail [175 KiB] *.C file |
|
|
Phista[..].pdf [15 KiB] HiDef png [227 KiB] Thumbnail [184 KiB] *.C file |
|
|
|
Animated gif made out of all figures. |
PAPER-2012-036.gif Thumbnail |

|
![HiDef png [166 KiB]](Directory_LHCb-PAPER-2012-036/hidef_Z0_M_121012.png)
![HiDef png [134 KiB]](Directory_LHCb-PAPER-2012-036/hidef_TrackEffFit.png)
![HiDef png [88 KiB]](Directory_LHCb-PAPER-2012-036/hidef_XSplot.png)
![HiDef png [187 KiB]](Directory_LHCb-PAPER-2012-036/hidef_YZNNLOPlot.png)
![HiDef png [159 KiB]](Directory_LHCb-PAPER-2012-036/hidef_PhistarNNLOPlot.png)
![HiDef png [176 KiB]](Directory_LHCb-PAPER-2012-036/hidef_PhistarNNLOPlot_rat.png)
![HiDef png [227 KiB]](Directory_LHCb-PAPER-2012-036/hidef_PhistarLLPlot_rat.png)
Tables and captions
|
Quantities entering into the cross-section determination, averaged over the range of \rm Z rapidity used. |
Table_1.pdf [54 KiB] HiDef png [82 KiB] Thumbnail [39 KiB] tex code |

|
|
Event yields and measurements for the differential cross-section of $ p p \rightarrow \rm Z\rightarrow e ^+ e ^- $ at $\sqrt{s}=$7 TeV as a function of \rm Z rapidity, $y_{\rm Z}$, and of $\phi^*$. The first uncertainty is statistical, the second and third are the uncorrelated and correlated experimental systematic uncertainties respectively, and the fourth is the uncertainty in the FSR correction. The common luminosity uncertainty of 3.5% is not explicitly included here. The results are given for the combined data sample. The right-hand column gives the values used for the FSR correction factor. |
Table_2.pdf [45 KiB] HiDef png [82 KiB] Thumbnail [34 KiB] tex code |

|
|
Correlation coefficients for the differential cross-section of $\rm Z\rightarrow e ^+ e ^- $ at 7 TeV between bins of \rm Z rapidity, $y_{\rm Z}$. Both statistical and systematic contributions are included. |
Table_3.pdf [27 KiB] HiDef png [51 KiB] Thumbnail [23 KiB] tex code |

|
|
Correlation coefficients for the differential cross-section of $\rm Z\rightarrow e ^+ e ^- $ at 7 TeV between bins of $\phi^*$. Both statistical and systematic contributions are included. |
Table_4.pdf [27 KiB] HiDef png [55 KiB] Thumbnail [23 KiB] tex code |

|
![HiDef png [82 KiB]](Directory_LHCb-PAPER-2012-036/hidef_Table_1.png)
![HiDef png [82 KiB]](Directory_LHCb-PAPER-2012-036/hidef_Table_2.png)
![HiDef png [51 KiB]](Directory_LHCb-PAPER-2012-036/hidef_Table_3.png)
![HiDef png [55 KiB]](Directory_LHCb-PAPER-2012-036/hidef_Table_4.png)
Created on 18 May 2024.