Measurement of $B$ meson production cross-sections in proton-proton collisions at $\sqrt{s}=$ 7 TeV
[to restricted-access page]Information
LHCb-PAPER-2013-004
CERN-PH-EP-2013-095
arXiv:1306.3663 [PDF]
(Submitted on 16 Jun 2013)
JHEP 08 (2013) 117
Inspire 1238809
Tools
Abstract
The production cross-sections of B mesons are measured in pp collisions at a centre-of-mass energy of 7 TeV, using data collected with the LHCb detector corresponding to a integrated luminosity of 0.36 fb-1. The B+, B0 and Bs0 mesons are reconstructed in the exclusive decays B+ -> J/psi K+, B0 -> J/psi K*0 and Bs0 -> J/psi phi, with J/psi -> mu+ mu-, K*0 -> K+ pi- and phi -> K+ K-. The differential cross-sections are measured as functions of B meson transverse momentum pT and rapidity y, in the range 0 < pT < 40 GeV/c and 2.0 < y < 4.5. The integrated cross-sections in the same pT and y ranges, including charge-conjugate states, are measured to be sigma(pp -> B+ + X) = 38.9 +- 0.3 (stat.) +- 2.5 (syst.) +- 1.3 (norm.) mub, sigma(pp -> B0 + X) = 38.1 +- 0.6 (stat.) +- 3.7 (syst.) +- 4.7 (norm.) mub, sigma(pp -> Bs0 + X) = 10.5 +- 0.2 (stat.) +- 0.8 (syst.) +- 1.0 (norm.) mub, where the third uncertainty arises from the pre-existing branching fraction measurements.
Figures and captions
|
Invariant mass distributions of the selected candidates for ({\it top left}) $ B^{\rm +}$ and ({\it top right}) $ B^{\rm 0}$ decays, both in the range $4.5< p_{\rm T}<5.0\; {\mathrm{ Ge V /}c} $, $3.0<y<3.5$, and ({\it bottom}) $ B^{\rm 0}_s$ decay in the range $4.0< p_{\rm T}<5.0\; {\mathrm{ Ge V /}c} $, $3.0<y<3.5$. The results of the fit to the model described in the text are superimposed. The Cabibbo-suppressed background is barely visible in the top left plot. |
Fig1a.pdf [25 KiB] HiDef png [317 KiB] Thumbnail [277 KiB] *.C file |

|
|
Fig1b.pdf [19 KiB] HiDef png [306 KiB] Thumbnail [263 KiB] *.C file |

|
|
|
Fig1c.pdf [22 KiB] HiDef png [275 KiB] Thumbnail [237 KiB] *.C file |

|
|
|
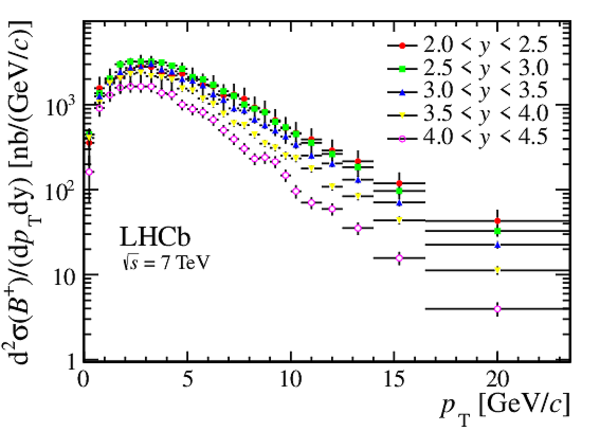
Differential production cross-sections for ({\it top}) $ B^{\rm +}$ , ({\it middle}) $ B^{\rm 0}$ and ({\it bottom}) $ B^{\rm 0}_s$ \ mesons, as functions of $ p_{\rm T}$ \ for each $y$ interval. |
Fig2a.pdf [21 KiB] HiDef png [223 KiB] Thumbnail [207 KiB] *.C file |
|
|
Fig2b.pdf [19 KiB] HiDef png [200 KiB] Thumbnail [195 KiB] *.C file |

|
|
|
Fig2c.pdf [18 KiB] HiDef png [186 KiB] Thumbnail [189 KiB] *.C file |

|
|
|
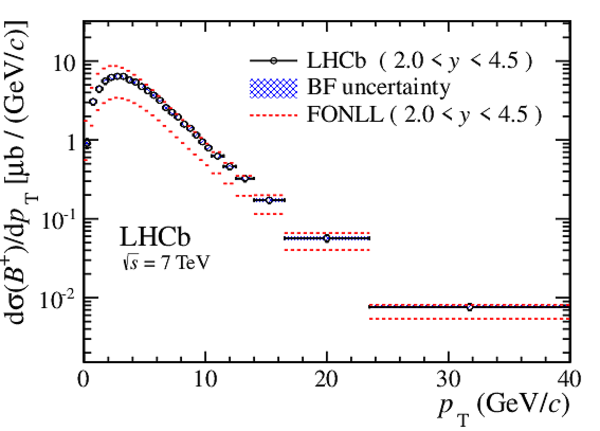
Differential production cross-sections for ({\it top}) $ B^{\rm +}$ , ({\it middle}) $ B^{\rm 0}$ and ({\it bottom}) $ B^{\rm 0}_s$ \ mesons, as functions of $ p_{\rm T}$ \ integrated over the whole $y$ range. The open circles with error bars are the measurements (not including uncertainties from normalisation channel branching fractions and luminosity) and the blue shaded areas are the uncertainties from the branching fractions. The red dashed lines are the upper and lower uncertainty limits of the FONLL computation [3]. |
Fig3a.pdf [17 KiB] HiDef png [192 KiB] Thumbnail [176 KiB] *.C file |
|
|
Fig3b.pdf [16 KiB] HiDef png [219 KiB] Thumbnail [189 KiB] *.C file |

|
|
|
Fig3c.pdf [16 KiB] HiDef png [213 KiB] Thumbnail [184 KiB] *.C file |

|
|
|
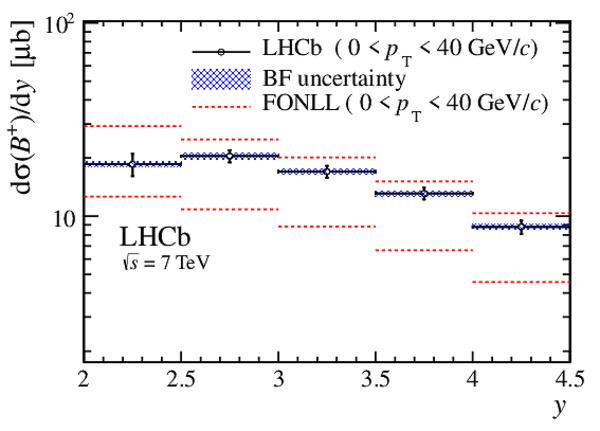
Differential production cross-sections for ({\it top}) $ B^{\rm +}$ , ({\it middle}) $ B^{\rm 0}$ and ({\it bottom}) $ B^{\rm 0}_s$ \ mesons, as functions of $y$ integrated over the whole $ p_{\rm T}$ range. The black open circles with error bars are the measurements (not including uncertainties from normalisation channel branching fractions and luminosity) and the blue shaded areas are the uncertainties from the branching fractions. The red dashed lines are the upper and lower uncertainty limits of the FONLL computation [3]. |
Fig4a.pdf [14 KiB] HiDef png [185 KiB] Thumbnail [163 KiB] *.C file |
|
|
Fig4b.pdf [14 KiB] HiDef png [260 KiB] Thumbnail [195 KiB] *.C file |

|
|
|
Fig4c.pdf [14 KiB] HiDef png [232 KiB] Thumbnail [180 KiB] *.C file |

|
|
|
Animated gif made out of all figures. |
PAPER-2013-004.gif Thumbnail |

|
![HiDef png [317 KiB]](Directory_LHCb-PAPER-2013-004/hidef_Fig1a.png)
![HiDef png [306 KiB]](Directory_LHCb-PAPER-2013-004/hidef_Fig1b.png)
![HiDef png [275 KiB]](Directory_LHCb-PAPER-2013-004/hidef_Fig1c.png)
![HiDef png [223 KiB]](Directory_LHCb-PAPER-2013-004/hidef_Fig2a.png)
![HiDef png [200 KiB]](Directory_LHCb-PAPER-2013-004/hidef_Fig2b.png)
![HiDef png [186 KiB]](Directory_LHCb-PAPER-2013-004/hidef_Fig2c.png)
![HiDef png [192 KiB]](Directory_LHCb-PAPER-2013-004/hidef_Fig3a.png)
![HiDef png [219 KiB]](Directory_LHCb-PAPER-2013-004/hidef_Fig3b.png)
![HiDef png [213 KiB]](Directory_LHCb-PAPER-2013-004/hidef_Fig3c.png)
![HiDef png [185 KiB]](Directory_LHCb-PAPER-2013-004/hidef_Fig4a.png)
![HiDef png [260 KiB]](Directory_LHCb-PAPER-2013-004/hidef_Fig4b.png)
![HiDef png [232 KiB]](Directory_LHCb-PAPER-2013-004/hidef_Fig4c.png)
Tables and captions
|
Relative systematic uncertainties (in %), given as single values or as ranges, when they depend on the ( $ p_{\rm T}$ , y) bin. |
Table_1.pdf [49 KiB] HiDef png [105 KiB] Thumbnail [48 KiB] tex code |

|
![HiDef png [105 KiB]](Directory_LHCb-PAPER-2013-004/hidef_Table_1.png)
Created on 17 May 2024.