Searches for violation of lepton flavour and baryon number in tau lepton decays at LHCb
[to restricted-access page]Information
LHCb-PAPER-2013-014
CERN-PH-EP-2013-062
arXiv:1304.4518 [PDF]
(Submitted on 16 Apr 2013)
Phys. Lett. B724 (2013) 36
Inspire 1228505
Tools
Abstract
Searches for the lepton flavour violating decay $\tau^-\rightarrow \mu^-\mu^+\mu^-$ and the lepton flavour and baryon number violating decays $\tau^-\rightarrow \bar{p}\mu^+\mu^-$ and $\tau^-\rightarrow p\mu^-\mu^-$ have been carried out using proton-proton collision data, corresponding to an integrated luminosity of 1.0 fb$^{-1}$, taken by the LHCb experiment at $\sqrt{s} = 7$ TeV. No evidence has been found for any signal, and limits have been set at 90 confidence level on the branching fractions: $\cal B(\tau^-\rightarrow \mu^-\mu^+\mu^-) < 8.0 \times 10^{-8}$, $\cal B(\tau^-\rightarrow \bar{p}\mu^+\mu^-) < 3.3 \times 10^{-7}$ and $\cal B(\tau^-\rightarrow p\mu^-\mu^-) < 4.4 \times 10^{-7}$. The results for the $\tau^-\rightarrow \bar{p}\mu^+\mu^-$ and $\tau^-\rightarrow p\mu^-\mu^-$ decay modes represent the first direct experimental limits on these channels.
Figures and captions
|
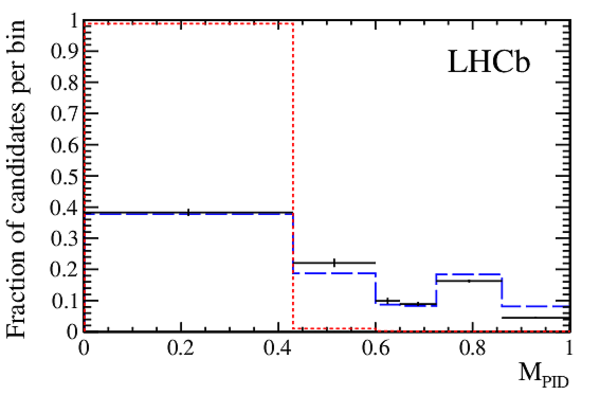
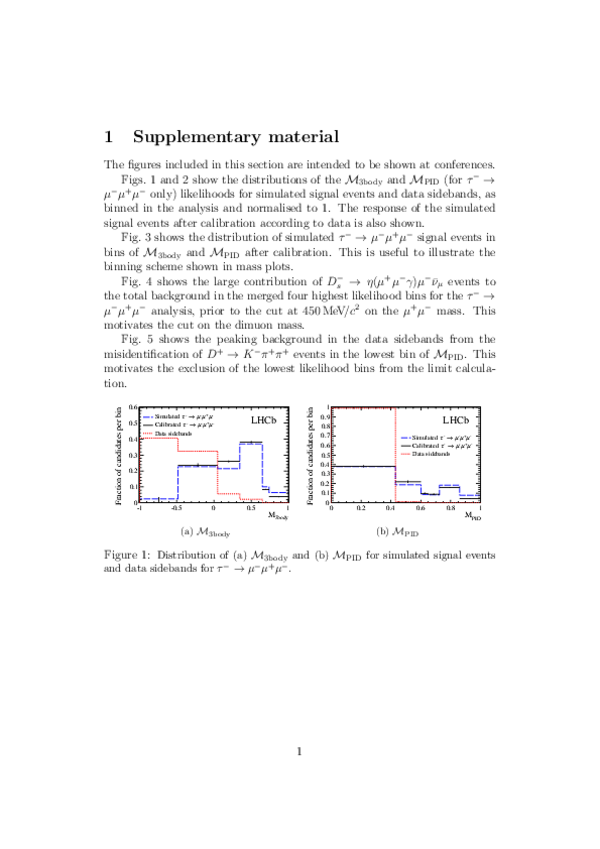
Distribution of (a) $ {\rm \mathcal{M}_{3body}}$ and (b) $ {\rm \mathcal{M}_{PID}}$ for $\tau^-\rightarrow \mu^-\mu^+\mu^-$ where the binning corresponds to that used in the limit calculation. The short dashed (red) lines show the response of the data sidebands, whilst the long dashed (blue) and solid (black) lines show the response of simulated signal events before and after calibration. Note that in both cases the lowest likelihood bin is later excluded from the analysis. |
4a_new.pdf [14 KiB] HiDef png [140 KiB] Thumbnail [137 KiB] *.C file |

|
|
4b_new.pdf [14 KiB] HiDef png [139 KiB] Thumbnail [133 KiB] *.C file |
|
|
|
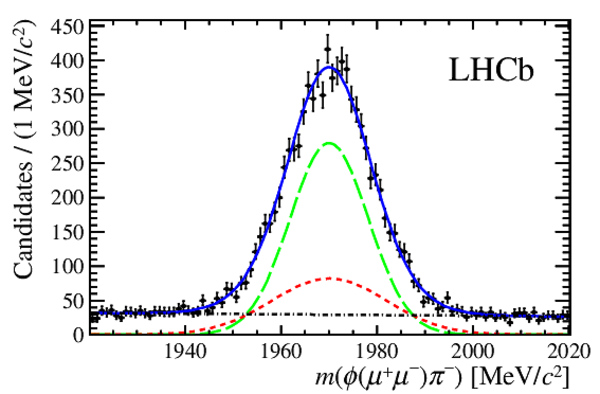
Invariant mass distribution of $\phi(\mu^+\mu^-)\pi^-$ after (a) the $\tau^-\rightarrow \mu^-\mu^+\mu^-$ selection and (b) the $\tau\rightarrow p\mu\mu$ selection and PID cuts. The solid (blue) lines show the overall fits, the long dashed (green) and short dashed (red) lines show the two Gaussian components of the signal and the dot dashed (black) lines show the backgrounds. |
1a.pdf [26 KiB] HiDef png [221 KiB] Thumbnail [186 KiB] *.C file |

|
|
1b.pdf [26 KiB] HiDef png [238 KiB] Thumbnail [204 KiB] *.C file |
|
|
|
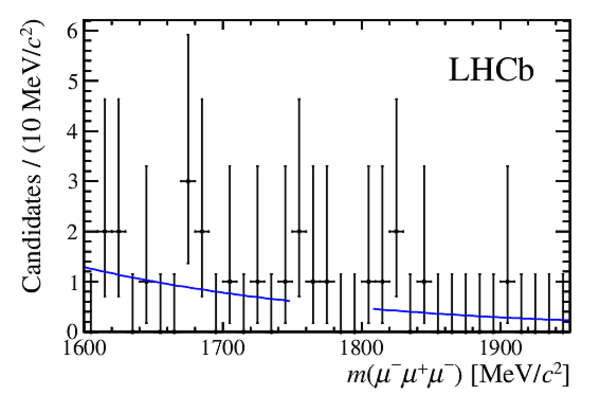
Invariant mass distributions and fits to the mass sidebands in data for (a) $\mu^+\mu^-\mu^-$ candidates in the four merged bins that contain the highest signal probabilities, (b) ${\bar p}\mu^+\mu^-$ candidates in the two merged bins with the highest signal probabilities, and (c) $p\mu^-\mu^-$ candidates in the two merged bins with the highest signal probabilities. |
2a.pdf [17 KiB] HiDef png [145 KiB] Thumbnail [130 KiB] *.C file |
|
|
2b.pdf [16 KiB] HiDef png [153 KiB] Thumbnail [136 KiB] *.C file |

|
|
|
2c.pdf [16 KiB] HiDef png [142 KiB] Thumbnail [123 KiB] *.C file |

|
|
|
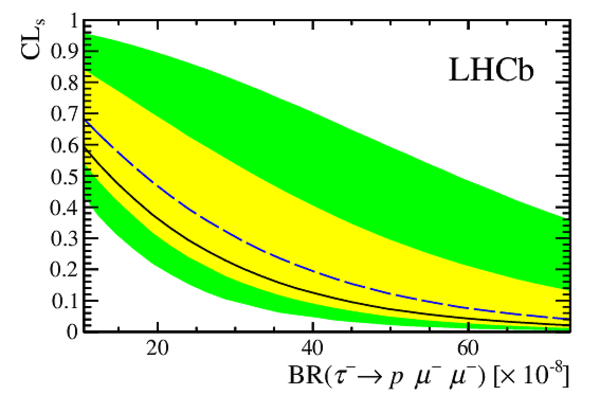
Distribution of $\textrm{CL}_{\textrm{s}}$ values as functions of the assumed branching fractions, under the hypothesis to observe background events only, for (a) $\tau^-\rightarrow \mu^-\mu^+\mu^-$ , (b) $\tau^-\rightarrow \bar{p}\mu^+\mu^-$ and (c) $\tau^-\rightarrow p\mu^-\mu^-$ . The dashed lines indicate the expected curves and the solid lines the observed ones. The light (yellow) and dark (green) bands cover the regions of 68% and 95% confidence for the expected limits. |
3a.pdf [17 KiB] HiDef png [153 KiB] Thumbnail [125 KiB] *.C file |

|
|
3b.pdf [15 KiB] HiDef png [163 KiB] Thumbnail [133 KiB] *.C file |

|
|
|
3c.pdf [15 KiB] HiDef png [170 KiB] Thumbnail [138 KiB] *.C file |
|
|
|
Animated gif made out of all figures. |
PAPER-2013-014.gif Thumbnail |

|
![HiDef png [140 KiB]](Directory_LHCb-PAPER-2013-014/hidef_4a_new.png)
![HiDef png [139 KiB]](Directory_LHCb-PAPER-2013-014/hidef_4b_new.png)
![HiDef png [221 KiB]](Directory_LHCb-PAPER-2013-014/hidef_1a.png)
![HiDef png [238 KiB]](Directory_LHCb-PAPER-2013-014/hidef_1b.png)
![HiDef png [145 KiB]](Directory_LHCb-PAPER-2013-014/hidef_2a.png)
![HiDef png [153 KiB]](Directory_LHCb-PAPER-2013-014/hidef_2b.png)
![HiDef png [142 KiB]](Directory_LHCb-PAPER-2013-014/hidef_2c.png)
![HiDef png [153 KiB]](Directory_LHCb-PAPER-2013-014/hidef_3a.png)
![HiDef png [163 KiB]](Directory_LHCb-PAPER-2013-014/hidef_3b.png)
![HiDef png [170 KiB]](Directory_LHCb-PAPER-2013-014/hidef_3c.png)
Tables and captions
|
Terms entering in the normalisation factor $\alpha$ for $\tau^-\rightarrow \mu^-\mu^+\mu^-$ , $\tau^-\rightarrow \bar{p}\mu^+\mu^-$ and $\tau^-\rightarrow p\mu^-\mu^-$ , and their combined statistical and systematic uncertainties. |
Table_1.pdf [63 KiB] HiDef png [57 KiB] Thumbnail [28 KiB] tex code |

|
|
Expected background candidate yields, with their systematic uncertainties, and observed candidate yields within the $\tau$ signal window in the different likelihood bins for the $\tau^-\rightarrow \mu^-\mu^+\mu^-$ analysis. The likelihood values for $ {\rm \mathcal{M}_{PID}}$ range from $0$ (most background-like) to $+1$ (most signal-like), while those for $ {\rm \mathcal{M}_{3body}}$ range from $-1$ (most background-like) to $+1$ (most signal-like). The lowest likelihood bins have been excluded from the analysis. |
Table_2.pdf [30 KiB] HiDef png [203 KiB] Thumbnail [87 KiB] tex code |

|
|
Expected background candidate yields, with their systematic uncertainties, and observed candidate yields within the $\tau$ mass window in the different likelihood bins for the $\tau\rightarrow p\mu\mu$ analysis. The likelihood values for $ {\rm \mathcal{M}_{3body}}$ range from $-1$ (most background-like) to $+1$ (most signal-like). The lowest likelihood bin has been excluded from the analysis. |
Table_3.pdf [44 KiB] HiDef png [52 KiB] Thumbnail [22 KiB] tex code |

|
![HiDef png [57 KiB]](Directory_LHCb-PAPER-2013-014/hidef_Table_1.png)
![HiDef png [203 KiB]](Directory_LHCb-PAPER-2013-014/hidef_Table_2.png)
![HiDef png [52 KiB]](Directory_LHCb-PAPER-2013-014/hidef_Table_3.png)
Supplementary Material [file]
| Supplementary material full pdf |
supple[..].pdf [224 KiB] |
|
|
This zip file contains supplementary material for the publication LHCb-PAPER-2013-014. The files included are: Supplementary.pdf: The appendix from the paper, including the figures with captions and some brief explanation. *pdf, *eps, *png: The figures |
Fig4a.pdf [14 KiB] HiDef png [152 KiB] Thumbnail [146 KiB] *C file |

|
|
Fig4b.pdf [14 KiB] HiDef png [172 KiB] Thumbnail [165 KiB] *C file |

|
|
|
Fig5a.pdf [14 KiB] HiDef png [161 KiB] Thumbnail [154 KiB] *C file |

|
|
|
Fig5b.pdf [14 KiB] HiDef png [149 KiB] Thumbnail [144 KiB] *C file |
|
|
|
Fig6.pdf [13 KiB] HiDef png [153 KiB] Thumbnail [74 KiB] *C file |

|
|
|
Fig7.pdf [16 KiB] HiDef png [134 KiB] Thumbnail [129 KiB] *C file |

|
|
|
Fig8a.pdf [22 KiB] HiDef png [271 KiB] Thumbnail [200 KiB] *C file |

|
|
|
Fig8b.pdf [25 KiB] HiDef png [243 KiB] Thumbnail [218 KiB] *C file |

|
![HiDef png [152 KiB]](Directory_LHCb-PAPER-2013-014/supplementary/hidef_Fig4a.png)
![HiDef png [172 KiB]](Directory_LHCb-PAPER-2013-014/supplementary/hidef_Fig4b.png)
![HiDef png [161 KiB]](Directory_LHCb-PAPER-2013-014/supplementary/hidef_Fig5a.png)
![HiDef png [149 KiB]](Directory_LHCb-PAPER-2013-014/supplementary/hidef_Fig5b.png)
![HiDef png [153 KiB]](Directory_LHCb-PAPER-2013-014/supplementary/hidef_Fig6.png)
![HiDef png [134 KiB]](Directory_LHCb-PAPER-2013-014/supplementary/hidef_Fig7.png)
![HiDef png [271 KiB]](Directory_LHCb-PAPER-2013-014/supplementary/hidef_Fig8a.png)
![HiDef png [243 KiB]](Directory_LHCb-PAPER-2013-014/supplementary/hidef_Fig8b.png)
Created on 18 May 2024.