Information
LHCb-PAPER-2016-017
CERN-EP-2016-166
arXiv:1607.06314 [PDF]
(Submitted on 21 Jul 2016)
Phys. Lett. B762 (2016) 484
Inspire 1477402
Tools
Abstract
Using a data set corresponding to an integrated luminosity of $3 fb^{-1}$, collected by the LHCb experiment in $pp$ collisions at centre-of-mass energies of 7 and 8 TeV, the effective lifetime in the $B^0_s \rightarrow J/\psi \eta$ decay mode, $\tau_{\textrm{eff}}$, is measured to be $\tau_{\textrm{eff}} = 1.479 \pm 0.034 \textrm{(stat)} \pm 0.011 \textrm{(syst)}$ ps. Assuming $CP$ conservation, $\tau_{\textrm{eff}}$ corresponds to the lifetime of the light $B_s^0$ mass eigenstate. This is the first measurement of the effective lifetime in this decay mode.
Figures and captions
|
Total acceptance function, $A_{\textrm{tot}}$ for 2011 data (black dashed line) and 2012 data (solid red). |
fig1.pdf [7 KiB] HiDef png [93 KiB] Thumbnail [82 KiB] *.C file |

|
|
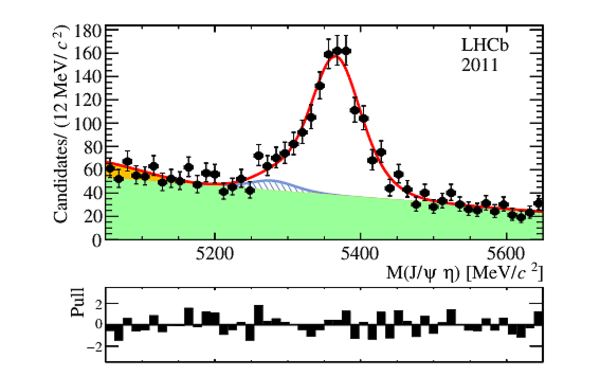
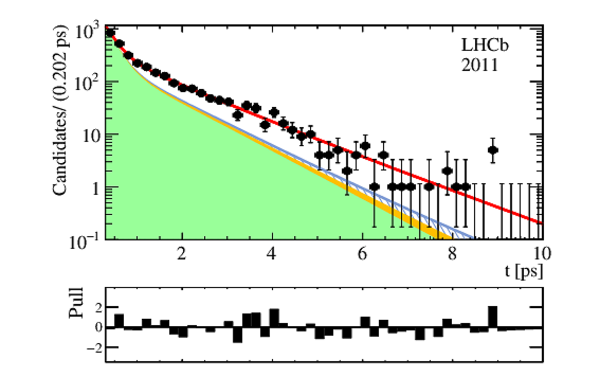
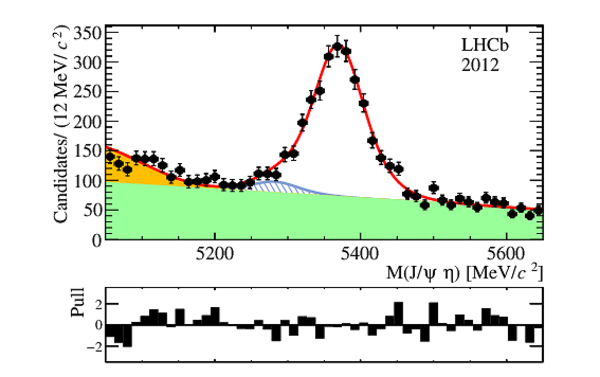
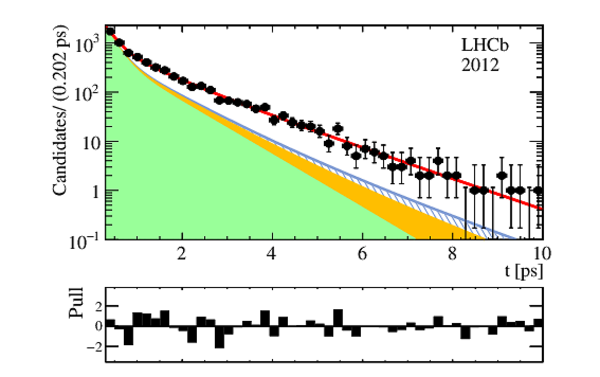
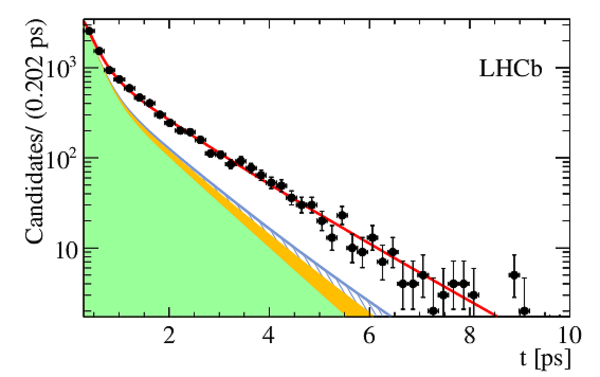
Mass and decay time distributions for the 2011 dataset (top row) and 2012 dataset (bottom row). The fit model described in the text is superimposed (red line). The partially reconstructed component is shown in solid yellow (dark grey), the combinatorial background in solid green (light grey) and the $ B ^0 $ component as open blue. The pull, i.e. the difference between the observed and fitted value divided by the uncertainty, is shown below each of the plots. |
fig2a.pdf [27 KiB] HiDef png [206 KiB] Thumbnail [174 KiB] *.C file |
|
|
fig2b.pdf [22 KiB] HiDef png [205 KiB] Thumbnail [158 KiB] *.C file |
|
|
|
fig2c.pdf [27 KiB] HiDef png [196 KiB] Thumbnail [163 KiB] *.C file |
|
|
|
fig2d.pdf [22 KiB] HiDef png [212 KiB] Thumbnail [164 KiB] *.C file |
|
|
|
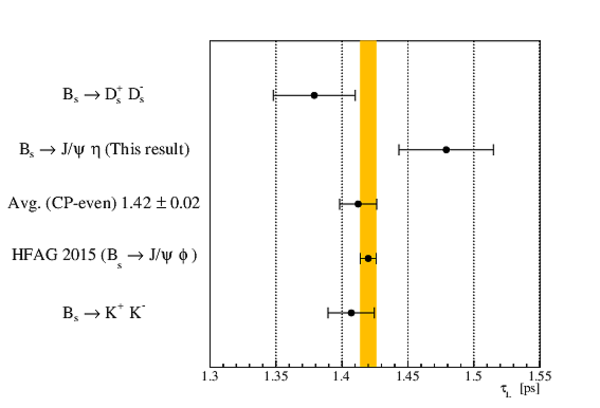
Summary of measurements of $\tau_{\rm L}$. The yellow band corresponds to the 2015 HFAG central value and uncertainty. |
fig3.pdf [9 KiB] HiDef png [118 KiB] Thumbnail [107 KiB] *.C file |
|
|
Animated gif made out of all figures. |
PAPER-2016-017.gif Thumbnail |

|
Tables and captions
|
Acceptance parameters due to the selection requirements ($A_{\textrm{sel}}$). The correlation coefficients are $\rho_{c_0 c_1} = 0.51 $, $\rho_{c_0 c_2} = 0.62 $ and $\rho_{c_1 c_2} = 0.95$. |
Table_1.pdf [41 KiB] HiDef png [45 KiB] Thumbnail [20 KiB] tex code |

|
|
Values of the $\beta$ and $\gamma$ factor fitting the quadratic form. The first uncertainty is statistical and the second from the propagation of the uncertainty on the efficiency versus the distance of closest approach obtained with the $ B ^+ \rightarrow { J \mskip -3mu/\mskip -2mu\psi \mskip 2mu} K^+$ calibration sample. The correlation coefficienct between $\beta$ and $\gamma$ is 0.8. |
Table_2.pdf [48 KiB] HiDef png [41 KiB] Thumbnail [19 KiB] tex code |

|
|
Parameters of the fit to $B^0_{(s)} \rightarrow { J \mskip -3mu/\mskip -2mu\psi \mskip 2mu} \eta$ candidates for the 2011 and 2012 datasets. Uncertainties are statistical only. |
Table_3.pdf [60 KiB] HiDef png [93 KiB] Thumbnail [47 KiB] tex code |

|
|
Systematic uncertainties on the lifetime measurement. Uncertainties less than $0.1 \mathrm{ fs} $ are indicated by a dash. |
Table_4.pdf [48 KiB] HiDef png [126 KiB] Thumbnail [55 KiB] tex code |

|
Supplementary Material [file]

![HiDef png [93 KiB]](Directory_LHCb-PAPER-2016-017/hidef_fig1.png)
![HiDef png [206 KiB]](Directory_LHCb-PAPER-2016-017/hidef_fig2a.png)
![HiDef png [205 KiB]](Directory_LHCb-PAPER-2016-017/hidef_fig2b.png)
![HiDef png [196 KiB]](Directory_LHCb-PAPER-2016-017/hidef_fig2c.png)
![HiDef png [212 KiB]](Directory_LHCb-PAPER-2016-017/hidef_fig2d.png)
![HiDef png [118 KiB]](Directory_LHCb-PAPER-2016-017/hidef_fig3.png)
![HiDef png [45 KiB]](Directory_LHCb-PAPER-2016-017/hidef_Table_1.png)
![HiDef png [41 KiB]](Directory_LHCb-PAPER-2016-017/hidef_Table_2.png)
![HiDef png [93 KiB]](Directory_LHCb-PAPER-2016-017/hidef_Table_3.png)
![HiDef png [126 KiB]](Directory_LHCb-PAPER-2016-017/hidef_Table_4.png)
![HiDef png [381 KiB]](Directory_LHCb-PAPER-2016-017/supplementary/hidef_supplementary-submit.png)
![HiDef png [213 KiB]](Directory_LHCb-PAPER-2016-017/supplementary/hidef_fig4.png)
![HiDef png [203 KiB]](Directory_LHCb-PAPER-2016-017/supplementary/hidef_fig5.png)
Created on 18 May 2024.