First Measurement of Charm Production in its Fixed-Target Configuration at the LHC
[to restricted-access page]Information
LHCb-PAPER-2018-023
CERN-EP-2018-266
arXiv:1810.07907 [PDF]
(Submitted on 18 Oct 2018)
Phys. Rev. Lett. 122 (2019) 132002
Inspire 1699199
Tools
Abstract
The first measurement of heavy-flavour production by the LHCb experiment in its fixed-target mode is presented. The production of $J/\psi$ and $D^0$ mesons is studied with beams of protons of different energies colliding with gaseous targets of helium and argon with nucleon-nucleon centre-of-mass energies of $\sqrt{s_{NN}} = 86.6 $ and $ 110.4$ ${\rm GeV}$, respectively. The $J/\psi$ and $D^0$ (including charge conjugate) production cross sections in $p{\rm He}$ collisions in the rapidity range $[2,4.6]$ are found to be $\sigma_{J/\psi} = 652 \pm 33$ (stat) $\pm 42$ (syst) nb$/$nucleon and $\sigma_{D^0} = 80.8 \pm 2.4$ (stat) $\pm 6.3$ (syst) $\mu$b$/$nucleon, where the first uncertainty is statistical and the second is systematic. No evidence for a substantial intrinsic charm content of the nucleon is observed in the large Bjorken-$x$ region.
Figures and captions
|
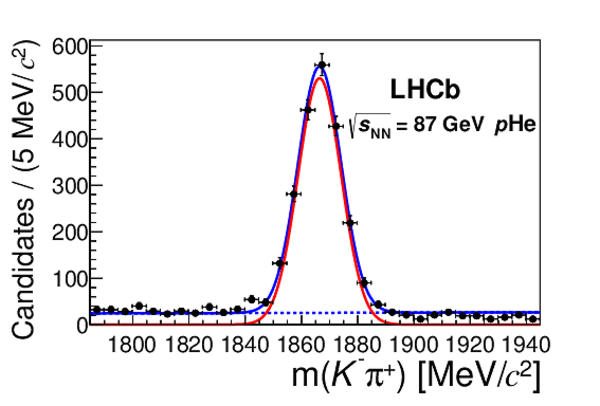
Mass distributions, fitted by an extended unbinned maximum-likelihood in $\sqrt{s_{\scriptscriptstyle\rm NN}} =86.6\mathrm{ Ge V} $ $ p\text{He}$ collisions; $ { J \mskip -3mu/\mskip -2mu\psi \mskip 2mu} \to\mu ^- \mu ^+ $ (left); $ D ^0 \to K ^- \pi ^+ $ (right). The dashed blue line corresponds to the combinatorial background, the red line to the signal and the solid blue line to the sum of the two. |
Fig1a.pdf [17 KiB] HiDef png [198 KiB] Thumbnail [165 KiB] *.C file |

|
|
Fig1b.pdf [18 KiB] HiDef png [214 KiB] Thumbnail [184 KiB] *.C file |
|
|
|
Left: $ { J \mskip -3mu/\mskip -2mu\psi \mskip 2mu}$ cross-section measurements as a function of the center-of-mass energy. Experimental data, represented by black points, are taken from Ref. [39]. The band corresponds to a fit based on NLO NRQCD calculations [39]. Right: $c\overline{c}$ cross-section measurements as a function of the center-of-mass energy. Experimental data, represented by black points, are taken from Ref. [40]. The yellow band corresponds to NLO pQCD calculations [41]. Red points correspond to the $ p\text{He}$ results from the present analysis. |
Fig2a.pdf [21 KiB] HiDef png [708 KiB] Thumbnail [160 KiB] *.C file |

|
|
Fig2b.pdf [21 KiB] HiDef png [1 MiB] Thumbnail [175 KiB] *.C file |

|
|
|
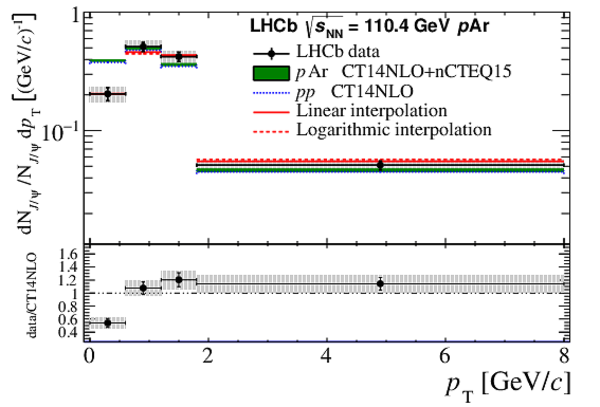
Differential $ { J \mskip -3mu/\mskip -2mu\psi \mskip 2mu}$ production cross sections for (top) $ p\text{He}$ and differential $ { J \mskip -3mu/\mskip -2mu\psi \mskip 2mu}$ yields for (bottom) $ p\text{Ar}$ collisions, as a function of (left) center-of-mass rapidity $y^*$ and (right) transverse momentum $ p_{\mathrm{T}} $. The data points mark the bin centers. The quadratic sum of statistical and uncorrelated systematic uncertainties are indicated by the vertical black lines. The correlated systematic uncertainties are indicated by the grey area. Theoretical predictions are described in the text. The lower panel of each plot shows the ratio of data to HELAC-ONIA $pp$ predictions. |
Fig3a.pdf [16 KiB] HiDef png [424 KiB] Thumbnail [276 KiB] *.C file |

|
|
Fig3b.pdf [16 KiB] HiDef png [361 KiB] Thumbnail [249 KiB] *.C file |

|
|
|
Fig3c.pdf [16 KiB] HiDef png [400 KiB] Thumbnail [244 KiB] *.C file |

|
|
|
Fig3d.pdf [16 KiB] HiDef png [360 KiB] Thumbnail [236 KiB] *.C file |
|
|
|
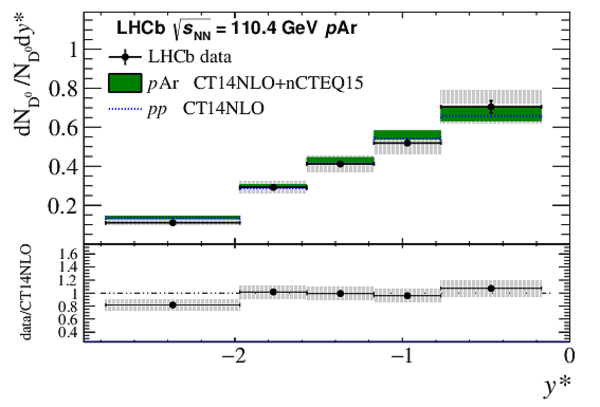
Differential $ D ^0$ production cross sections for (top) $ p\text{He}$ and differential $ D ^0$ yields for (bottom) $ p\text{Ar}$ collisions, as a function of (left) center-of-mass rapidity $y^*$ and (right) transverse momentum $ p_{\mathrm{T}} $. The data points mark the bin centers. The quadratic sum of statistical and uncorrelated systematic uncertainties are indicated by the vertical black lines. The correlated systematic uncertainties are indicated by the gray area. Theoretical predictions are described in the text. The lower panel of each plot shows the ratio of data to HELAC-ONIA $pp$ predictions. |
Fig4a.pdf [16 KiB] HiDef png [353 KiB] Thumbnail [232 KiB] *.C file |

|
|
Fig4b.pdf [16 KiB] HiDef png [281 KiB] Thumbnail [214 KiB] *.C file |

|
|
|
Fig4c.pdf [15 KiB] HiDef png [297 KiB] Thumbnail [194 KiB] *.C file |
|
|
|
Fig4d.pdf [16 KiB] HiDef png [307 KiB] Thumbnail [207 KiB] *.C file |

|
|
|
Animated gif made out of all figures. |
PAPER-2018-023.gif Thumbnail |

|
![HiDef png [198 KiB]](Directory_LHCb-PAPER-2018-023/hidef_Fig1a.png)
![HiDef png [214 KiB]](Directory_LHCb-PAPER-2018-023/hidef_Fig1b.png)
![HiDef png [708 KiB]](Directory_LHCb-PAPER-2018-023/hidef_Fig2a.png)
![HiDef png [1 MiB]](Directory_LHCb-PAPER-2018-023/hidef_Fig2b.png)
![HiDef png [424 KiB]](Directory_LHCb-PAPER-2018-023/hidef_Fig3a.png)
![HiDef png [361 KiB]](Directory_LHCb-PAPER-2018-023/hidef_Fig3b.png)
![HiDef png [400 KiB]](Directory_LHCb-PAPER-2018-023/hidef_Fig3c.png)
![HiDef png [360 KiB]](Directory_LHCb-PAPER-2018-023/hidef_Fig3d.png)
![HiDef png [353 KiB]](Directory_LHCb-PAPER-2018-023/hidef_Fig4a.png)
![HiDef png [281 KiB]](Directory_LHCb-PAPER-2018-023/hidef_Fig4b.png)
![HiDef png [297 KiB]](Directory_LHCb-PAPER-2018-023/hidef_Fig4c.png)
![HiDef png [307 KiB]](Directory_LHCb-PAPER-2018-023/hidef_Fig4d.png)
Tables and captions
|
Systematic and statistical uncertainties on the $ { J \mskip -3mu/\mskip -2mu\psi \mskip 2mu}$ and $ D ^0$ yields in $\%$. Systematic uncertainties correlated between bins affect all measurements by the same relative amount. Ranges denote the minimum and the maximum values among the $y$ or $ p_{\mathrm{T}}$ bins. |
Table_1.pdf [56 KiB] HiDef png [177 KiB] Thumbnail [83 KiB] tex code |

|
![HiDef png [177 KiB]](Directory_LHCb-PAPER-2018-023/hidef_Table_1.png)
Supplementary Material [file]
| Supplementary material full pdf |
Supple[..].pdf [206 KiB] |
|
|
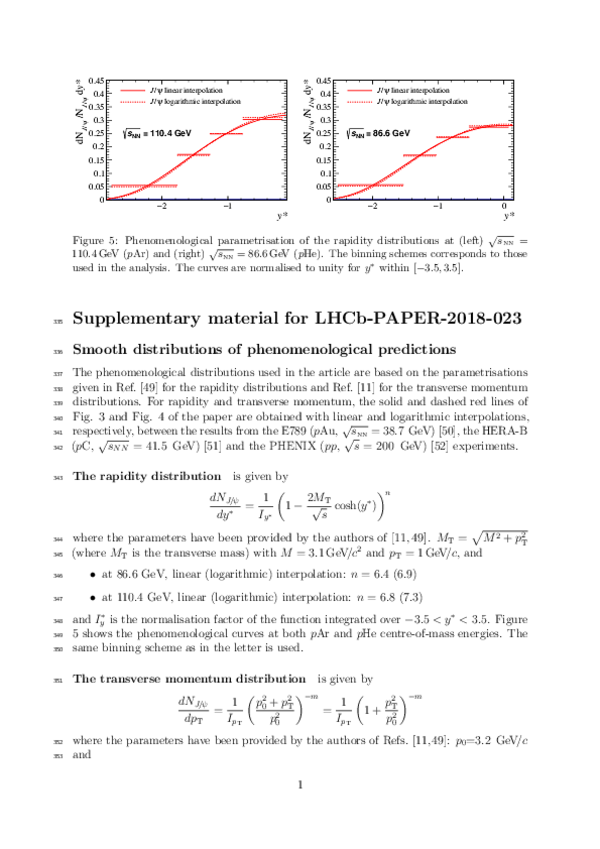
This ZIP file contains supplemetary material for the publication LHCb-PAPER-2018-023. The files are: Supplementary.pdf : An overview of the extra figures *.pdf, *.png, *.eps *.C : The figures in variuous formats |
Fig5a.pdf [15 KiB] HiDef png [169 KiB] Thumbnail [154 KiB] *C file |

|
|
Fig5b.pdf [15 KiB] HiDef png [167 KiB] Thumbnail [154 KiB] *C file |

|
|
|
Fig6a.pdf [15 KiB] HiDef png [168 KiB] Thumbnail [152 KiB] *C file |

|
|
|
Fig6b.pdf [15 KiB] HiDef png [169 KiB] Thumbnail [155 KiB] *C file |

|
![HiDef png [169 KiB]](Directory_LHCb-PAPER-2018-023/supplementary/hidef_Fig5a.png)
![HiDef png [167 KiB]](Directory_LHCb-PAPER-2018-023/supplementary/hidef_Fig5b.png)
![HiDef png [168 KiB]](Directory_LHCb-PAPER-2018-023/supplementary/hidef_Fig6a.png)
![HiDef png [169 KiB]](Directory_LHCb-PAPER-2018-023/supplementary/hidef_Fig6b.png)
Created on 18 May 2024.