Information
LHCb-PAPER-2021-024
CERN-EP-2021-170
arXiv:2109.01113 [PDF]
(Submitted on 02 Sep 2021)
JHEP 01 (2022) 036
Inspire 1915806
Tools
Abstract
The $W$ boson mass is measured using proton-proton collision data at $\sqrt{s}=13$ TeV corresponding to an integrated luminosity of 1.7 fb$^{-1}$ recorded during 2016 by the LHCb experiment. With a simultaneous fit of the muon $q/p_T$ distribution of a sample of $W \to \mu\nu$ decays and the $\phi^*$ distribution of a sample of $Z\to\mu\mu$ decays the $W$ boson mass is determined to be \begin{equation*} m_{W} = 80354 \pm 23_{\rm stat} \pm 10_{\rm exp} \pm 17_{\rm theory} \pm 9_{\rm PDF} \mathrm{MeV}, \end{equation*} where uncertainties correspond to contributions from statistical, experimental systematic, theoretical and parton distribution function sources. This is an average of results based on three recent global parton distribution function sets. The measurement agrees well with the prediction of the global electroweak fit and with previous measurements.
Figures and captions
|
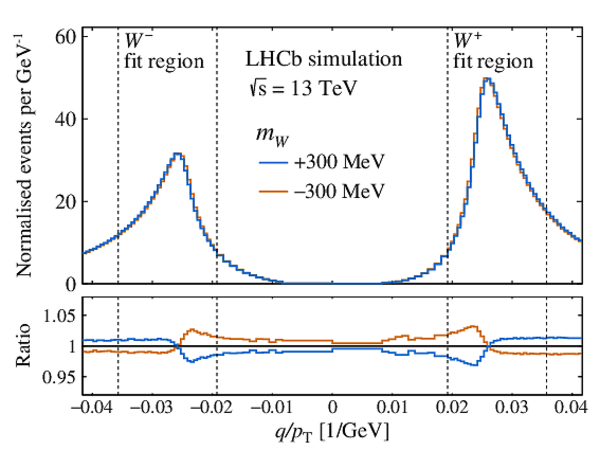
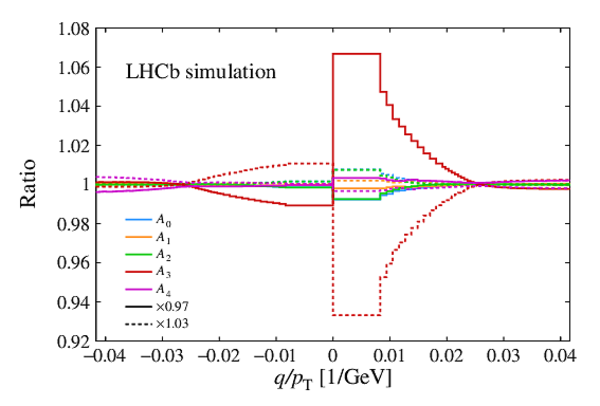
Muon $q/ p_{\mathrm{T}} $ distribution in simulated $ W \rightarrow \mu\nu$ events with variations in (left) $m_W$ and (right) the $A_3$ coefficient. The dashed vertical lines indicate the two $ p_{\mathrm{T}}$ ranges that are included in the $m_W$ fit. |
Fig1a.pdf [17 KiB] HiDef png [269 KiB] Thumbnail [218 KiB] *.C file |
|
|
Fig1b.pdf [18 KiB] HiDef png [231 KiB] Thumbnail [199 KiB] *.C file |

|
|
|
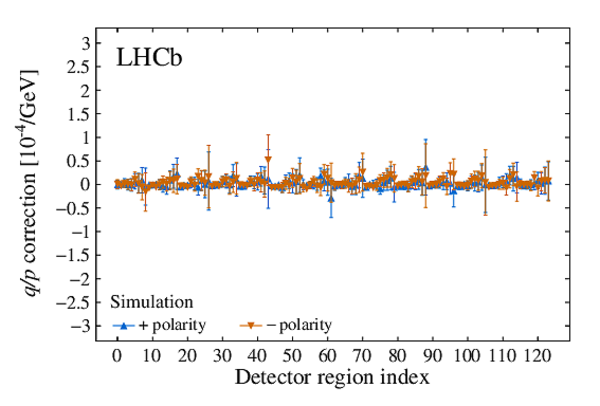
Curvature corrections as a function of the detector region index (depends on $\eta$, $\phi$ and tracking detector, as described in the text) for (left) data and (right) simulation. The corrections are shown for both polarity configurations. The periodic pattern corresponds to a dependence on pseudorapidity that repeats in the intervals of the azimuthal angle. |
Fig2a.pdf [27 KiB] HiDef png [408 KiB] Thumbnail [253 KiB] *.C file |

|
|
Fig2b.pdf [24 KiB] HiDef png [273 KiB] Thumbnail [170 KiB] *.C file |
|
|
|
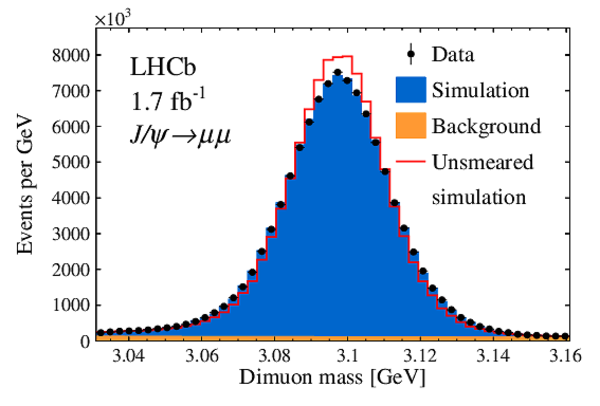
Dimuon mass distributions for selected $J/\psi$, $\Upsilon (1S)$ and $ Z$ boson candidates. All categories with both muons in the $2.2 < \eta < 4.4$ region are combined. The data are compared with the fit model. The red histogram delineates the model before the application of the smearing. |
Fig3a.pdf [17 KiB] HiDef png [208 KiB] Thumbnail [174 KiB] *.C file |
|
|
Fig3b.pdf [19 KiB] HiDef png [178 KiB] Thumbnail [150 KiB] *.C file |

|
|
|
Fig3c.pdf [16 KiB] HiDef png [168 KiB] Thumbnail [137 KiB] *.C file |

|
|
|
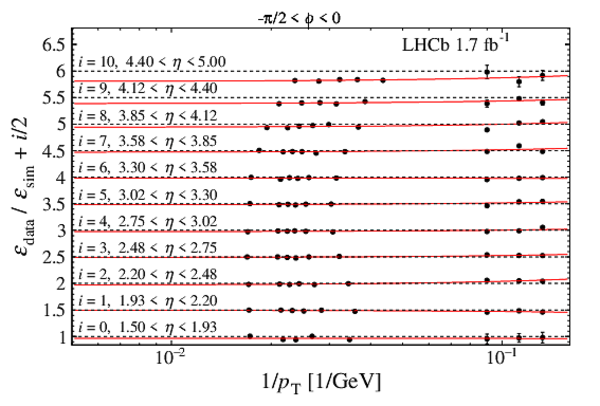
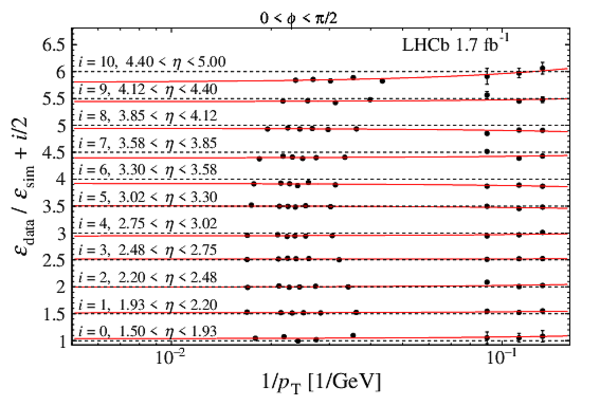
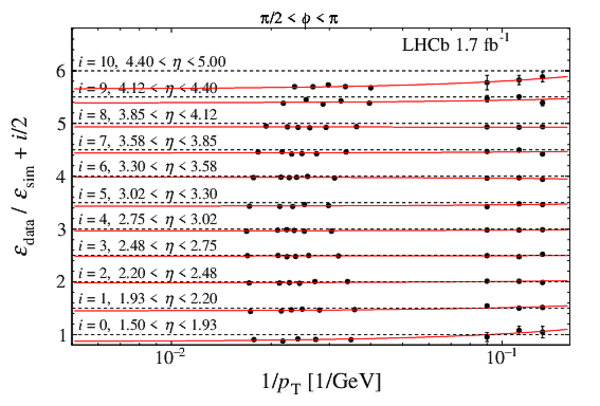
Trigger efficiency ratios in data relative to simulation in intervals of $\eta$ for a single interval of $\phi$. The points are presented as a function of $1/ p_{\mathrm{T}} $ and are overlaid with best-fit linear functions of $ p_{\mathrm{T}} $. Points from each $\eta$ interval are separated for readability by an offset of half the integer index $i$ for that interval. The uncertainties on most of the points are too small for the error bars to be visible. |
Fig4.pdf [23 KiB] HiDef png [341 KiB] Thumbnail [292 KiB] *.C file |

|
|
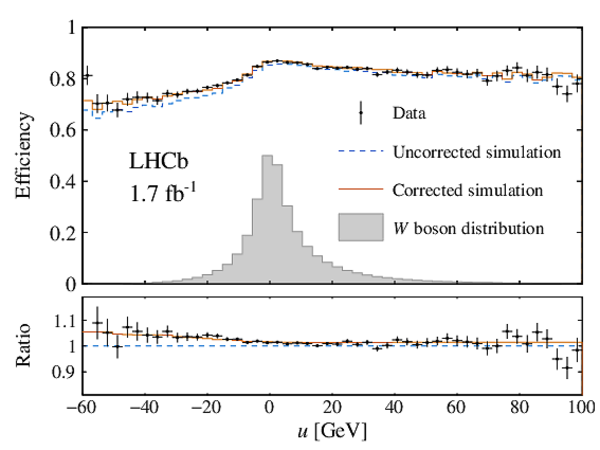
Isolation efficiencies as a function of the observables (left) $u$ and (right) $1/ p_{\mathrm{T}} $ of the muon. The grey histograms indicate the, arbitrarily normalised, shapes of each distribution in simulated $ W$ boson events. In the lower panels the ratios of the isolation efficiency with respect to the uncorrected simulation are shown. |
Fig5a.pdf [21 KiB] HiDef png [214 KiB] Thumbnail [181 KiB] *.C file |
|
|
Fig5b.pdf [20 KiB] HiDef png [191 KiB] Thumbnail [162 KiB] *.C file |

|
|
|
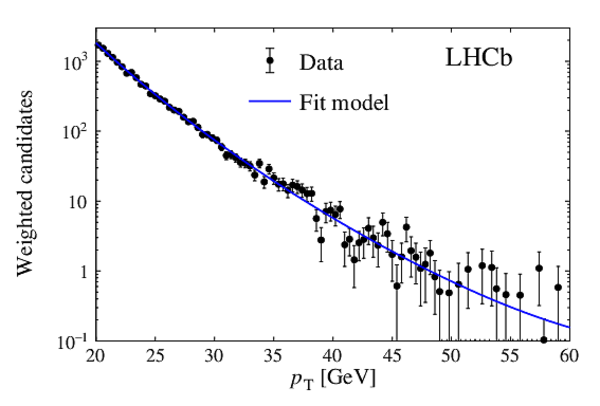
Weighted $ p_{\mathrm{T}}$ spectra of the samples of (left) positively and (right) negatively charged hadron candidates. The fit results are overlaid. |
Fig6a.pdf [22 KiB] HiDef png [161 KiB] Thumbnail [136 KiB] *.C file |

|
|
Fig6b.pdf [22 KiB] HiDef png [160 KiB] Thumbnail [136 KiB] *.C file |
|
|
|
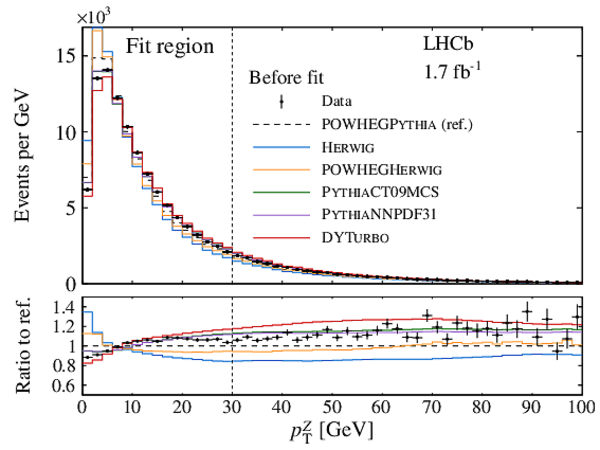
Distributions of $ p_{\mathrm{T}} ^Z$ (left) before and (right) after the fit for the different candidate models of the unpolarised cross-sections. The fit only considers the region $ p_{\mathrm{T}} ^Z < 30\text{ Ge V} $, indicated by the dashed vertical line. In the lower panels the ratios with respect to the POWHEGPythia model are shown. |
Fig7a.pdf [24 KiB] HiDef png [279 KiB] Thumbnail [229 KiB] *.C file |
|
|
Fig7b.pdf [24 KiB] HiDef png [261 KiB] Thumbnail [204 KiB] *.C file |

|
|
|
Distribution of $ p_{\mathrm{T}} ^Z$ compared to the POWHEGPythia model prior to the parametric correction, which is delineated by the red line in the lower panel. |
Fig8.pdf [21 KiB] HiDef png [215 KiB] Thumbnail [174 KiB] *.C file |

|
|
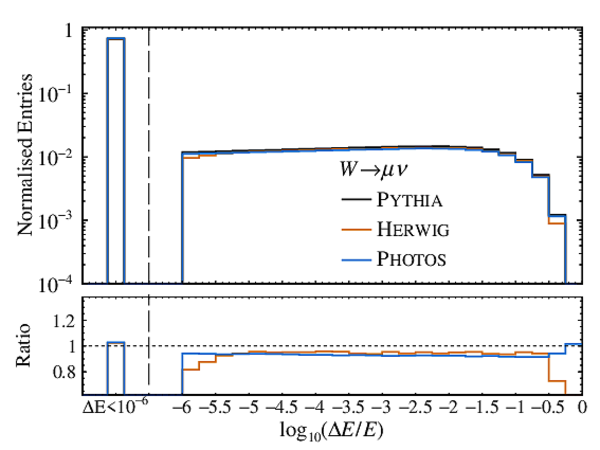
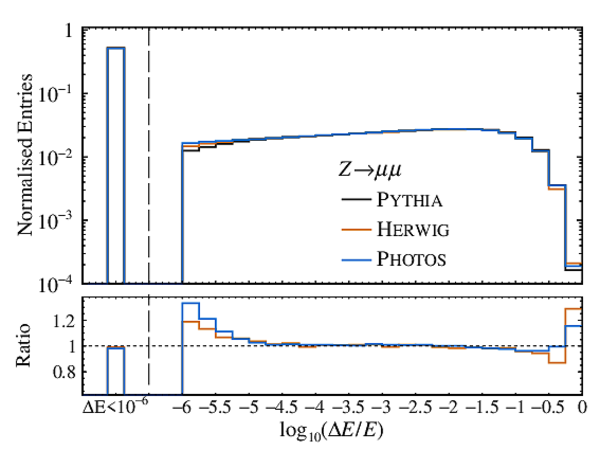
Logarithm of the relative energy loss of the dilepton system due to final-state radiation for (left) $ W$ boson events and (right) $ Z$ boson events. An energy loss of below $10^{-6}$ is considered unresolvable and is accounted for in the underflow bin to the left of the dashed vertical line. In the lower panel the ratio with respect to Pythia is shown. |
Fig9a.pdf [17 KiB] HiDef png [168 KiB] Thumbnail [148 KiB] *.C file |
|
|
Fig9b.pdf [17 KiB] HiDef png [172 KiB] Thumbnail [148 KiB] *.C file |
|
|
|
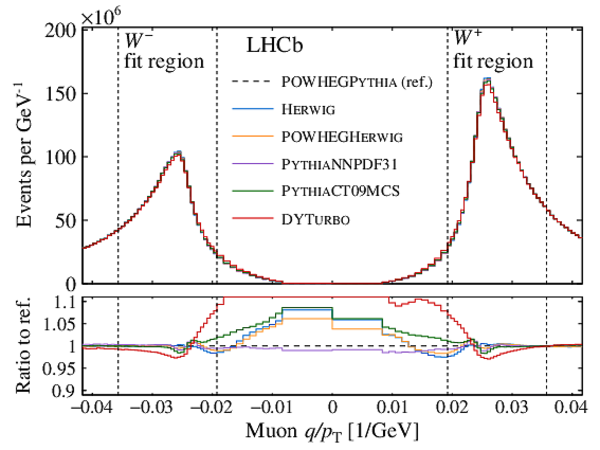
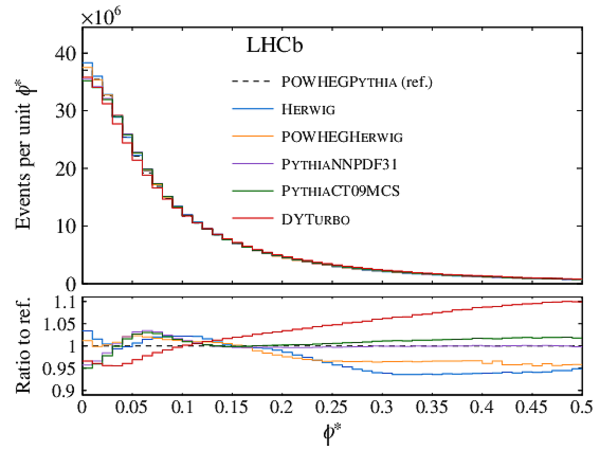
Projections of the (left) $q/ p_{\mathrm{T}} $ and (right) $\phi^*$ distributions for the challenge datasets. The four dashed vertical lines indicate the two fit regions in the $q/ p_{\mathrm{T}} $ distribution. |
Fig10a.pdf [22 KiB] HiDef png [315 KiB] Thumbnail [248 KiB] *.C file |
|
|
Fig10b.pdf [17 KiB] HiDef png [211 KiB] Thumbnail [174 KiB] *.C file |
|
|
|
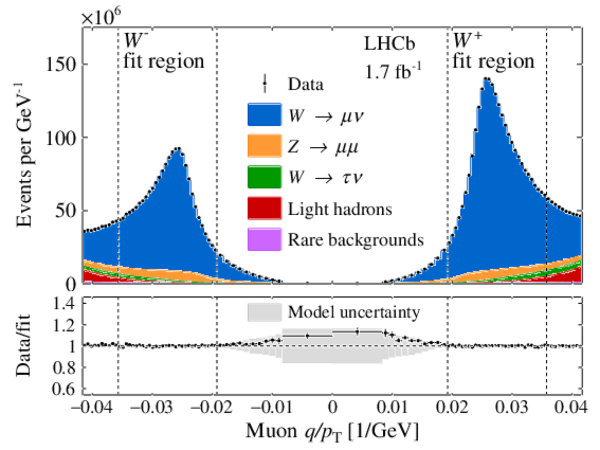
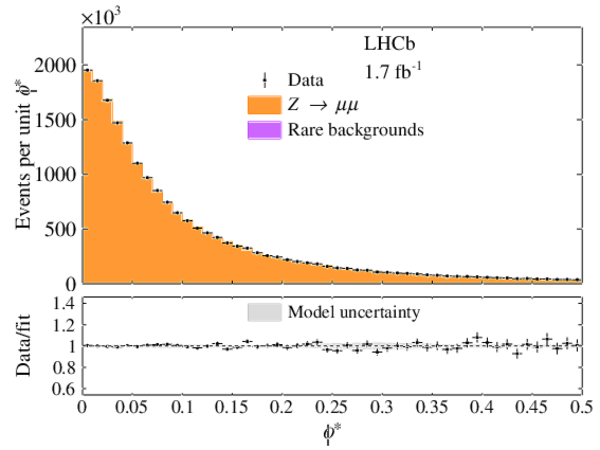
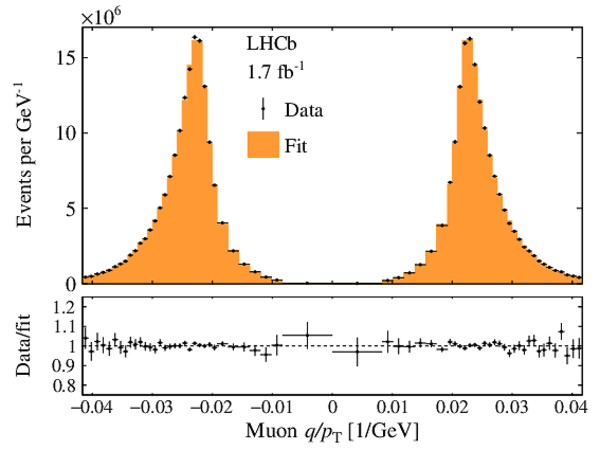
Distributions of (left) $q/ p_{\mathrm{T}} $ and (right) $\phi^{\ast}$ compared to the model after the $m_W$ fit. |
Fig11a.pdf [34 KiB] HiDef png [386 KiB] Thumbnail [289 KiB] *.C file |
|
|
Fig11b.pdf [21 KiB] HiDef png [245 KiB] Thumbnail [173 KiB] *.C file |
|
|
|
Projections of the (left) $q/ p_{\mathrm{T}} $ and (right) rapidity distributions for the $ Z$ boson selection. A final state muon is only included in the $q/ p_{\mathrm{T}} $ distribution if it satisfies the $ W$ boson selection requirements. |
Fig12a.pdf [22 KiB] HiDef png [175 KiB] Thumbnail [148 KiB] *.C file |
|
|
Fig12b.pdf [17 KiB] HiDef png [144 KiB] Thumbnail [130 KiB] *.C file |

|
|
|
Measured value of $m_W$ compared to those from the ALEPH [62], DELPHI [63], L3 [64], OPAL [65], CDF [10], D0 [11] and ATLAS [12] experiments. The current prediction of $m_W$ from the global electroweak fit is also included. |
Fig13.pdf [14 KiB] HiDef png [169 KiB] Thumbnail [113 KiB] *.C file |

|
|
Animated gif made out of all figures. |
PAPER-2021-024.gif Thumbnail |

|
![HiDef png [269 KiB]](Directory_LHCb-PAPER-2021-024/hidef_Fig1a.png)
![HiDef png [231 KiB]](Directory_LHCb-PAPER-2021-024/hidef_Fig1b.png)
![HiDef png [408 KiB]](Directory_LHCb-PAPER-2021-024/hidef_Fig2a.png)
![HiDef png [273 KiB]](Directory_LHCb-PAPER-2021-024/hidef_Fig2b.png)
![HiDef png [208 KiB]](Directory_LHCb-PAPER-2021-024/hidef_Fig3a.png)
![HiDef png [178 KiB]](Directory_LHCb-PAPER-2021-024/hidef_Fig3b.png)
![HiDef png [168 KiB]](Directory_LHCb-PAPER-2021-024/hidef_Fig3c.png)
![HiDef png [341 KiB]](Directory_LHCb-PAPER-2021-024/hidef_Fig4.png)
![HiDef png [214 KiB]](Directory_LHCb-PAPER-2021-024/hidef_Fig5a.png)
![HiDef png [191 KiB]](Directory_LHCb-PAPER-2021-024/hidef_Fig5b.png)
![HiDef png [161 KiB]](Directory_LHCb-PAPER-2021-024/hidef_Fig6a.png)
![HiDef png [160 KiB]](Directory_LHCb-PAPER-2021-024/hidef_Fig6b.png)
![HiDef png [279 KiB]](Directory_LHCb-PAPER-2021-024/hidef_Fig7a.png)
![HiDef png [261 KiB]](Directory_LHCb-PAPER-2021-024/hidef_Fig7b.png)
![HiDef png [215 KiB]](Directory_LHCb-PAPER-2021-024/hidef_Fig8.png)
![HiDef png [168 KiB]](Directory_LHCb-PAPER-2021-024/hidef_Fig9a.png)
![HiDef png [172 KiB]](Directory_LHCb-PAPER-2021-024/hidef_Fig9b.png)
![HiDef png [315 KiB]](Directory_LHCb-PAPER-2021-024/hidef_Fig10a.png)
![HiDef png [211 KiB]](Directory_LHCb-PAPER-2021-024/hidef_Fig10b.png)
![HiDef png [386 KiB]](Directory_LHCb-PAPER-2021-024/hidef_Fig11a.png)
![HiDef png [245 KiB]](Directory_LHCb-PAPER-2021-024/hidef_Fig11b.png)
![HiDef png [175 KiB]](Directory_LHCb-PAPER-2021-024/hidef_Fig12a.png)
![HiDef png [144 KiB]](Directory_LHCb-PAPER-2021-024/hidef_Fig12b.png)
![HiDef png [169 KiB]](Directory_LHCb-PAPER-2021-024/hidef_Fig13.png)
Tables and captions
|
Parameters in the momentum smearing model where the uncertainties quoted are statistical. |
Table_1.pdf [68 KiB] HiDef png [73 KiB] Thumbnail [37 KiB] tex code |

|
|
Results of fits of different models to the $ p_{\mathrm{T}} ^Z$ distribution. The uncertainties quoted are statistical, and the $\chi^2$ comparison of the different models to the data is evaluated considering only statistical uncertainties. The right-hand column lists the fit values of the $ k_{\rm T}^{\rm intr}$ parameter or, for DYTurbo , the analogous $g$ parameter. The fit with DYTurbo has one more degree of freedom than the fits with the other models since only one tuning parameter ($g$) is used for DYTurbo . |
Table_2.pdf [74 KiB] HiDef png [78 KiB] Thumbnail [36 KiB] tex code |

|
|
Fit results with the same default fit model used for the templates but with different models used for the pseudodata. The POWHEGPythia pseudodata correspond to $\alpha_s=0.125$ and $ k_{\rm T}^{\rm intr} =1.8\text{ Ge V} $. The Herwig and POWHEGHerwig pseudodata correspond to $\alpha_s=0.136$ and $ k_{\rm T}^{\rm intr}$ =1.3 $\text{ Ge V}$ . The Pythia pseudodata correspond to $\alpha_s=0.127$ and $ k_{\rm T}^{\rm intr} =2.7\text{ Ge V} $. The DYTurbo pseudodata correspond to $\alpha_s=0.118$ and $g=1\text{ Ge V} ^2$. The contributions to the total $\chi^2$ from the $q/ p_{\mathrm{T}} $ and $\phi^*$ distributions are denoted $\chi^2_W$ and $\chi^2_Z$, respectively. The shift in the $m_W$ value with respect to the POWHEGPythia pseudodata is denoted $\delta m_W$. The uncertainties quoted are statistical. |
Table_3.pdf [75 KiB] HiDef png [72 KiB] Thumbnail [30 KiB] tex code |

|
|
Values of the parameters determined in the $m_W$ fit with the \texttt{NNPDF31\_nlo\_as\_0118} PDF set. The uncertainties quoted are statistical. |
Table_4.pdf [72 KiB] HiDef png [85 KiB] Thumbnail [40 KiB] tex code |

|
|
Uncertainties for the NNPDF3.1, CT18 and MSHT20 sets. The contributions from the PDF uncertainty with fixed $\alpha_s$ and from the $\alpha_s$ variation are quoted separately as is their sum in quadrature, which defines the total uncertainty for each PDF set. |
Table_5.pdf [60 KiB] HiDef png [26 KiB] Thumbnail [12 KiB] tex code |

|
|
Contributions to the systematic uncertainty in $m_W$. Negligible contributions below $1 \text{ Me V} $ are not listed. |
Table_6.pdf [37 KiB] HiDef png [38 KiB] Thumbnail [44 KiB] tex code |

|
|
Fit results where the data and simulation samples are split into two orthogonal subsets. For a given split, the first row is defined as the reference with respect to which the difference in $m_W$, denoted by $\delta m_W$, is defined. The uncertainties quoted on $\delta m_W$ are statistical. |
Table_7.pdf [63 KiB] HiDef png [114 KiB] Thumbnail [56 KiB] tex code |

|
|
Fit results with variations in the fit range around the default $ p_{\mathrm{T}} ^{\rm min} = 28$ $\text{ Ge V}$ and $ p_{\mathrm{T}} ^{\rm min} = 52$ $\text{ Ge V}$ . The second column lists the $\chi^2$ values, the third column lists the shifts in $m_W$ with respect to the default fit and the third column lists the statistical uncertainties in $m_W$. |
Table_8.pdf [64 KiB] HiDef png [80 KiB] Thumbnail [38 KiB] tex code |

|
|
Fit results with variations in which physics parameters are varying freely. |
Table_9.pdf [66 KiB] HiDef png [57 KiB] Thumbnail [21 KiB] tex code |

|
![HiDef png [73 KiB]](Directory_LHCb-PAPER-2021-024/hidef_Table_1.png)
![HiDef png [78 KiB]](Directory_LHCb-PAPER-2021-024/hidef_Table_2.png)
![HiDef png [72 KiB]](Directory_LHCb-PAPER-2021-024/hidef_Table_3.png)
![HiDef png [85 KiB]](Directory_LHCb-PAPER-2021-024/hidef_Table_4.png)
![HiDef png [26 KiB]](Directory_LHCb-PAPER-2021-024/hidef_Table_5.png)
![HiDef png [38 KiB]](Directory_LHCb-PAPER-2021-024/hidef_Table_6.png)
![HiDef png [114 KiB]](Directory_LHCb-PAPER-2021-024/hidef_Table_7.png)
![HiDef png [80 KiB]](Directory_LHCb-PAPER-2021-024/hidef_Table_8.png)
![HiDef png [57 KiB]](Directory_LHCb-PAPER-2021-024/hidef_Table_9.png)
Supplementary Material [file]
|
This ZIP file contains supplementary material for LHCb-PAPER-2021-024 supplementary.pdf: The supplementary material available on CDS with captions *.pdf, *.eps, *.png, *.C: Each figure in multiple formats |
FigS1a.pdf [23 KiB] HiDef png [352 KiB] Thumbnail [289 KiB] *C file |
|
|
FigS1b.pdf [23 KiB] HiDef png [340 KiB] Thumbnail [288 KiB] *C file |
|
|
|
FigS1c.pdf [23 KiB] HiDef png [327 KiB] Thumbnail [276 KiB] *C file |
|
|
|
FigS2.pdf [19 KiB] HiDef png [208 KiB] Thumbnail [143 KiB] *C file |
|
|
|
FigS3.pdf [20 KiB] HiDef png [256 KiB] Thumbnail [155 KiB] *C file |

|
|
|
FigS4.pdf [277 KiB] HiDef png [1 MiB] Thumbnail [559 KiB] *C file |
|
|
|
FigS5.pdf [225 KiB] HiDef png [1 MiB] Thumbnail [559 KiB] *C file |

|
|
|
FigS6.pdf [156 KiB] HiDef png [92 KiB] Thumbnail [86 KiB] *C file |

|
![HiDef png [352 KiB]](Directory_LHCb-PAPER-2021-024/supplementary/hidef_FigS1a.png)
![HiDef png [340 KiB]](Directory_LHCb-PAPER-2021-024/supplementary/hidef_FigS1b.png)
![HiDef png [327 KiB]](Directory_LHCb-PAPER-2021-024/supplementary/hidef_FigS1c.png)
![HiDef png [208 KiB]](Directory_LHCb-PAPER-2021-024/supplementary/hidef_FigS2.png)
![HiDef png [256 KiB]](Directory_LHCb-PAPER-2021-024/supplementary/hidef_FigS3.png)
![HiDef png [1 MiB]](Directory_LHCb-PAPER-2021-024/supplementary/hidef_FigS4.png)
![HiDef png [1 MiB]](Directory_LHCb-PAPER-2021-024/supplementary/hidef_FigS5.png)
![HiDef png [92 KiB]](Directory_LHCb-PAPER-2021-024/supplementary/hidef_FigS6.png)
Created on 18 May 2024.