Measurement of the $D^*$ longitudinal polarization in $B^0 \to D^{* -}\tau^+\nu_{\tau}$ decays
[to restricted-access page]Information
LHCb-PAPER-2023-020
CERN-EP-2023-225
arXiv:2311.05224 [PDF]
(Submitted on 09 Nov 2023)
PRD
Inspire 2723079
Tools
Abstract
The longitudinal polarization fraction of the $D^{*}$ meson is measured in $B^0\to D^{*-}\tau^{+}\nu_{\tau}$ decays, where the $\tau$ lepton decays to three charged pions and a neutrino, using proton-proton collision data collected by the LHCb experiment at center-of-mass energies of 7, 8 and 13 TeV and corresponding to an integrated luminosity of 5 fb$^{-1}$. The $D^{*}$ polarization fraction $F_{L}^{D^{*}}$ is measured in two $q^{2}$ regions, below and above 7 GeV$^{2}/c^{4}$, where $q^{2}$ is defined as the squared invariant mass of the $\tau\nu_{\tau}$ system. The $F_{L}^{D^{*}}$ values are measured to be $0.51 \pm 0.07 \pm 0.03$ and $0.35 \pm 0.08 \pm 0.02$ for the lower and higher $q^{2}$ regions, respectively. The first uncertainties are statistical and the second systematic. The average value over the whole $q^{2}$ range is: $$F_{L}^{D^{*}} = 0.43 \pm 0.06 \pm 0.03.$$ These results are compatible with the Standard Model predictions.
Figures and captions
|
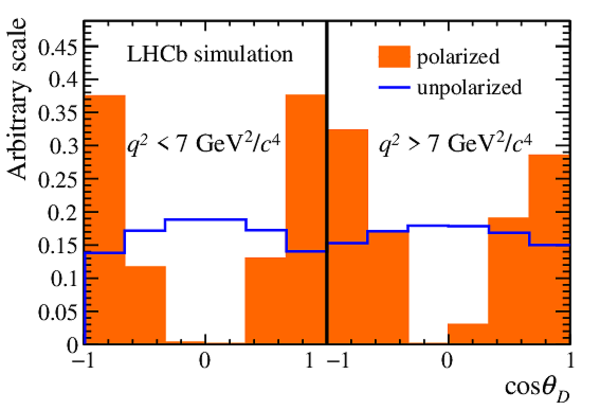
Signal distributions of the $\cos\theta_{D}$ variable in the two $ q^2$ regions for the unpolarized and polarized components. The template for the unpolarized component is distorted by the effect of the reconstruction and the signal selection. |
Fig1.pdf [14 KiB] HiDef png [152 KiB] Thumbnail [150 KiB] *.C file |
|
|
Simulated (left) $ q^2$ and (right) $\cos\theta_{D}$ distributions for the $ B \rightarrow D ^{*-} D ^0 (X)$ control sample before and after the correction for the data-simulation differences in the Run 2 weighted data sample. The $ B \rightarrow D ^{*-} D ^0 (X)$ sample is selected using the isolation algorithm to search for an extra kaon around the $3\pi$ vertex. |
Fig2a.pdf [15 KiB] HiDef png [125 KiB] Thumbnail [113 KiB] *.C file |

|
|
Fig2b.pdf [14 KiB] HiDef png [151 KiB] Thumbnail [124 KiB] *.C file |

|
|
|
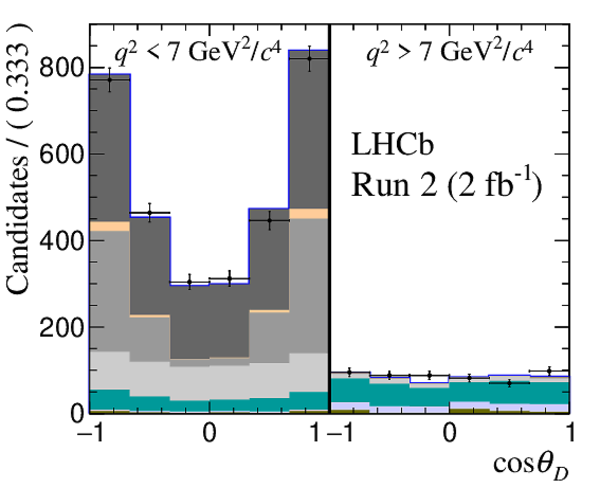
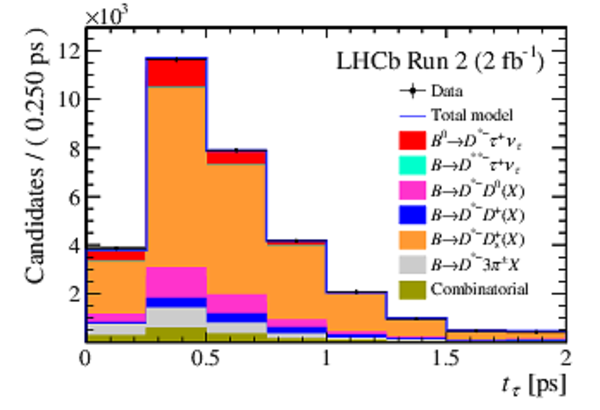
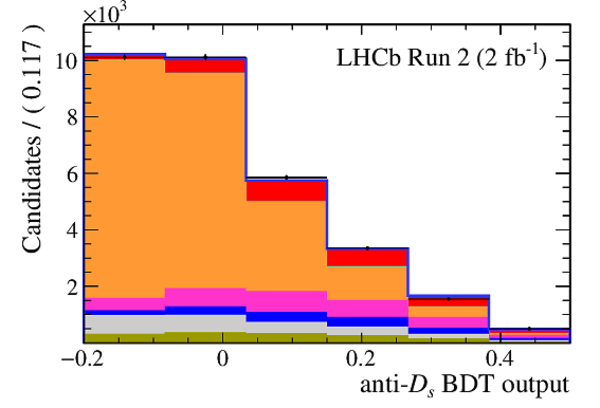
Distribution of the key analysis variables obtained in the $ B \rightarrow D ^{*-} D ^+_ s (X)$ enhanced Run 2 data sample with the result of the fit superimposed: (top left) $m( D ^* 3\pi)$, (top right) anti- $ D ^+_ s $ BDT output, (middle left) $t_{\tau}$, (middle right) $ q^2$ and (bottom) $\cos\theta_{D}$ . |
Fig3a.pdf [30 KiB] HiDef png [230 KiB] Thumbnail [196 KiB] *.C file |

|
|
Fig3b.pdf [18 KiB] HiDef png [173 KiB] Thumbnail [157 KiB] *.C file |

|
|
|
Fig3c.pdf [18 KiB] HiDef png [178 KiB] Thumbnail [177 KiB] *.C file |

|
|
|
Fig3d.pdf [32 KiB] HiDef png [238 KiB] Thumbnail [202 KiB] *.C file |

|
|
|
Fig3e.pdf [15 KiB] HiDef png [163 KiB] Thumbnail [155 KiB] *.C file |
|
|
|
Fig3f.pdf [13 KiB] HiDef png [201 KiB] Thumbnail [206 KiB] *.C file |
|
|
|
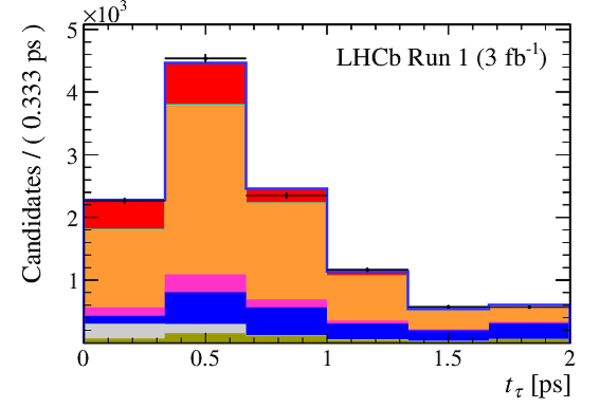
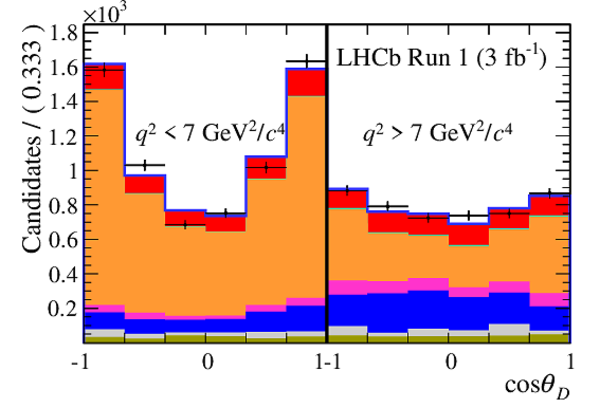
Distributions of the fit variables in the (left) Run 1 and (right) Run 2 datasets with the fit results superimposed. |
Fig4a.pdf [15 KiB] HiDef png [102 KiB] Thumbnail [95 KiB] *.C file |
|
|
fig4b.pdf [25 KiB] HiDef png [173 KiB] Thumbnail [215 KiB] *.C file |
|
|
|
Fig4c.pdf [17 KiB] HiDef png [154 KiB] Thumbnail [148 KiB] *.C file |
|
|
|
Fig4d.pdf [16 KiB] HiDef png [135 KiB] Thumbnail [129 KiB] *.C file |

|
|
|
Fig4e.pdf [14 KiB] HiDef png [116 KiB] Thumbnail [110 KiB] *.C file |

|
|
|
Fig4f.pdf [15 KiB] HiDef png [112 KiB] Thumbnail [104 KiB] *.C file |
|
|
|
Animated gif made out of all figures. |
PAPER-2023-020.gif Thumbnail |

|
![HiDef png [152 KiB]](Directory_LHCb-PAPER-2023-020/hidef_Fig1.png)
![HiDef png [125 KiB]](Directory_LHCb-PAPER-2023-020/hidef_Fig2a.png)
![HiDef png [151 KiB]](Directory_LHCb-PAPER-2023-020/hidef_Fig2b.png)
![HiDef png [230 KiB]](Directory_LHCb-PAPER-2023-020/hidef_Fig3a.png)
![HiDef png [173 KiB]](Directory_LHCb-PAPER-2023-020/hidef_Fig3b.png)
![HiDef png [178 KiB]](Directory_LHCb-PAPER-2023-020/hidef_Fig3c.png)
![HiDef png [238 KiB]](Directory_LHCb-PAPER-2023-020/hidef_Fig3d.png)
![HiDef png [163 KiB]](Directory_LHCb-PAPER-2023-020/hidef_Fig3e.png)
![HiDef png [201 KiB]](Directory_LHCb-PAPER-2023-020/hidef_Fig3f.png)
![HiDef png [102 KiB]](Directory_LHCb-PAPER-2023-020/hidef_Fig4a.png)
![HiDef png [173 KiB]](Directory_LHCb-PAPER-2023-020/hidef_fig4b.png)
![HiDef png [154 KiB]](Directory_LHCb-PAPER-2023-020/hidef_Fig4c.png)
![HiDef png [135 KiB]](Directory_LHCb-PAPER-2023-020/hidef_Fig4d.png)
![HiDef png [116 KiB]](Directory_LHCb-PAPER-2023-020/hidef_Fig4e.png)
![HiDef png [112 KiB]](Directory_LHCb-PAPER-2023-020/hidef_Fig4f.png)
Tables and captions
|
List of all the requirements included in the signal selection. |
Table_1.pdf [65 KiB] HiDef png [153 KiB] Thumbnail [70 KiB] tex code |

|
|
Decay fractions for the $ B \rightarrow D ^{*-} D ^+_ s (X)$ decays, normalized for the $ B ^0 \rightarrow D ^{*-} D ^{*+}_ s $ yield, obtained from the Run 1 and Run 2 control samples. |
Table_2.pdf [88 KiB] HiDef png [87 KiB] Thumbnail [41 KiB] tex code |

|
|
Fit results for the Run 1 and Run 2 datasets. |
[Error creating the table] | |
|
Values of $ a_{\theta_D}(q^2)$ , $ c_{\theta_D}(q^2)$ and $ F_L^{ D ^* }$ from the fit. |
Table_4.pdf [75 KiB] HiDef png [34 KiB] Thumbnail [18 KiB] tex code |

|
|
Summary of the systematic uncertainties related to the $ D ^{*-}$ polarization measurement. |
Table_5.pdf [79 KiB] HiDef png [140 KiB] Thumbnail [47 KiB] tex code |

|
![HiDef png [153 KiB]](Directory_LHCb-PAPER-2023-020/hidef_Table_1.png)
![HiDef png [87 KiB]](Directory_LHCb-PAPER-2023-020/hidef_Table_2.png)
![HiDef png [34 KiB]](Directory_LHCb-PAPER-2023-020/hidef_Table_4.png)
![HiDef png [140 KiB]](Directory_LHCb-PAPER-2023-020/hidef_Table_5.png)
Created on 18 May 2024.