Information
LHCb-DP-2016-003
arXiv:1801.04281 [PDF]
(Submitted on 12 Jan 2018)
JINST 13 (2018) no.04, P04017
Inspire 1648146
Tools
Abstract
The HeRSCheL detector consists of a set of scintillating counters, designed to increase the coverage of the LHCb experiment in the high-rapidity regions on either side of the main spectrometer. The new detector improves the capabilities of LHCb for studies of diffractive interactions, most notably Central Exclusive Production. In this paper the construction, installation, commissioning, and performance of HeRSCheL are presented.
Figures and captions
|
Feynman diagrams of diffractive-production mechanisms of $J/\psi$ mesons at the LHC, where the double gluon system being emitted from the beam proton constitutes the pomeron. (a) is the pure CEP process, (b) has additional gluon radiation, and (c) and (d) involve proton dissociation. (Taken from Ref. [5]). |
fig1.pdf [134 KiB] HiDef png [156 KiB] Thumbnail [49 KiB] |

|
|
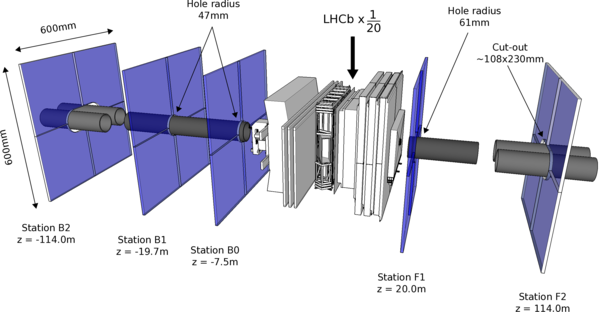
Layout of the active areas of the HeRSCheL stations around the LHCb interaction point (IP8), where for illustration the HeRSCheL stations have been magnified by a factor of 20 with respect to the rest of the LHCb detector. $z$-axis not to scale. |
fig2.png [396 KiB] HiDef png [225 KiB] Thumbnail [96 KiB] |
|
|
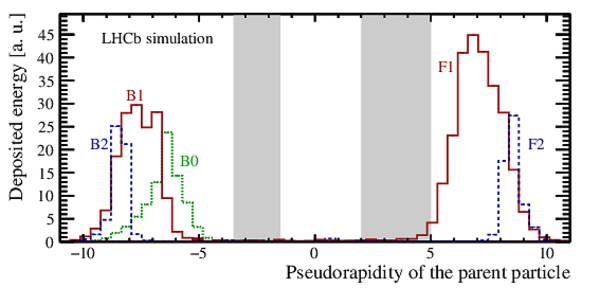
Energy deposit in the scintillators as a function of the pseudorapidity of the parent particle that caused the shower. The grey areas indicate the nominal pseudorapidity coverage of LHCb. |
fig3.pdf [26 KiB] HiDef png [178 KiB] Thumbnail [143 KiB] |
|
|
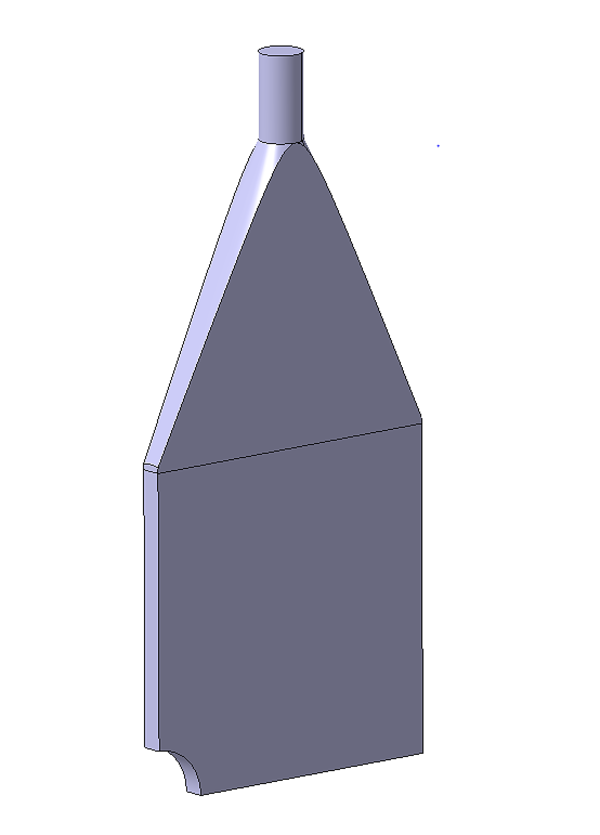
Schematic design of the scintillator and light guide of a single quadrant of B0/B1-type (47 mm inner radius), accompanied by a photograph of a B2/F2-type quadrant with the PMT and `clipping cable' attached. |
fig4_left.png [15 KiB] HiDef png [89 KiB] Thumbnail [29 KiB] |
|
|
fig4_right.jpg [185 KiB] HiDef png [3 MiB] Thumbnail [764 KiB] |

|
|
|
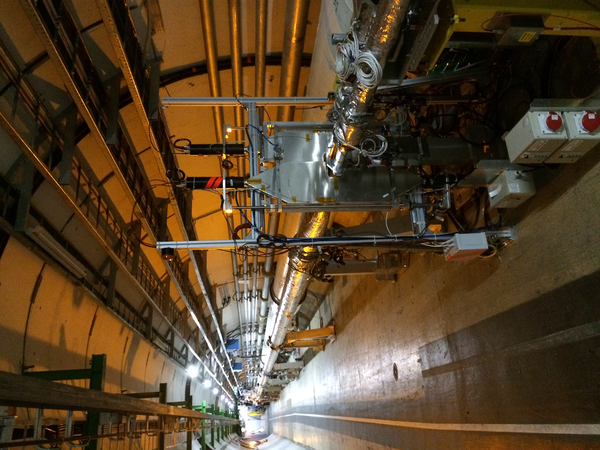
Visualisation of a HeRSCheL station in its nominal data-taking position and in its parking position, when the detectors are retracted and rotated. |
fig5_left.png [48 KiB] HiDef png [344 KiB] Thumbnail [127 KiB] |

|
|
fig5_right.png [55 KiB] HiDef png [448 KiB] Thumbnail [182 KiB] |

|
|
|
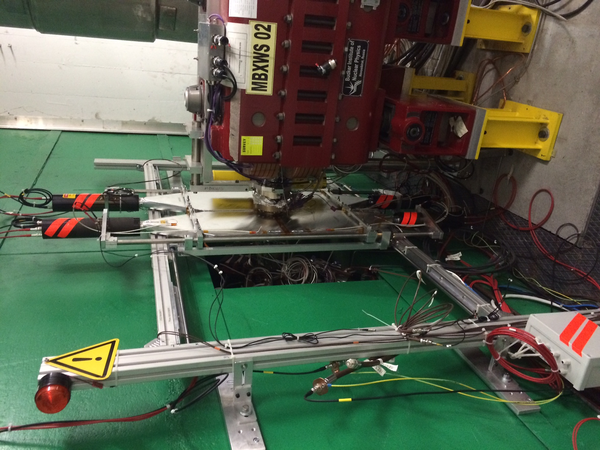
Photographs of the backward HeRSCheL stations B0, B1, and B2, respectively. |
fig6_left.jpg [720 KiB] HiDef png [2 MiB] Thumbnail [488 KiB] |

|
|
fig6_m[..].jpg [657 KiB] HiDef png [2 MiB] Thumbnail [471 KiB] |

|
|
|
fig6_right.jpg [675 KiB] HiDef png [2 MiB] Thumbnail [481 KiB] |
|
|
|
Photographs of the forward HeRSCheL stations F1 and F2, respectively. |
fig7_left.jpg [597 KiB] HiDef png [2 MiB] Thumbnail [438 KiB] |
|
|
fig7_right.jpg [669 KiB] HiDef png [2 MiB] Thumbnail [472 KiB] |
|
|
|
Block diagram of the readout, powering, and control of the FSC detectors. The diagram shows only one quadrant and one of the two front-end crates. |
fig8.pdf [13 KiB] HiDef png [287 KiB] Thumbnail [186 KiB] |

|
|
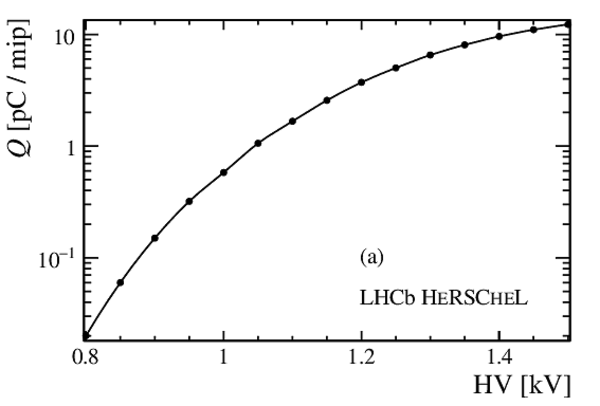
(a) shows the signal per particle as a function of PMT high voltage for one of the quadrants of station B0. The absolute scale is determined using measurements with cosmic muons, and the evolution with high voltage using a pulsed LED setup. The analogue signal of one quadrant of station B0, recorded during injection tests (`TED shots') in November 2014, is shown in (b). |
fig9_left.pdf [13 KiB] HiDef png [67 KiB] Thumbnail [40 KiB] |
|
|
fig9_right.pdf [16 KiB] HiDef png [171 KiB] Thumbnail [81 KiB] |

|
|
|
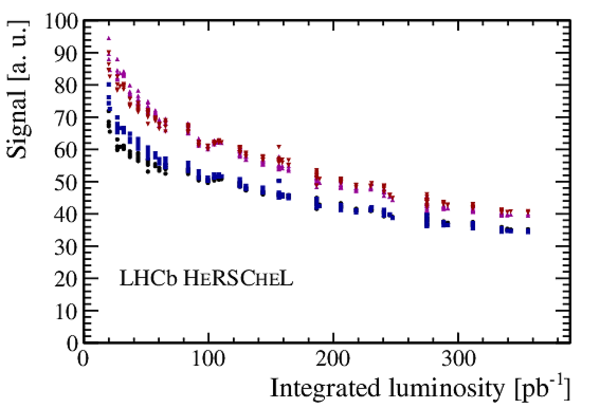
Average signal in $pp$ collisions as a function of integrated luminosity in 2015, for the four quadrants of station B0. The high-voltage settings were kept the same throughout the entire 2015 data-taking period. |
fig10.pdf [27 KiB] HiDef png [187 KiB] Thumbnail [164 KiB] |
|
|
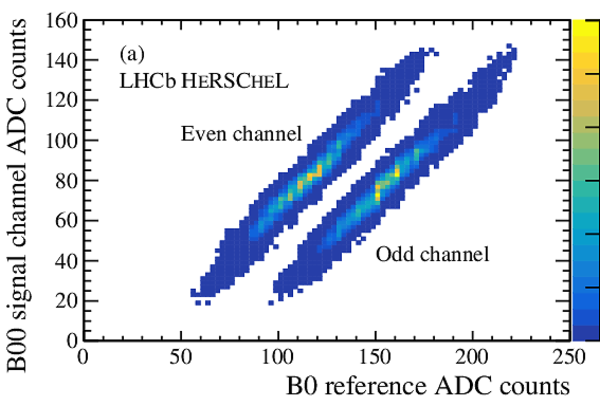
Subtraction of common noise. (a) illustrates the correlated noise for the two integrator channels reading out one detector quadrant on station B0 in 2015 end-of-fill data, with respect to the signal in the spare cable (B0 reference), not connected at the detector end. (b) compares the raw signal in end-of-fill data taken during 2015 (red/darker filled histograms) with that after common-noise subtraction (blue filled histogram) and the raw signal RMS with the new adapter board in 2016 (dashed histogram). Each station houses four PMTs, read out via the dual-channel VFE board, and there are therefore eight channels to consider for each station. The relatively large contribution of uncorrelated noise to the signal in the B2 station was the result of imperfect grounding; this was resolved at the end of 2015. |
fig11_left.pdf [20 KiB] HiDef png [310 KiB] Thumbnail [285 KiB] |
|
|
fig11_[..].pdf [14 KiB] HiDef png [202 KiB] Thumbnail [182 KiB] |

|
|
|
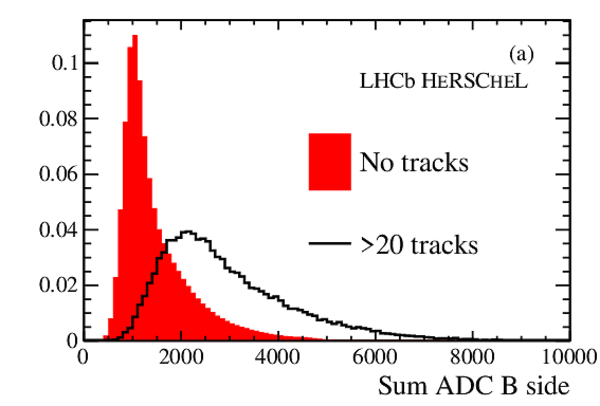
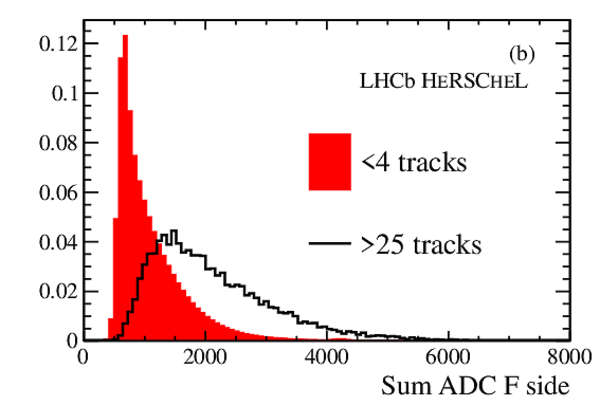
Correlation between sum of raw HeRSCheL ADC counts on (a) the B side and (b) the F side of the interaction point, with reconstructed tracks on the same side. |
fig12_left.pdf [14 KiB] HiDef png [132 KiB] Thumbnail [129 KiB] |
|
|
fig12_[..].pdf [14 KiB] HiDef png [128 KiB] Thumbnail [128 KiB] |
|
|
|
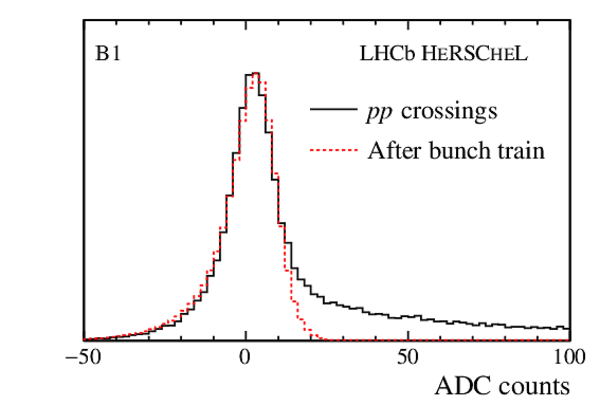
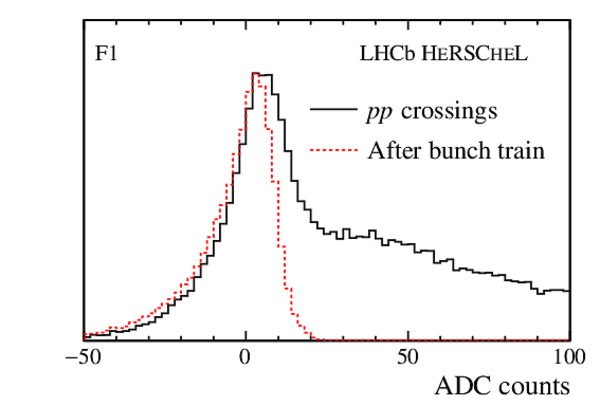
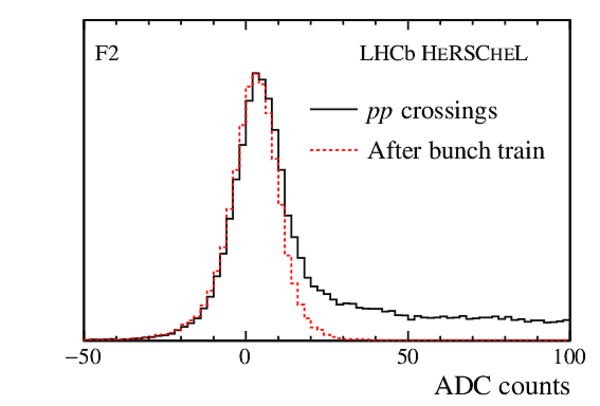
Activity registered, after calibration, in one integrator attached to one counter for each HeRSCheL detector station during beam-beam crossings in the solid histogram, showing only the range up to 100 ADC counts. The empty-detector signal recorded after a bunch train is represented by the dotted histogram. |
fig13_1.pdf [13 KiB] HiDef png [125 KiB] Thumbnail [101 KiB] |

|
|
fig13_2.pdf [14 KiB] HiDef png [126 KiB] Thumbnail [104 KiB] |
|
|
|
fig13_3.pdf [14 KiB] HiDef png [122 KiB] Thumbnail [106 KiB] |

|
|
|
fig13_4.pdf [14 KiB] HiDef png [122 KiB] Thumbnail [107 KiB] |
|
|
|
fig13_5.pdf [14 KiB] HiDef png [124 KiB] Thumbnail [103 KiB] |
|
|
|
Distribution of HeRSCheL metric for events immediately following a bunch train (black line), representative of the response of the detector to CEP signal. The efficiency for an upper limit on the metric for retention of these events is also shown (red line). |
fig14.pdf [14 KiB] HiDef png [120 KiB] Thumbnail [105 KiB] |

|
|
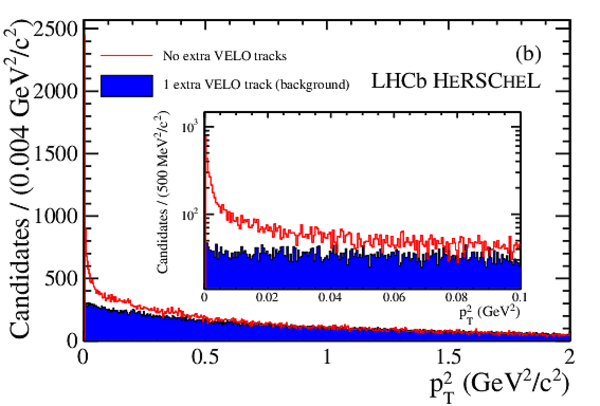
Selected continuum-dimuon sample. In (a) is shown the invariant mass distribution of dimuon candidates. The shaded regions of resonant production are excluded. In (b) is shown the full $p^2_{\rm T}$ distribution of the selected dimuon candidates. Since the signal is expected to be concentrated chiefly below 0.1 $ {\mathrm{ Ge V^2 /}c^2}$ , the candidates below this threshold are shown in the inset histogram. For both regions, an additional histogram is superimposed, corresponding to the distribution of candidates in a background sample. |
fig15_left.pdf [24 KiB] HiDef png [204 KiB] Thumbnail [154 KiB] |

|
|
fig15_[..].pdf [29 KiB] HiDef png [286 KiB] Thumbnail [222 KiB] |
|
|
|
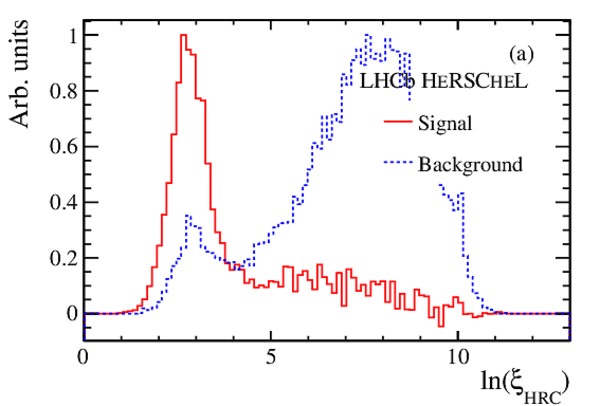
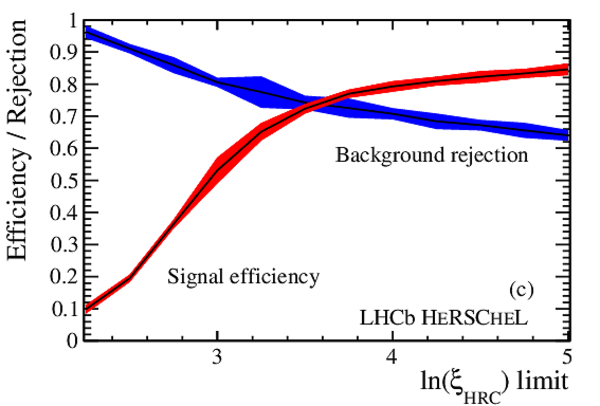
In (a) the distribution of $\ln(\xi_{\rm HRC})$ is shown for CEP (solid line) and non-CEP (dashed line) continuum-dimuon candidates. In (b) an example fit to the continuum-dimuon $p^2_{\rm T}$ distribution is shown, with the CEP signal template and double-exponential background indicated. In (c) the CEP signal efficiency and, for this process, background rejection are shown as a function of the limit chosen on $\ln(\xi_{\rm HRC})$. |
fig16_[..].pdf [14 KiB] HiDef png [148 KiB] Thumbnail [131 KiB] |
|
|
fig16_[..].pdf [16 KiB] HiDef png [177 KiB] Thumbnail [155 KiB] |
|
|
|
fig16_[..].pdf [14 KiB] HiDef png [208 KiB] Thumbnail [181 KiB] |
|
|
|
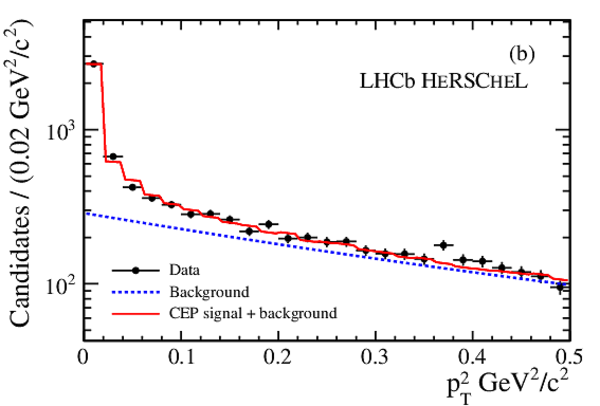
Effect on the $p^2_{\rm T}$ distribution of $ { J \mskip -3mu/\mskip -2mu\psi \mskip 2mu}$ CEP candidates of applying a limit of 4.9 on $\ln(\xi_{\rm HRC})$. This cut is expected to retain close to 100% of CEP signal which have no additional tracks due to pile-up or single diffractive events in the combined LHCb and HeRSCheL geometrical acceptance. This corresponds to about 84% of the events which would be accepted if only the LHCb geometrical acceptance was used. At this working point, the yield of non-CEP $ { J \mskip -3mu/\mskip -2mu\psi \mskip 2mu}$ candidates falls to nearly a third of the original value. |
fig17.pdf [15 KiB] HiDef png [129 KiB] Thumbnail [139 KiB] |
|
|
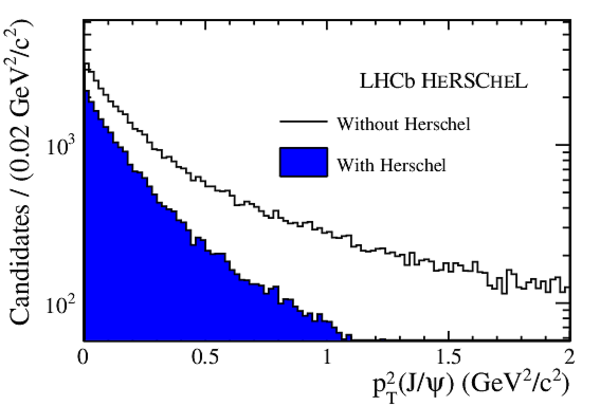
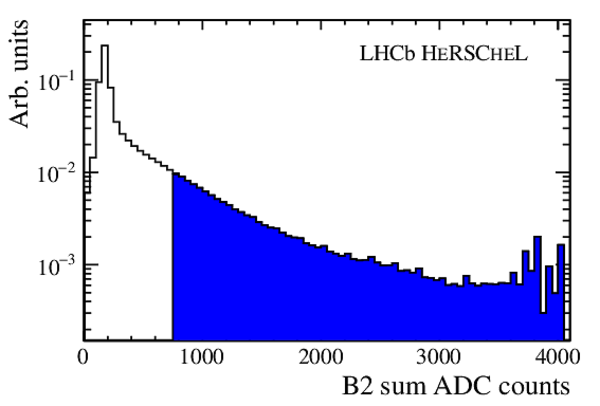
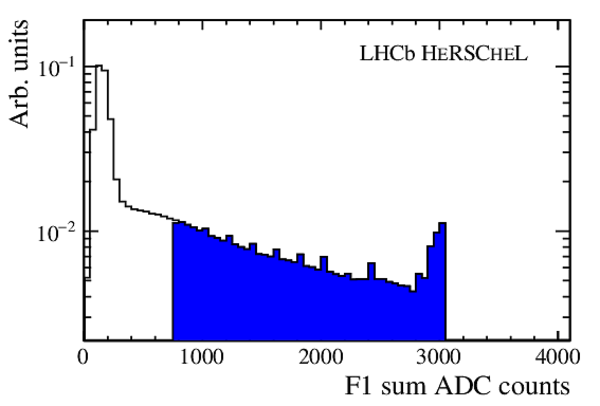
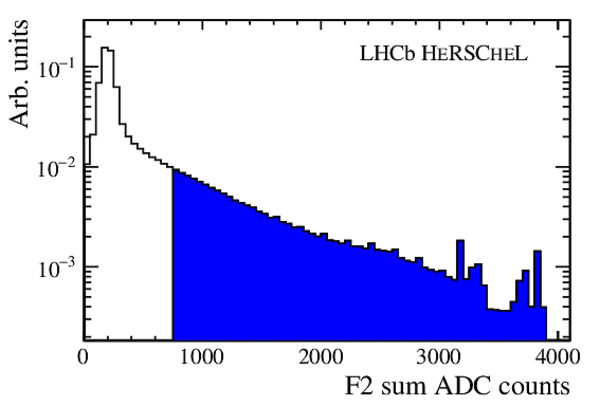
HeRSCheL in the LHCb software trigger. Distributions of the sum of ADC counts recorded by the four counters in each station. The portion of events rejected by the limit in each station is indicated by the filled region. |
fig18_1.pdf [14 KiB] HiDef png [131 KiB] Thumbnail [131 KiB] |

|
|
fig18_2.pdf [14 KiB] HiDef png [103 KiB] Thumbnail [105 KiB] |

|
|
|
fig18_3.pdf [14 KiB] HiDef png [104 KiB] Thumbnail [106 KiB] |
|
|
|
fig18_4.pdf [13 KiB] HiDef png [93 KiB] Thumbnail [93 KiB] |
|
|
|
fig18_5.pdf [14 KiB] HiDef png [103 KiB] Thumbnail [104 KiB] |
|
|
|
Animated gif made out of all figures. |
DP-2016-003.gif Thumbnail |

|
![HiDef png [156 KiB]](Directory_LHCb-DP-2016-003/hidef_fig1.png)
![fig2.png [396 KiB]](Directory_LHCb-DP-2016-003/fig2.png)
![HiDef png [225 KiB]](Directory_LHCb-DP-2016-003/hidef_fig2.png)
![HiDef png [178 KiB]](Directory_LHCb-DP-2016-003/hidef_fig3.png)
![fig4_left.png [15 KiB]](Directory_LHCb-DP-2016-003/fig4_left.png)
![HiDef png [89 KiB]](Directory_LHCb-DP-2016-003/hidef_fig4_left.png)
![fig4_right.jpg [185 KiB]](Directory_LHCb-DP-2016-003/fig4_right.jpg)
![HiDef png [3 MiB]](Directory_LHCb-DP-2016-003/hidef_fig4_right.png)
![fig5_left.png [48 KiB]](Directory_LHCb-DP-2016-003/fig5_left.png)
![HiDef png [344 KiB]](Directory_LHCb-DP-2016-003/hidef_fig5_left.png)
![fig5_right.png [55 KiB]](Directory_LHCb-DP-2016-003/fig5_right.png)
![HiDef png [448 KiB]](Directory_LHCb-DP-2016-003/hidef_fig5_right.png)
![fig6_left.jpg [720 KiB]](Directory_LHCb-DP-2016-003/fig6_left.jpg)
![HiDef png [2 MiB]](Directory_LHCb-DP-2016-003/hidef_fig6_left.png)
![fig6_m[..].jpg [657 KiB]](Directory_LHCb-DP-2016-003/fig6_middle.jpg)
![HiDef png [2 MiB]](Directory_LHCb-DP-2016-003/hidef_fig6_middle.png)
![fig6_right.jpg [675 KiB]](Directory_LHCb-DP-2016-003/fig6_right.jpg)
![HiDef png [2 MiB]](Directory_LHCb-DP-2016-003/hidef_fig6_right.png)
![fig7_left.jpg [597 KiB]](Directory_LHCb-DP-2016-003/fig7_left.jpg)
![HiDef png [2 MiB]](Directory_LHCb-DP-2016-003/hidef_fig7_left.png)
![fig7_right.jpg [669 KiB]](Directory_LHCb-DP-2016-003/fig7_right.jpg)
![HiDef png [2 MiB]](Directory_LHCb-DP-2016-003/hidef_fig7_right.png)
![HiDef png [287 KiB]](Directory_LHCb-DP-2016-003/hidef_fig8.png)
![HiDef png [67 KiB]](Directory_LHCb-DP-2016-003/hidef_fig9_left.png)
![HiDef png [171 KiB]](Directory_LHCb-DP-2016-003/hidef_fig9_right.png)
![HiDef png [187 KiB]](Directory_LHCb-DP-2016-003/hidef_fig10.png)
![HiDef png [310 KiB]](Directory_LHCb-DP-2016-003/hidef_fig11_left.png)
![HiDef png [202 KiB]](Directory_LHCb-DP-2016-003/hidef_fig11_right.png)
![HiDef png [132 KiB]](Directory_LHCb-DP-2016-003/hidef_fig12_left.png)
![HiDef png [128 KiB]](Directory_LHCb-DP-2016-003/hidef_fig12_right.png)
![HiDef png [125 KiB]](Directory_LHCb-DP-2016-003/hidef_fig13_1.png)
![HiDef png [126 KiB]](Directory_LHCb-DP-2016-003/hidef_fig13_2.png)
![HiDef png [122 KiB]](Directory_LHCb-DP-2016-003/hidef_fig13_3.png)
![HiDef png [122 KiB]](Directory_LHCb-DP-2016-003/hidef_fig13_4.png)
![HiDef png [124 KiB]](Directory_LHCb-DP-2016-003/hidef_fig13_5.png)
![HiDef png [120 KiB]](Directory_LHCb-DP-2016-003/hidef_fig14.png)
![HiDef png [204 KiB]](Directory_LHCb-DP-2016-003/hidef_fig15_left.png)
![HiDef png [286 KiB]](Directory_LHCb-DP-2016-003/hidef_fig15_right.png)
![HiDef png [148 KiB]](Directory_LHCb-DP-2016-003/hidef_fig16_upperleft.png)
![HiDef png [177 KiB]](Directory_LHCb-DP-2016-003/hidef_fig16_upperright.png)
![HiDef png [208 KiB]](Directory_LHCb-DP-2016-003/hidef_fig16_lower.png)
![HiDef png [129 KiB]](Directory_LHCb-DP-2016-003/hidef_fig17.png)
![HiDef png [131 KiB]](Directory_LHCb-DP-2016-003/hidef_fig18_1.png)
![HiDef png [103 KiB]](Directory_LHCb-DP-2016-003/hidef_fig18_2.png)
![HiDef png [104 KiB]](Directory_LHCb-DP-2016-003/hidef_fig18_3.png)
![HiDef png [93 KiB]](Directory_LHCb-DP-2016-003/hidef_fig18_4.png)
![HiDef png [103 KiB]](Directory_LHCb-DP-2016-003/hidef_fig18_5.png)
Created on 18 October 2023.