Measurement of the ratio of prompt $\chi_{c}$ to $J/\psi$ production in $pp$ collisions at $\sqrt{s}=7$ TeV
[to restricted-access page]Information
LHCb-PAPER-2011-030
CERN-PH-EP-2012-068
arXiv:1204.1462 [PDF]
(Submitted on 06 Apr 2012)
Phys. Lett. B718 (2012) 431
Inspire 1107645
Tools
Abstract
The prompt production of charmonium $\chi_{c}$ and $J/\psi$ states is studied in proton-proton collisions at a centre-of-mass energy of $\sqrt{s}=7$ TeV at the Large Hadron Collider. The $\chi_{c}$ and $J/\psi$ mesons are identified through their decays $\chi_{c}\rightarrow J/\psi \gamma$ and $J/\psi\rightarrow \mu^+\mu^-$ using 36 pb$^{-1}$ of data collected by the LHCb detector in 2010. The ratio of the prompt production cross-sections for $\chi_{c}$ and $J/\psi$, $\sigma (\chi_{c}\rightarrow J/\psi \gamma)/ \sigma (J/\psi)$, is determined as a function of the $J/\psi$ transverse momentum in the range $2 < p_{\mathrm T}^{J/\psi} < 15$ GeV/$c$. The results are in excellent agreement with next-to-leading order non-relativistic expectations and show a significant discrepancy compared with the colour singlet model prediction at leading order, especially in the low $p_{\mathrm T}^{J/\psi}$ region.
Figures and captions
|
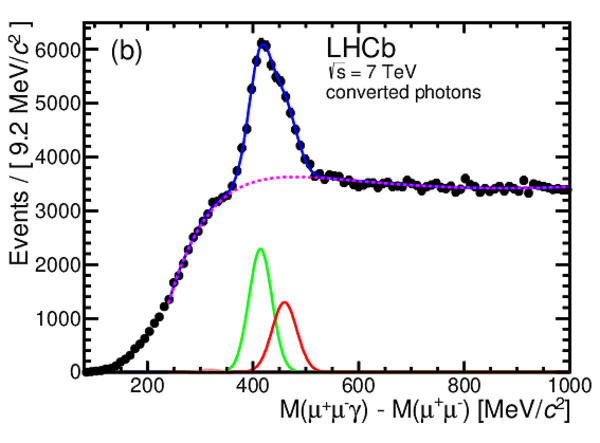
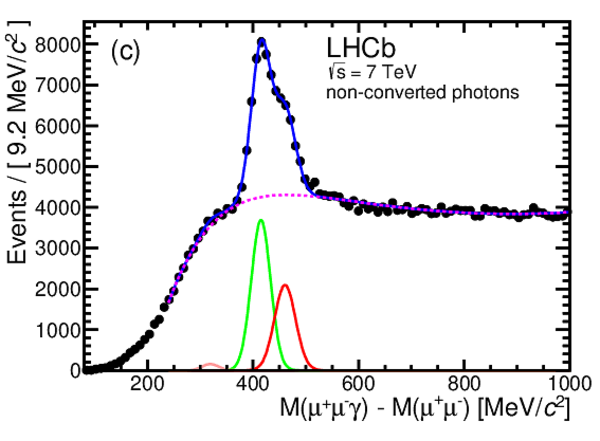
(a) Invariant mass of the $\mu ^+ \mu ^- $ pair for selected $ { J \mskip -3mu/\mskip -2mu\psi \mskip 2mu}$ candidates. The solid red curve corresponds to the signal and the background is shown as a dashed purple curve. (b) and (c) show the $\Delta M {=} M\left(\mu ^+ \mu ^- \gamma\right) {-} M\left(\mu ^+ \mu ^- \right)$ distributions of selected $\chi _{c}$ candidates with (b) converted and (c) non-converted photons. The upper solid blue curve corresponds to the overall fit function described in Ref. [3]. The lower solid curves correspond to the fitted $\chi _{ c 0}$ , $\chi _{ c 1}$ and $\chi _{ c 2}$ contributions from left to right, respectively (the $\chi _{ c 0}$ peak is barely visible). The background distribution is shown as a dashed purple curve. |
Fig_1a.pdf [15 KiB] HiDef png [209 KiB] Thumbnail [177 KiB] *.C file |

|
|
Fig_1b.pdf [15 KiB] HiDef png [217 KiB] Thumbnail [189 KiB] *.C file |
|
|
|
Fig_1c.pdf [16 KiB] HiDef png [238 KiB] Thumbnail [202 KiB] *.C file |
|
|
|
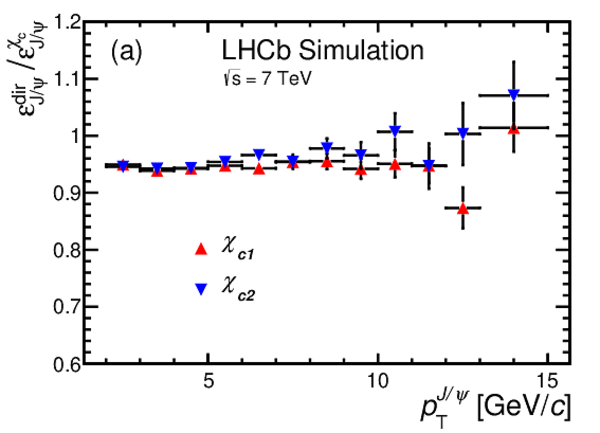
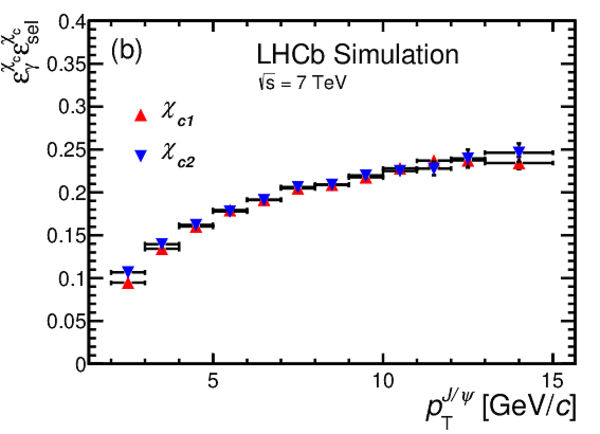
(a) Ratio of the reconstruction and selection efficiency for direct $ { J \mskip -3mu/\mskip -2mu\psi \mskip 2mu}$ compared to $ { J \mskip -3mu/\mskip -2mu\psi \mskip 2mu}$ from $\chi _{c}$ decays, $\epsilon^{\mathrm{dir}}_{ { J \mskip -3mu/\mskip -2mu\psi \mskip 2mu} }/\epsilon^{\chi _{c} }_{ { J \mskip -3mu/\mskip -2mu\psi \mskip 2mu} }$ , and (b) the photon reconstruction and selection efficiency multiplied by the $\chi _{c}$ selection efficiency, $\epsilon^{\chi_{cJ}}_{\gamma}\epsilon^{\chi_{cJ}}_{\mathrm{sel}}$ , obtained from simulation. The efficiencies are presented separately for the $\chi _{ c 1}$ (red triangles) and $\chi _{ c 2}$ (inverted blue triangles) states, and as a function of $ p_{\mathrm{T}}^{ { J \mskip -3mu/\mskip -2mu\psi \mskip 2mu} }$ . |
Fig_2a.pdf [5 KiB] HiDef png [128 KiB] Thumbnail [124 KiB] *.C file |
|
|
Fig_2b.pdf [5 KiB] HiDef png [133 KiB] Thumbnail [135 KiB] *.C file |
|
|
|
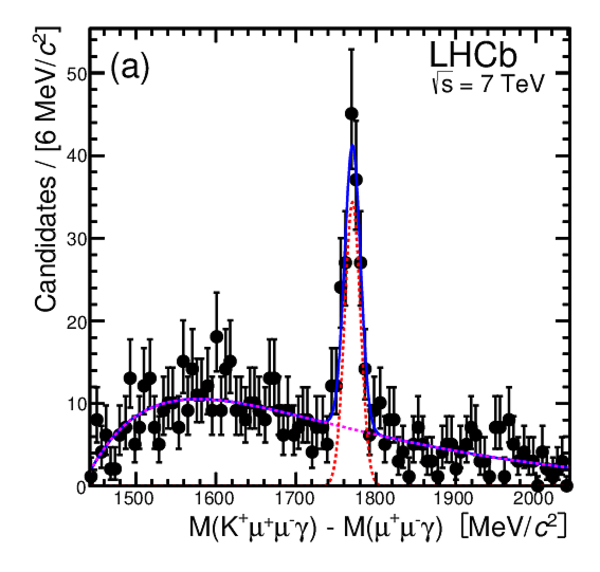
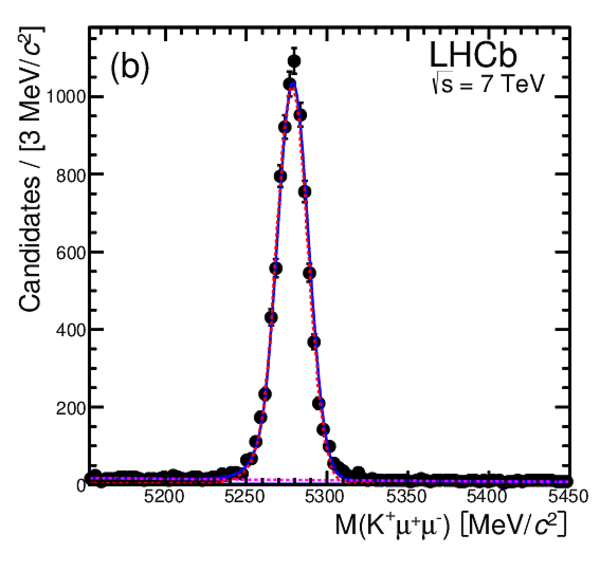
(a) Reconstructed $\Delta M_{B^+}=M(\mu ^+ \mu ^- \gamma K)-M(\mu ^+ \mu ^- \gamma)$ mass distribution for $ B^+\rightarrow \chi _{c} K^+$ candidates and (b) the reconstructed $ B^+$ mass distribution for $ B^+\rightarrow { J \mskip -3mu/\mskip -2mu\psi \mskip 2mu} K^+$ candidates. The LHCb data are shown as solid black points, the full fit functions with a solid blue (upper) curve, the contribution from signal candidates with a dashed red (lower curve) and the background with a dashed purple curve. |
Fig_3a.pdf [15 KiB] HiDef png [295 KiB] Thumbnail [266 KiB] *.C file |
|
|
Fig_3b.pdf [14 KiB] HiDef png [233 KiB] Thumbnail [190 KiB] *.C file |
|
|
|
Ratio $\sigma(\chi _{c} \rightarrow { J \mskip -3mu/\mskip -2mu\psi \mskip 2mu} \gamma) / \sigma( { J \mskip -3mu/\mskip -2mu\psi \mskip 2mu} )$ in bins of $ p_{\mathrm{T}}^{ { J \mskip -3mu/\mskip -2mu\psi \mskip 2mu} }$ in the range $ 2 {<} p_{\mathrm{T}}^{ { J \mskip -3mu/\mskip -2mu\psi \mskip 2mu} } {<} 15 {\mathrm{ Ge V /}c} $ . The LHCb results, in the rapidity range $ 2.0 {<} y^{ { J \mskip -3mu/\mskip -2mu\psi \mskip 2mu} } {<} 4.5$ and assuming the production of unpolarised $ { J \mskip -3mu/\mskip -2mu\psi \mskip 2mu}$ and $\chi _{c}$ mesons, are shown with solid black circles and the internal error bars correspond to the statistical error; the external error bars include the contribution from the systematic uncertainties (apart from the polarisation). The lines surrounding the data points show the maximum effect of the unknown $ { J \mskip -3mu/\mskip -2mu\psi \mskip 2mu}$ and $\chi _{c}$ polarisations on the result. The upper and lower limits correspond to the spin states as described in the text. The CDF data points, at $\sqrt{s} {=} {1.8}\:{\mathrm{ Te V} }$ in $ p\bar{p}$ collisions and in the $ { J \mskip -3mu/\mskip -2mu\psi \mskip 2mu}$ pseudo-rapidity range $ |\eta^{ { J \mskip -3mu/\mskip -2mu\psi \mskip 2mu} }|<1.0$ , are shown in (a) with open blue circles [5]. The two hatched bands in (b) correspond to the ChiGen Monte Carlo generator prediction [16] and NLO NRQCD [17]. |
Fig_4a.pdf [16 KiB] HiDef png [179 KiB] Thumbnail [171 KiB] *.C file |

|
|
Fig_4b.pdf [7 KiB] HiDef png [543 KiB] Thumbnail [338 KiB] *.C file |

|
|
|
Animated gif made out of all figures. |
PAPER-2011-030.gif Thumbnail |

|
![HiDef png [209 KiB]](Directory_LHCb-PAPER-2011-030/hidef_Fig_1a.png)
![HiDef png [217 KiB]](Directory_LHCb-PAPER-2011-030/hidef_Fig_1b.png)
![HiDef png [238 KiB]](Directory_LHCb-PAPER-2011-030/hidef_Fig_1c.png)
![HiDef png [128 KiB]](Directory_LHCb-PAPER-2011-030/hidef_Fig_2a.png)
![HiDef png [133 KiB]](Directory_LHCb-PAPER-2011-030/hidef_Fig_2b.png)
![HiDef png [295 KiB]](Directory_LHCb-PAPER-2011-030/hidef_Fig_3a.png)
![HiDef png [233 KiB]](Directory_LHCb-PAPER-2011-030/hidef_Fig_3b.png)
![HiDef png [179 KiB]](Directory_LHCb-PAPER-2011-030/hidef_Fig_4a.png)
![HiDef png [543 KiB]](Directory_LHCb-PAPER-2011-030/hidef_Fig_4b.png)
Tables and captions
|
Polarisation weights in $ p_{\mathrm{T}}^{ { J \mskip -3mu/\mskip -2mu\psi \mskip 2mu} }$ bins for different combinations of the $ { J \mskip -3mu/\mskip -2mu\psi \mskip 2mu}$ , $\chi _{ c 1}$ and $\chi _{ c 2}$ polarisations. $\lambda_{ { J \mskip -3mu/\mskip -2mu\psi \mskip 2mu} }$ is the $ { J \mskip -3mu/\mskip -2mu\psi \mskip 2mu}$ polarisation parameter; $\lambda_{ { J \mskip -3mu/\mskip -2mu\psi \mskip 2mu} }=+1, -1, 0$ corresponds to fully transverse, fully longitudinal and no polarisation respectively. $ m_{\chi_{cJ}}$ is the azimuthal angular momentum quantum number corresponding to total angular momentum $J$; Unpol means the $\chi _{c}$ is unpolarised. |
Table_1.pdf [32 KiB] HiDef png [256 KiB] Thumbnail [122 KiB] tex code |

|
|
Summary of the systematic uncertainties on $\sigma(\chi _{c} \rightarrow { J \mskip -3mu/\mskip -2mu\psi \mskip 2mu} \gamma) / \sigma( { J \mskip -3mu/\mskip -2mu\psi \mskip 2mu} )$ in each $ p_{\mathrm{T}}^{ { J \mskip -3mu/\mskip -2mu\psi \mskip 2mu} }$ bin. |
Table_2.pdf [55 KiB] HiDef png [143 KiB] Thumbnail [65 KiB] tex code |

|
|
Ratio $\sigma(\chi _{c} \rightarrow { J \mskip -3mu/\mskip -2mu\psi \mskip 2mu} \gamma) / \sigma( { J \mskip -3mu/\mskip -2mu\psi \mskip 2mu} )$ in bins of $ p_{\mathrm{T}}^{ { J \mskip -3mu/\mskip -2mu\psi \mskip 2mu} }$ in the range $ 2 {<} p_{\mathrm{T}}^{ { J \mskip -3mu/\mskip -2mu\psi \mskip 2mu} } {<} 15 {\mathrm{ Ge V /}c} $ and in the rapidity range $ 2.0 {<} y^{ { J \mskip -3mu/\mskip -2mu\psi \mskip 2mu} } {<} 4.5$ . The first error is statistical and the second is systematic (apart from the polarisation). Also given is the maximum effect of the unknown polarisations on the results as described in Sect. 5. |
Table_3.pdf [55 KiB] HiDef png [137 KiB] Thumbnail [69 KiB] tex code |

|
![HiDef png [256 KiB]](Directory_LHCb-PAPER-2011-030/hidef_Table_1.png)
![HiDef png [143 KiB]](Directory_LHCb-PAPER-2011-030/hidef_Table_2.png)
![HiDef png [137 KiB]](Directory_LHCb-PAPER-2011-030/hidef_Table_3.png)
Created on 03 May 2024.