First observation of $B^{+} \to D_s^{+}K^{+}K^{-}$ decays and a search for $B^{+} \to D_s^{+}\phi$ decays
[to restricted-access page]Information
LHCb-PAPER-2017-032
CERN-EP-2017-289
arXiv:1711.05637 [PDF]
(Submitted on 15 Nov 2017)
JHEP 01 (2018) 131
Inspire 1636199
Tools
Abstract
A search for $B^{+} \to D_s^{+}K^{+}K^{-}$ decays is performed using $pp$ collision data corresponding to an integrated luminosity of 4.8 fb$^{-1}$, collected at centre-of-mass energies of 7, 8 and 13$ $TeV with the LHCb experiment. A significant signal is observed for the first time and the branching fraction is determined to be \begin{equation*} \mathcal{B}(B^{+} \to D_s^{+}K^{+}K^{-} ) = (7.1 \pm 0.5 \pm 0.6 \pm 0.7) \times 10^{-6}, \end{equation*} where the first uncertainty is statistical, the second systematic and the third due to the uncertainty on the branching fraction of the normalisation mode $B^{+} \to D_s^{+} \overline{ D}^{0}$. A search is also performed for the pure annihilation decay $B^{+} \to D_s^{+}\phi$. No significant signal is observed and a limit of \begin{equation*} \mathcal{B}(B^{+} \to D_s^{+}\phi) < 4.9 \times 10^{-7} (4.2 \times 10^{-7}) \end{equation*} is set on the branching fraction at 95$\%$ (90$\%$) confidence level.
Figures and captions
|
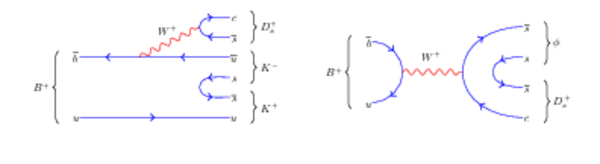
Dominant diagram for the (left) $ B ^+ \rightarrow D ^+_ s K ^+ K ^- $ decay and (right) annihilation diagram for the $ B ^+ \rightarrow D ^+_ s \phi $ decay in the Standard Model. |
Fig1.pdf [41 KiB] HiDef png [43 KiB] Thumbnail [29 KiB] *.C file |
|
|
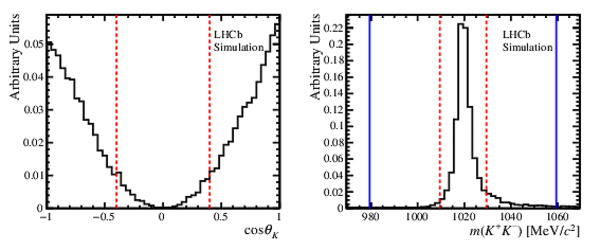
Distributions of (left) $\cos{\theta_{K}}$ and (right) $m( K ^+ K ^- )$ in $ B ^+ \rightarrow D ^+_ s \phi $ decays, as determined from simulated events. The vertical lines represent the limits of the two categories used for each variable. In the $m( K ^+ K ^- )$ distribution, the area within the dashed red lines represents the $\phi $ signal region, and the two areas between the dashed red and blue lines represent the $\phi $ sideband region. The $ B ^+ \rightarrow D ^+_ s \phi $ signal decays are seen to primarily contribute to the $\phi$ signal region and the $|\cos{\theta_{K}}| > 0.4$ category. |
Fig2.eps [14 KiB] HiDef png [145 KiB] Thumbnail [136 KiB] *.C file |
|
|
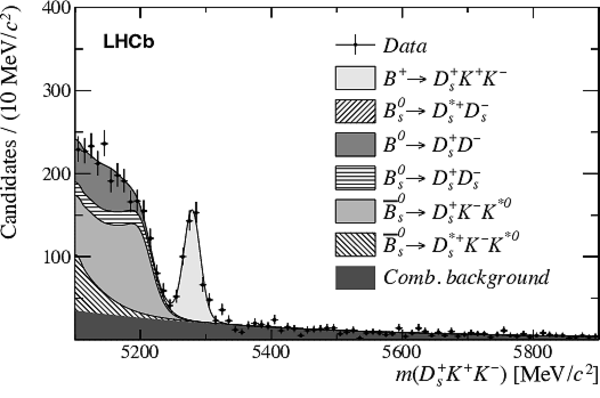
Mass distribution of $ B ^+ \rightarrow D ^+_ s K ^+ K ^- $ candidates. The result of the fit to the data using the model described in Sec. 4.1 is overlaid, with the PDF components given in the legend. |
Fig3.eps [249 KiB] HiDef png [196 KiB] Thumbnail [99 KiB] *.C file |
|
|
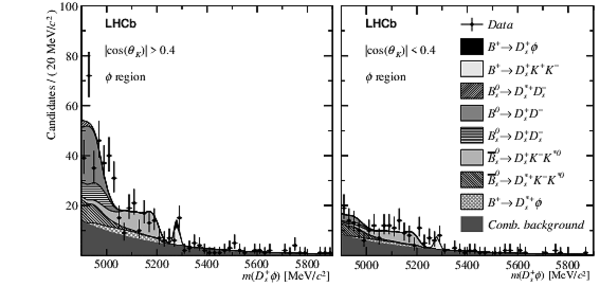
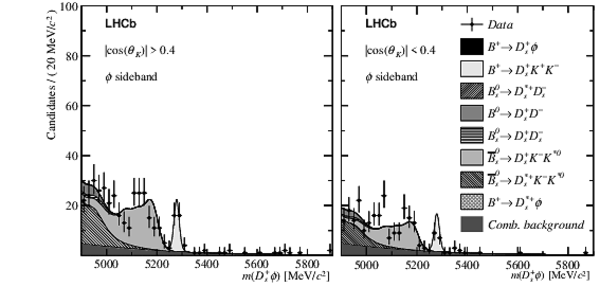
Mass distribution of $ B ^+ \rightarrow D ^+_ s \phi $ candidates in (top) the $\phi $ mass region, and (bottom) the $\phi $ mass sideband. The plots on the left are in the helicity bin $|\cos{\theta_{K}}|>0.4$ and the right are in $|\cos{\theta_{K}}|<0.4$. The result of the fit to the data using the model described in Sec. 4.1 is overlaid, with the PDF components given in the legend. The $ B ^+ \rightarrow D ^+_ s \phi $ decays (black) are expected to primarily contribute to the $\phi$ region with $|\cos{\theta_{K}}| > 0.4$. |
Fig4a.eps [71 KiB] HiDef png [182 KiB] Thumbnail [76 KiB] *.C file |
|
|
Fig4b.eps [67 KiB] HiDef png [183 KiB] Thumbnail [75 KiB] *.C file |
|
|
|
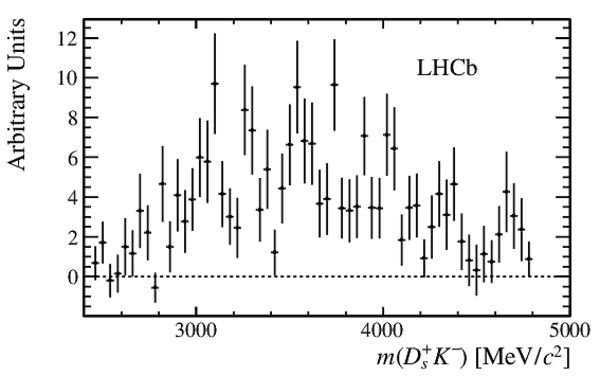
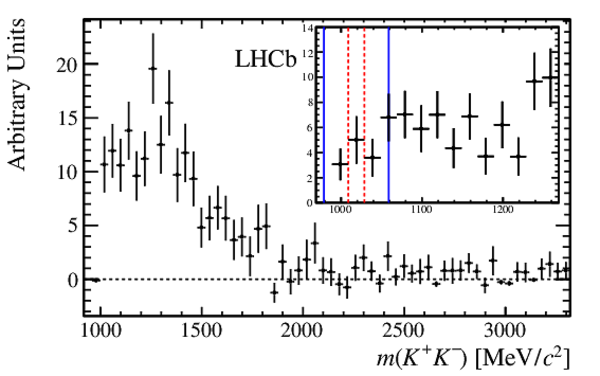
Projections of the background-subtracted two-body invariant masses (left) $m( D ^+_ s K ^- )$ and (right) $m( K ^+ K ^- )$ for $ B ^+ \rightarrow D ^+_ s K ^+ K ^- $ decays. These plots are additionally weighted by a factor $1/\epsilon^{\text{ratio}}_{i}$ to correct for the efficiency variation across the phase space. An expansion of the $\phi $ region of $m( K ^+ K ^- )$ is inset where the same $\phi $ signal region and $\phi $ sideband region have been represented as in Fig. 2. |
Fig5a.eps [13 KiB] HiDef png [99 KiB] Thumbnail [55 KiB] *.C file |
|
|
Fig5b.eps [19 KiB] HiDef png [171 KiB] Thumbnail [179 KiB] *.C file |
|
|
|
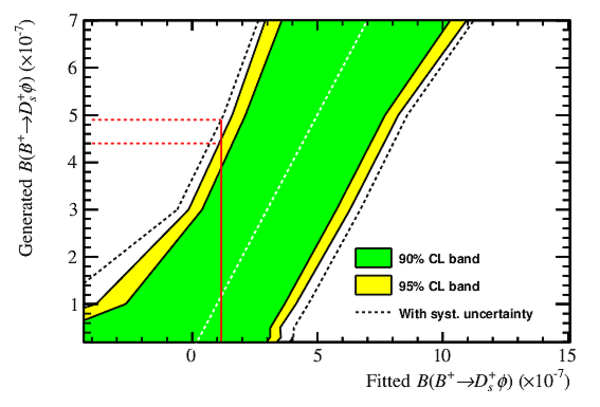
Confidence bands produced using the Feldman-Cousins approach. The green and yellow bands represent the statistical-only 90% and 95% CL bands. The black dotted line represents the 95% limit including systematic uncertainties. The measured value of the branching fraction is shown by the vertical red line, and the corresponding 95% CL limits, with and without systematic uncertainties, are represented by the dotted red lines. |
Fig6.eps [13 KiB] HiDef png [193 KiB] Thumbnail [164 KiB] *.C file |
|
|
Animated gif made out of all figures. |
PAPER-2017-032.gif Thumbnail |

|
![HiDef png [43 KiB]](Directory_LHCb-PAPER-2017-032/hidef_Fig1.png)
![HiDef png [145 KiB]](Directory_LHCb-PAPER-2017-032/hidef_Fig2.png)
![HiDef png [196 KiB]](Directory_LHCb-PAPER-2017-032/hidef_Fig3.png)
![HiDef png [182 KiB]](Directory_LHCb-PAPER-2017-032/hidef_Fig4a.png)
![HiDef png [183 KiB]](Directory_LHCb-PAPER-2017-032/hidef_Fig4b.png)
![HiDef png [99 KiB]](Directory_LHCb-PAPER-2017-032/hidef_Fig5a.png)
![HiDef png [171 KiB]](Directory_LHCb-PAPER-2017-032/hidef_Fig5b.png)
![HiDef png [193 KiB]](Directory_LHCb-PAPER-2017-032/hidef_Fig6.png)
Tables and captions
|
Fractions of $ B ^+ \rightarrow D ^+_ s \phi $ candidates expected in the helicity and $m( K ^+ K ^- )$ invariant mass categories of the simultaneous fit. |
Table_1.pdf [66 KiB] HiDef png [29 KiB] Thumbnail [13 KiB] tex code |

|
|
Fractions of $ B ^+ \rightarrow D ^+_ s K ^+ K ^- $ candidates assumed to contribute to each helicity and $m( K ^+ K ^- )$ invariant mass categories of the simultaneous fit. The uncertainties shown are calculated from the range of fractions obtained by assuming different contributing resonances, as detailed in Sec. 4.1. |
Table_2.pdf [66 KiB] HiDef png [34 KiB] Thumbnail [14 KiB] tex code |

|
|
Systematic uncertainties contributing to the measurements of $\mathcal{B}( B ^+ \rightarrow D ^+_ s \phi )$ and $\mathcal{B}( B ^+ \rightarrow D ^+_ s K ^+ K ^- )$. The systematic uncertainty from the normalisation branching fraction is also included. |
Table_3.pdf [70 KiB] HiDef png [59 KiB] Thumbnail [27 KiB] tex code |

|
![HiDef png [29 KiB]](Directory_LHCb-PAPER-2017-032/hidef_Table_1.png)
![HiDef png [34 KiB]](Directory_LHCb-PAPER-2017-032/hidef_Table_2.png)
![HiDef png [59 KiB]](Directory_LHCb-PAPER-2017-032/hidef_Table_3.png)
Created on 25 April 2024.