Measurement of $\Upsilon$ production in $pp$ collisions at $\sqrt{s}$= 13 TeV
[to restricted-access page]Information
LHCb-PAPER-2018-002
CERN-EP-2018-054
arXiv:1804.09214 [PDF]
(Submitted on 24 Apr 2018)
JHEP 07 (2018) 134
Inspire 1670013
Tools
Abstract
The production cross-sections of $\Upsilon(1S)$, $\Upsilon(2S)$ and $\Upsilon(3S)$ mesons in proton-proton collisions at $\sqrt{s}$= 13 TeV are measured with a data sample corresponding to an integrated luminosity of $277 \pm 11$ $\rm pb^{-1}$ recorded by the LHCb experiment in 2015. The $\Upsilon$ mesons are reconstructed in the decay mode $\Upsilon\to\mu^{+}\mu^{-}$. The differential production cross-sections times the dimuon branching fractions are measured as a function of the $\Upsilon$ transverse momentum, $p_{\rm T}$, and rapidity, $y$, over the range $0 < p_{\rm T}< 30$ GeV/c and $2.0 < y < 4.5$. The ratios of the cross-sections with respect to the LHCb measurement at $\sqrt{s}$= 8 TeV are also determined. The measurements are compared with theoretical predictions based on NRQCD.
Figures and captions
|
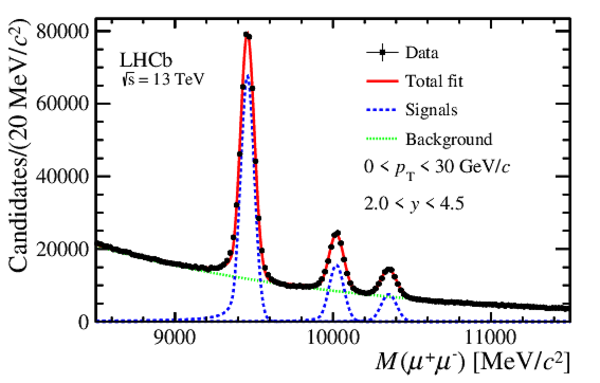
Dimuon invariant mass distribution of $\Upsilon$ candidates with $0< p_{\rm T} <30 {\mathrm{ Ge V /}c} $ and $2.0<y<4.5$. The fit result with the Crystal Ball functions plus an exponential function is also shown. The black dots refer to the data, the blue dashed line refers to the three signals and the green dotted line refers to the background. |
Total.pdf [47 KiB] HiDef png [238 KiB] Thumbnail [190 KiB] *.C file |
|
|
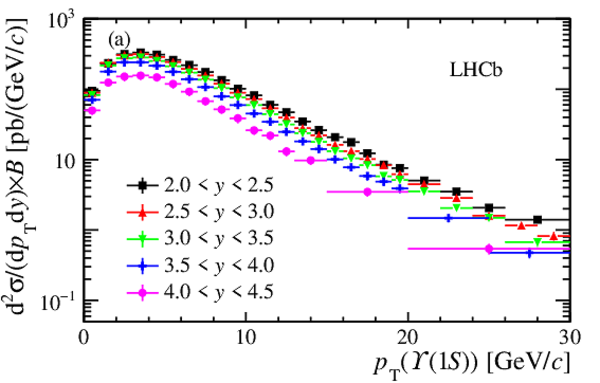
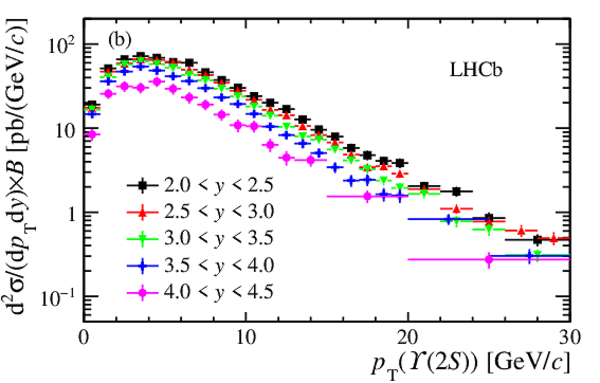
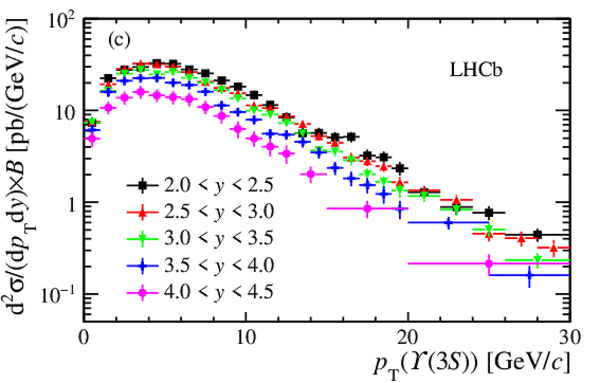
Double-differential cross-sections multiplied by dimuon branching fractions as a function of $p_{\rm T}$ in intervals of $y$ for the (a) $\Upsilon{(1S)} $, (b) $\Upsilon{(2S)} $ and (c) $\Upsilon{(3S)} $ mesons. Statistical and systematic uncertainties are added in quadrature. |
CS1.pdf [19 KiB] HiDef png [191 KiB] Thumbnail [183 KiB] *.C file |
|
|
CS2.pdf [20 KiB] HiDef png [197 KiB] Thumbnail [187 KiB] *.C file |
|
|
|
CS3.pdf [20 KiB] HiDef png [202 KiB] Thumbnail [187 KiB] *.C file |
|
|
|
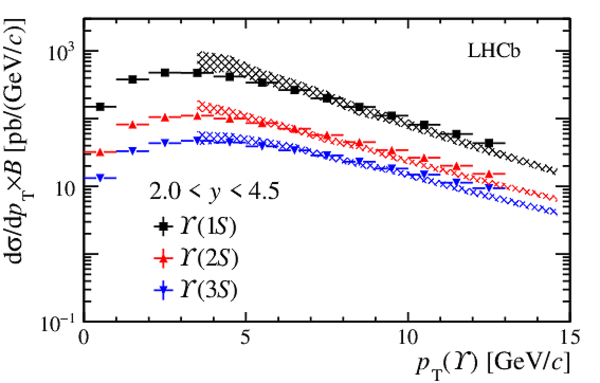
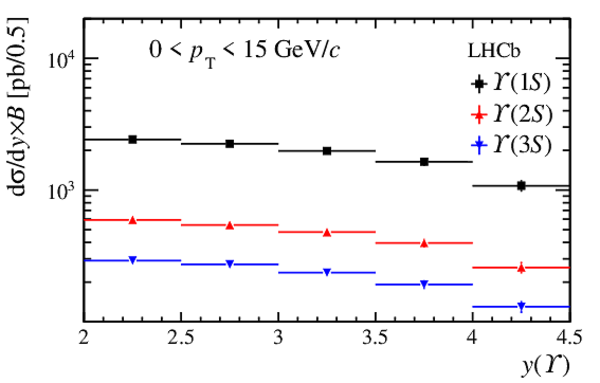
Differential cross-sections multiplied by dimuon branching fractions for the $\Upsilon{(1S)} $ (black solid squares), $\Upsilon{(2S)} $ (red upward triangles) and $\Upsilon{(3S)} $ (blue downward triangles) states (top) versus $p_{\rm T}$ integrated over $y$ between 2.0 and 4.5 and (bottom) versus $y$ integrated over $p_{\rm T}$ from 0 to $15 {\mathrm{ Ge V /}c} $. Statistical and systematic uncertainties are added in quadrature. Predictions from NRQCD \cite{Wang:Upsilon2015} for the $\Upsilon{(1S)} $ (black grid shading), $\Upsilon{(2S)} $ (red grid shading) and $\Upsilon{(3S)} $ (blue grid shading) states are overlaid in the top plot. |
CSpt123.pdf [19 KiB] HiDef png [226 KiB] Thumbnail [189 KiB] *.C file |
|
|
CSy123.pdf [14 KiB] HiDef png [103 KiB] Thumbnail [106 KiB] *.C file |
|
|
|
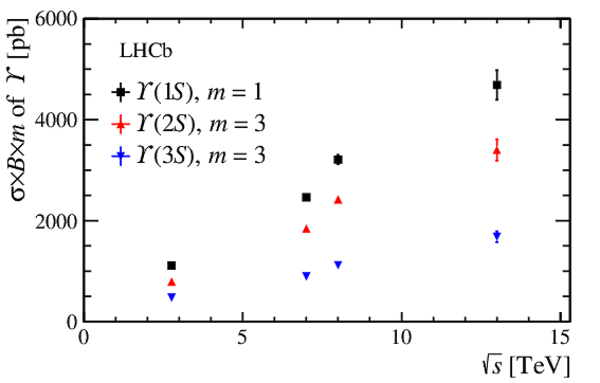
The production cross-sections multiplied by dimuon branching fractions integrated over $0< p_{\rm T} <15 {\mathrm{ Ge V /}c} $ and $2.0<y<4.5$ versus centre-of-mass energy of $pp$ collisions for the $\Upsilon{(1S)} $ (black solid squares), $\Upsilon{(2S)} $ (red upward triangles) and $\Upsilon{(3S)} $ (blue downward triangles) states. Each set of measurements is offset by a multiplicative factor $m$, which is shown on the plot. Statistical and systematic uncertainties are added in quadrature. |
CS138123.pdf [13 KiB] HiDef png [98 KiB] Thumbnail [95 KiB] *.C file |
|
|
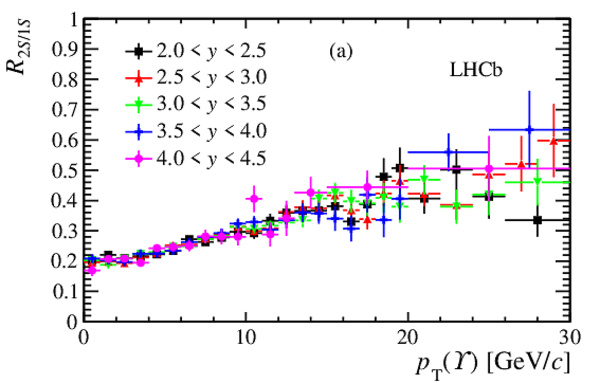
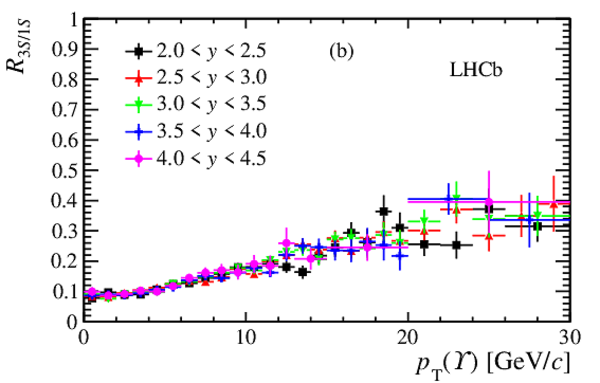
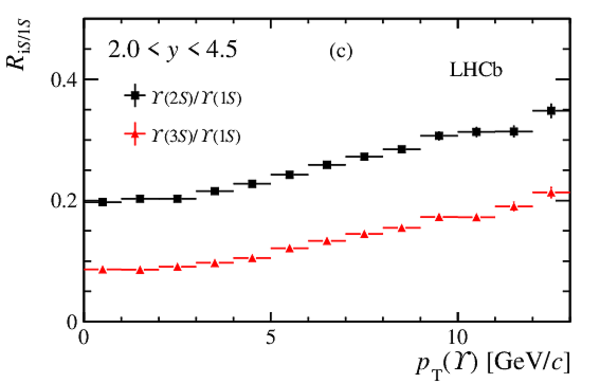
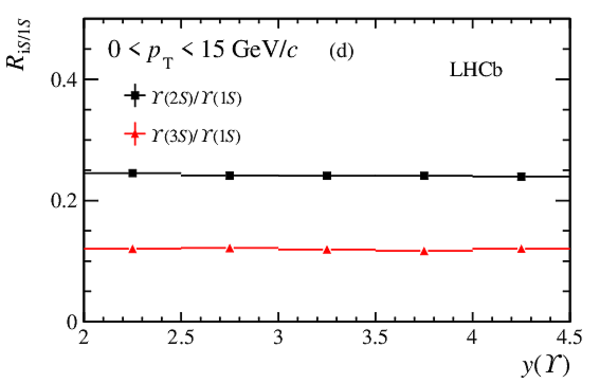
Ratios of double-differential cross-sections times dimuon branching fractions for (a) $\Upsilon{(2S)} $ to $\Upsilon{(1S)} $ and (b) $\Upsilon{(3S)} $ to $\Upsilon{(1S)} $. Ratios of differential cross-sections times dimuon branching fractions (c) versus $ p_{\rm T} $ integrated over $y$ and (d) versus $y$ integrated over $ p_{\rm T} $ for $\Upsilon{(2S)} $ to $\Upsilon{(1S)} $ (black solid squares) and $\Upsilon{(3S)} $ to $\Upsilon{(1S)} $ (red upward triangles). Statistical and systematic uncertainties are added in quadrature. |
Ratio21.pdf [20 KiB] HiDef png [193 KiB] Thumbnail [181 KiB] *.C file |
|
|
Ratio31.pdf [20 KiB] HiDef png [186 KiB] Thumbnail [177 KiB] *.C file |
|
|
|
Ratiopt123.pdf [14 KiB] HiDef png [94 KiB] Thumbnail [93 KiB] *.C file |
|
|
|
Ratioy123.pdf [13 KiB] HiDef png [87 KiB] Thumbnail [86 KiB] *.C file |
|
|
|
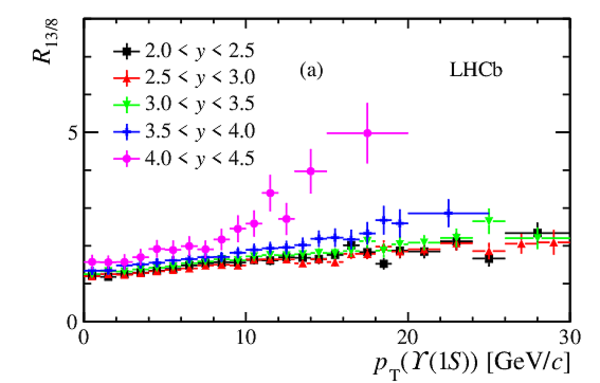
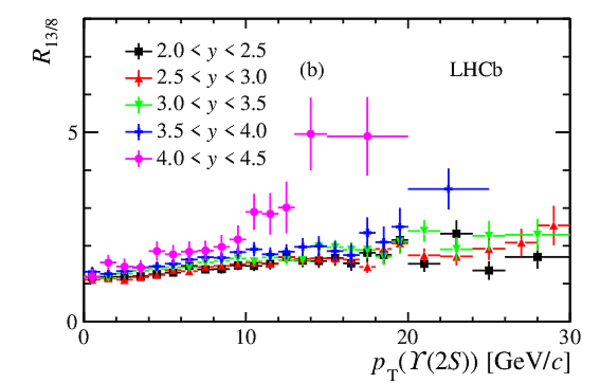
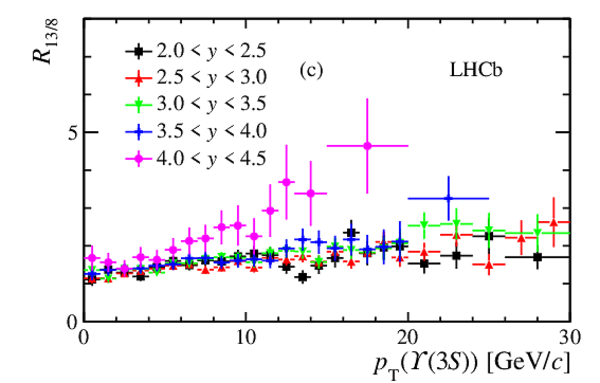
Ratios of double-differential cross-sections between 13 TeV and 8 TeV measurements versus $ p_{\rm T} $ in intervals of $y$ for the (a) $\Upsilon{(1S)} $, (b) $\Upsilon{(2S)} $ and (c) $\Upsilon{(3S)} $ states. Statistical and systematic uncertainties are added in quadrature. |
Ratio11.pdf [19 KiB] HiDef png [169 KiB] Thumbnail [141 KiB] *.C file |
|
|
Ratio22.pdf [19 KiB] HiDef png [171 KiB] Thumbnail [143 KiB] *.C file |
|
|
|
Ratio33.pdf [20 KiB] HiDef png [174 KiB] Thumbnail [146 KiB] *.C file |
|
|
|
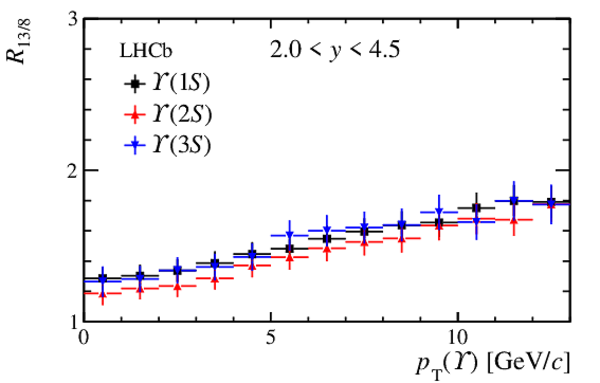
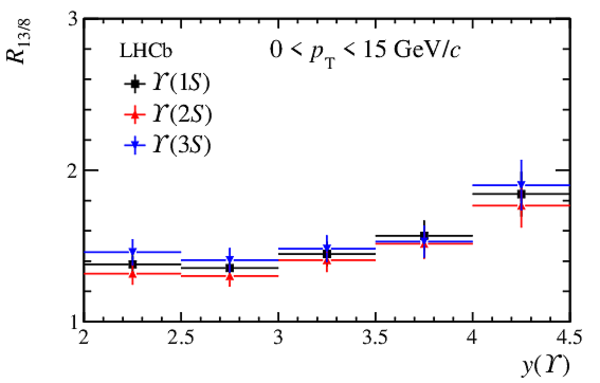
Ratios of differential cross-sections between 13 TeV and 8 TeV measurements (top) versus $ p_{\rm T} $ integrated over $y$ and (bottom) versus $y$ integrated over $ p_{\rm T} $ for the $\Upsilon{(1S)} $ (black solid squares), $\Upsilon{(2S)} $ (red upward triangles) and $\Upsilon{(3S)} $ (blue downward triangles) states. Statistical and systematic uncertainties are added in quadrature. |
Ratio1[..].pdf [15 KiB] HiDef png [111 KiB] Thumbnail [102 KiB] *.C file |
|
|
Ratio1[..].pdf [14 KiB] HiDef png [94 KiB] Thumbnail [90 KiB] *.C file |
|
|
|
Animated gif made out of all figures. |
PAPER-2018-002.gif Thumbnail |

|
![HiDef png [238 KiB]](Directory_LHCb-PAPER-2018-002/hidef_Total.png)
![HiDef png [191 KiB]](Directory_LHCb-PAPER-2018-002/hidef_CS1.png)
![HiDef png [197 KiB]](Directory_LHCb-PAPER-2018-002/hidef_CS2.png)
![HiDef png [202 KiB]](Directory_LHCb-PAPER-2018-002/hidef_CS3.png)
![HiDef png [226 KiB]](Directory_LHCb-PAPER-2018-002/hidef_CSpt123.png)
![HiDef png [103 KiB]](Directory_LHCb-PAPER-2018-002/hidef_CSy123.png)
![HiDef png [98 KiB]](Directory_LHCb-PAPER-2018-002/hidef_CS138123.png)
![HiDef png [193 KiB]](Directory_LHCb-PAPER-2018-002/hidef_Ratio21.png)
![HiDef png [186 KiB]](Directory_LHCb-PAPER-2018-002/hidef_Ratio31.png)
![HiDef png [94 KiB]](Directory_LHCb-PAPER-2018-002/hidef_Ratiopt123.png)
![HiDef png [87 KiB]](Directory_LHCb-PAPER-2018-002/hidef_Ratioy123.png)
![HiDef png [169 KiB]](Directory_LHCb-PAPER-2018-002/hidef_Ratio11.png)
![HiDef png [171 KiB]](Directory_LHCb-PAPER-2018-002/hidef_Ratio22.png)
![HiDef png [174 KiB]](Directory_LHCb-PAPER-2018-002/hidef_Ratio33.png)
![HiDef png [111 KiB]](Directory_LHCb-PAPER-2018-002/hidef_Ratio138pt123.png)
![HiDef png [94 KiB]](Directory_LHCb-PAPER-2018-002/hidef_Ratio138y123.png)
Tables and captions
|
Summary of the relative systematic uncertainties (in $\%$) on the $\Upsilon$ production cross-sections times dimuon branching fractions. Some of the uncertainties are correlated between intervals. For the trigger, track reconstruction and muon identification efficiencies, the uncertainties are larger in the high rapidity region. The uncertainties on the tracking efficiency account for both the limited size of the control samples (first parenthesis) and the impact of different multiplicity between data and simulation on each track (second parenthesis). |
Table_1.pdf [49 KiB] HiDef png [99 KiB] Thumbnail [45 KiB] tex code |

|
|
Double-differential cross-sections times dimuon branching fraction in different bins of $p_{\rm T}$ and $y$ for $\Upsilon{(1S)} $ (in $\rm pb$ ). The first uncertainty is statistical and the second is systematic. |
Table_2.pdf [50 KiB] HiDef png [269 KiB] Thumbnail [132 KiB] tex code |

|
|
Double-differential cross-sections times dimuon branching fraction in different bins of $p_{\rm T}$ and $y$ for $\Upsilon{(2S)} $ (in $\rm pb$ ). The first uncertainty is statistical and the second is systematic. |
Table_3.pdf [49 KiB] HiDef png [279 KiB] Thumbnail [122 KiB] tex code |

|
|
Double-differential cross-sections times dimuon branching fraction in different bins of $p_{\rm T}$ and $y$ for $\Upsilon{(3S)} $ (in $\rm pb$ ). The first uncertainty is statistical and the second is systematic. |
Table_4.pdf [49 KiB] HiDef png [273 KiB] Thumbnail [125 KiB] tex code |

|
|
The cross-section ratios between 13 TeV and 8 TeV in different bins of $p_{\rm T}$ and $y$ for $\Upsilon{(1S)}$ . |
Table_5.pdf [49 KiB] HiDef png [257 KiB] Thumbnail [126 KiB] tex code |

|
|
The cross-section ratios between 13 TeV and 8 TeV in different bins of $p_{\rm T}$ and $y$ for $\Upsilon{(2S)}$ . |
Table_6.pdf [49 KiB] HiDef png [253 KiB] Thumbnail [125 KiB] tex code |

|
|
The cross-section ratios between 13 TeV and 8 TeV in different bins of $p_{\rm T}$ and $y$ for $\Upsilon{(3S)}$ . |
Table_7.pdf [49 KiB] HiDef png [253 KiB] Thumbnail [126 KiB] tex code |

|
![HiDef png [99 KiB]](Directory_LHCb-PAPER-2018-002/hidef_Table_1.png)
![HiDef png [269 KiB]](Directory_LHCb-PAPER-2018-002/hidef_Table_2.png)
![HiDef png [279 KiB]](Directory_LHCb-PAPER-2018-002/hidef_Table_3.png)
![HiDef png [273 KiB]](Directory_LHCb-PAPER-2018-002/hidef_Table_4.png)
![HiDef png [257 KiB]](Directory_LHCb-PAPER-2018-002/hidef_Table_5.png)
![HiDef png [253 KiB]](Directory_LHCb-PAPER-2018-002/hidef_Table_6.png)
![HiDef png [253 KiB]](Directory_LHCb-PAPER-2018-002/hidef_Table_7.png)
Created on 12 April 2024.