Information
LHCb-PAPER-2018-037
CERN-EP-2018-293
arXiv:1812.06004 [PDF]
(Submitted on 14 Dec 2018)
Eur. Phys. J. C 79 (2019) 675
Inspire 1709439
Tools
Abstract
A search for the rare leptonic decay B+→μ+μ−μ+νμ is performed using proton-proton collision data corresponding to an integrated luminosity of 4.7 fb−1 collected by the LHCb experiment. The search is carried out in the region where the lowest of the two μ+μ− mass combinations is below 980MeV/c2. The data are consistent with the background-only hypothesis and an upper limit of 1.6×10⁻⁸ at 95 confidence level is set on the branching fraction in the stated kinematic region.
Figures and captions
|
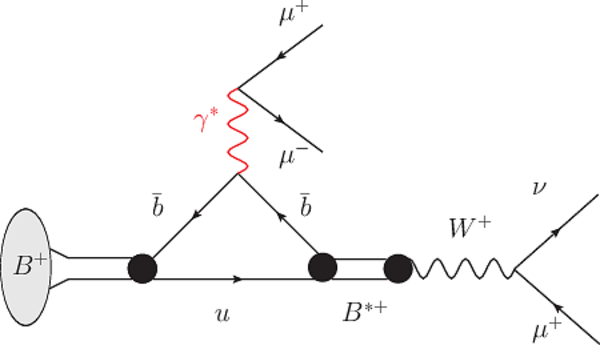
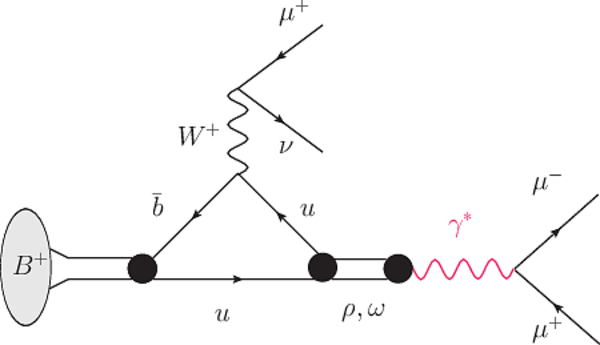
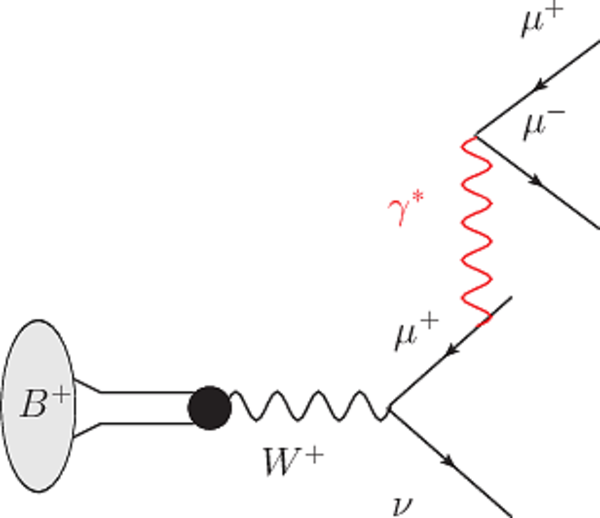
Feynman diagrams of the contributions (top left) B+→μ+νμγ∗ with γ∗→μ+μ−, (top right) B+→μ+νμV and (bottom) bremsstrahlung to the B+→μ+μ−μ+νμ decay. |
Figure_1A.eps [168 KiB] HiDef png [179 KiB] Thumbnail [88 KiB] *.C file |
|
|
Figure_1B.eps [169 KiB] HiDef png [178 KiB] Thumbnail [89 KiB] *.C file |
|
|
|
Figure_1C.eps [152 KiB] HiDef png [243 KiB] Thumbnail [137 KiB] *.C file |
|
|
|
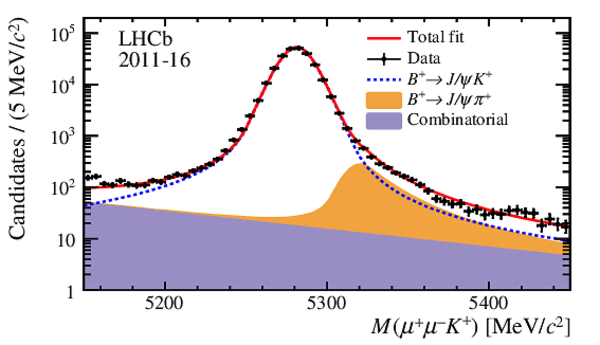
Fit to the mass distribution of the selected B+→J/ψK+ candidates. The combinatorial background (purple) and misidentified B+→J/ψπ+ decays (orange) are stacked up while the B+→J/ψK+ signal is shown as a dashed line. The data points are shown as black points with the total fit overlaid as a red solid line. |
Figure_2.eps [34 KiB] HiDef png [363 KiB] Thumbnail [189 KiB] *.C file |
|
|
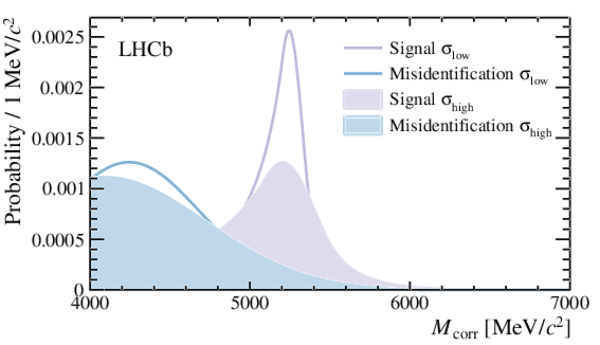
Template distributions for signal and misidentified background shapes for high and low fractional corrected mass uncertainty. A low uncertainty on the corrected mass corresponds to data with better mass resolution. The shape of the misidentification template is obtained from a control sample while the signal template is obtained from simulation. A systematic uncertainty on the signal shape due to the choice of the signal model is not shown, as it is too small to be visible. |
Figure_3.pdf [91 KiB] HiDef png [376 KiB] Thumbnail [186 KiB] *.C file |
|
|
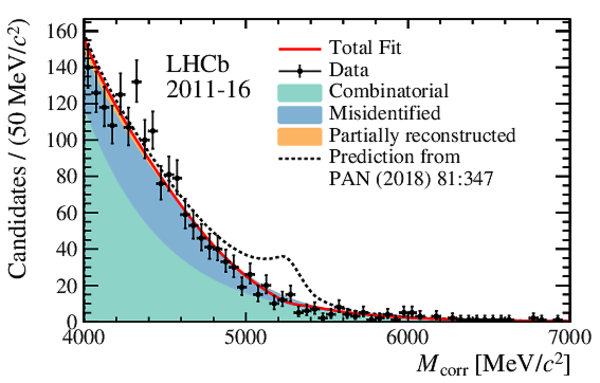
Corrected mass distribution of the selected B+→μ+μ−μ+νμ candidates with the fit overlaid. Samples with low and high corrected mass uncertainty are fitted as individual samples but are merged in the figure. The fit has components for (green) combinatorial background, (blue) misidentified candidates and (orange) partially reconstructed candidates. The signal component is not visible as the fitted signal yield is negative. The best fit is the solid red line while the dashed line shows how the total would have looked like if the signal had the branching fraction predicted in Ref. [11]. |
Figure_4.pdf [22 KiB] HiDef png [479 KiB] Thumbnail [246 KiB] *.C file |
|
|
Animated gif made out of all figures. |
PAPER-2018-037.gif Thumbnail |

|
![HiDef png [179 KiB]](Directory_LHCb-PAPER-2018-037/hidef_Figure_1A.png)
![HiDef png [178 KiB]](Directory_LHCb-PAPER-2018-037/hidef_Figure_1B.png)
![HiDef png [243 KiB]](Directory_LHCb-PAPER-2018-037/hidef_Figure_1C.png)
![HiDef png [363 KiB]](Directory_LHCb-PAPER-2018-037/hidef_Figure_2.png)
![HiDef png [376 KiB]](Directory_LHCb-PAPER-2018-037/hidef_Figure_3.png)
![HiDef png [479 KiB]](Directory_LHCb-PAPER-2018-037/hidef_Figure_4.png)
Tables and captions
|
Summary of systematic uncertainties. Numbers are on the relative uncertainty of the normalisation for the branching fraction of the signal. |
Table_1.pdf [57 KiB] HiDef png [59 KiB] Thumbnail [26 KiB] tex code |

|
![HiDef png [59 KiB]](Directory_LHCb-PAPER-2018-037/hidef_Table_1.png)
Created on 05 April 2025.