Information
LHCb-PAPER-2018-039
CERN-EP-2018-336
arXiv:1902.05884 [PDF]
(Submitted on 15 Feb 2019)
JHEP 04 (2019) 063
Inspire 1720423
Tools
Abstract
The resonant structure of the doubly Cabibbo-suppressed decay D+→K−K+K+ is studied for the first time. The measurement is based on a sample of pp-collision data, collected at a centre-of-mass energy of 8 TeV with the LHCb detector and corresponding to an integrated luminosity of 2 fb−1. The amplitude analysis of this decay is performed with the isobar model and a phenomenological model based on an effective chiral Lagrangian. In both models the S-wave component in the K−K+ system is dominant, with a small contribution of the ϕ(1020) meson and a negligible contribution from tensor resonances. The K−K+ scattering amplitudes for the considered combinations of spin (0,1) and isospin (0,1) of the two-body system are obtained from the Dalitz plot fit with the phenomenological decay amplitude.
Figures and captions
|
Invariant-mass spectrum of the K−K+K+ candidates with the fit result overlaid (solid blue line). The orange and green dashed lines indicate the two Gaussian functions representing the signal and the red dashed line is the background. |
Fig1.pdf [35 KiB] HiDef png [307 KiB] Thumbnail [157 KiB] *.C file |

|
|
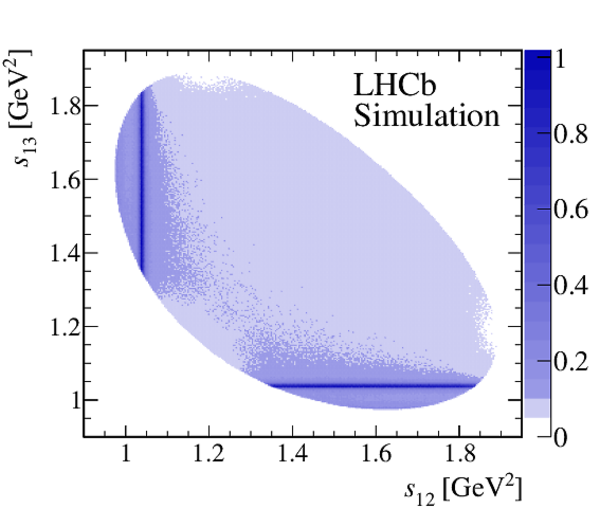
(left) Dalitz plot of the selected sample, including background. (right) Dalitz plot projections for candidates from regions I (blue) and II (red), above and below sK−K+=1.5 GeV2 . The interference between the S- and P-wave amplitudes cause the asymmetry in the number of candidates in the two regions, as well as the shift in the peak position. Both figures include all candidates in the selected mass range. |
Fig2a.pdf [20 KiB] HiDef png [262 KiB] Thumbnail [231 KiB] *.C file |

|
|
Fig2b.pdf [14 KiB] HiDef png [236 KiB] Thumbnail [152 KiB] *.C file |

|
|
|
Total efficiency, normalised to unity, for the D+→K−K+K+ signal over the Dalitz plot, including the geometrical acceptance and the reconstruction, selection, PID and trigger efficiencies. |
Fig3.pdf [178 KiB] HiDef png [1 MiB] Thumbnail [584 KiB] *.C file |

|
|
Projection onto sK+K− of K−K+K+ candidates with invariant mass in the range 1820--1830 MeV. |
Fig4.pdf [25 KiB] HiDef png [347 KiB] Thumbnail [173 KiB] *.C file |

|
|
High-resolution histogram representing the background model used in the Dalitz plot fits. |
Fig5.pdf [184 KiB] HiDef png [982 KiB] Thumbnail [492 KiB] *.C file |
|
|
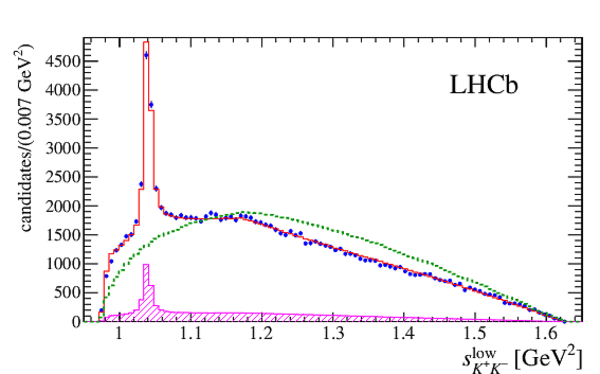
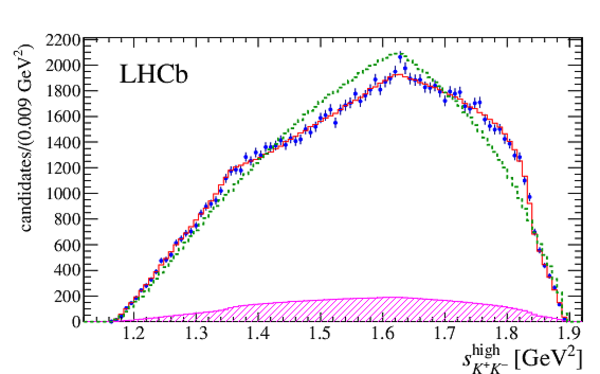
Projections of the Dalitz plot onto (top left) sK+K−, (top right) sK+K+, (bottom left) shighK+K− and (bottom right) slowK+K− axes, with the fit result with model A overlaid (red histogram). The histogram in magenta represents the contribution from the background, whereas the dashed green line is the phase-space distribution weighted by the efficiency. |
Fig6a.pdf [22 KiB] HiDef png [294 KiB] Thumbnail [158 KiB] *.C file |

|
|
Fig6b.pdf [22 KiB] HiDef png [355 KiB] Thumbnail [196 KiB] *.C file |

|
|
|
Fig6c.pdf [22 KiB] HiDef png [353 KiB] Thumbnail [189 KiB] *.C file |

|
|
|
Fig6d.pdf [21 KiB] HiDef png [291 KiB] Thumbnail [159 KiB] *.C file |
|
|
|
(left) Normalised residuals Δi across the Dalitz plot, from the result of isobar fit. (right) Distribution of the normalised residuals with the fit result overlaid. The distribution is fitted with a Gaussian function and the fit result is consistent with the standard normal distribution. |
Fig7a.pdf [32 KiB] HiDef png [318 KiB] Thumbnail [280 KiB] *.C file |

|
|
Fig7b.pdf [15 KiB] HiDef png [237 KiB] Thumbnail [141 KiB] *.C file |

|
|
|
(left) Magnitude and (right) phase of the total S-wave from the result of the Dalitz plot fit with the isobar model. The black line corresponds to model A and the green band represents the statistical and systematic uncertainties added in quadrature. For comparison, the results of models B and C are shown as the blue solid and dashed thick red lines. Uncertainties on the S-wave magnitude and phase for models B and C are similar to those from model A and are not shown. |
Fig8a.pdf [24 KiB] HiDef png [579 KiB] Thumbnail [225 KiB] *.C file |

|
|
Fig8b.pdf [23 KiB] HiDef png [479 KiB] Thumbnail [193 KiB] *.C file |

|
|
|
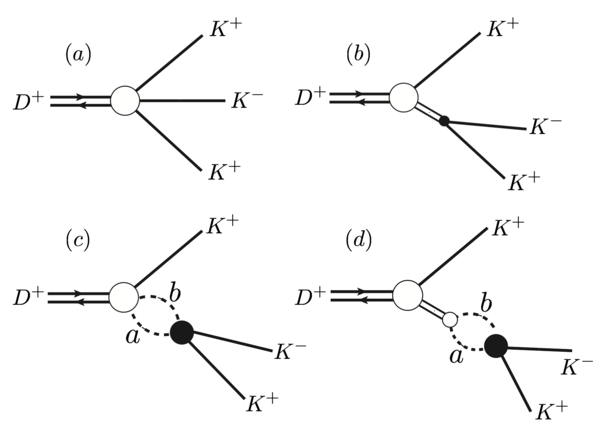
Diagrams representing the two quark-level topologies for the D+→K−K+K+ decay. In the Triple-M [3], diagram (a) is assumed to be the dominant mechanism of the decay, whereas diagram (b) is suppressed since the production of a K+K− pair from a dˉd pair requires rescattering. |
Fig9.png [157 KiB] HiDef png [42 KiB] Thumbnail [16 KiB] *.C file |

|
|
Diagrams contributing to the amplitude T for the decay D+→K−K+K+: (a) the final state kaons are produced directly from the weak vertex; (b) a bare resonance is produced directly from the weak vertex; (c) particles produced at the weak vertex undergo final state interactions; (d) final state interactions endow finite widths to the resonances. The full circle represents the unitary ab→K+K− scattering amplitude with angular momentum J and isospin I, and ab=K¯K, ππ, ηπ and ηη. |
Fig10.png [182 KiB] HiDef png [130 KiB] Thumbnail [51 KiB] *.C file |
|
|
Projections of the Dalitz plot onto (top left) sK+K−, (top right) sK+K+, (bottom left) shighK+K− and (bottom right) slowK+K− axes, with the fit result with the Triple-M amplitude superimposed, whereas the dashed green line is the phase space distribution weighted by the efficiency. The magenta histogram represents the contribution from the background. |
Fig11a.pdf [22 KiB] HiDef png [294 KiB] Thumbnail [158 KiB] *.C file |

|
|
Fig11b.pdf [22 KiB] HiDef png [354 KiB] Thumbnail [195 KiB] *.C file |

|
|
|
Fig11c.pdf [22 KiB] HiDef png [353 KiB] Thumbnail [189 KiB] *.C file |
|
|
|
Fig11d.pdf [21 KiB] HiDef png [291 KiB] Thumbnail [159 KiB] *.C file |

|
|
|
(left) Two-dimensional distribution of the normalised residuals for the Triple-M fit. (right) Distribution of normalised residuals of each bin. |
Fig12a.pdf [32 KiB] HiDef png [318 KiB] Thumbnail [279 KiB] *.C file |

|
|
Fig12b.pdf [15 KiB] HiDef png [233 KiB] Thumbnail [140 KiB] *.C file |

|
|
|
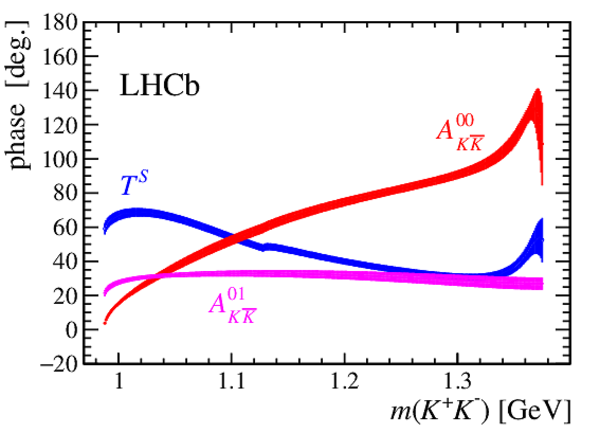
Phase of the J=0 component of the decay amplitude (blue) TS=T00+T01+TSNR, compared to the phases of the scattering amplitudes, (red) A00K+K− and (magenta) A01K+K− as a function of the K+K− invariant mass. |
Fig13.pdf [83 KiB] HiDef png [310 KiB] Thumbnail [168 KiB] *.C file |
|
|
(top) Phase-shifts δ0IK+K− and (bottom) inelasticities η0I as a function of the K+K− invariant mass, for both isospin states. |
Fig14a.pdf [21 KiB] HiDef png [188 KiB] Thumbnail [111 KiB] *.C file |

|
|
Fig14b.pdf [21 KiB] HiDef png [193 KiB] Thumbnail [120 KiB] *.C file |

|
|
|
Fig14c.pdf [20 KiB] HiDef png [175 KiB] Thumbnail [110 KiB] *.C file |

|
|
|
Fig14d.pdf [20 KiB] HiDef png [167 KiB] Thumbnail [102 KiB] *.C file |

|
|
|
Animated gif made out of all figures. |
PAPER-2018-039.gif Thumbnail |

|
![HiDef png [307 KiB]](Directory_LHCb-PAPER-2018-039/hidef_Fig1.png)
![HiDef png [262 KiB]](Directory_LHCb-PAPER-2018-039/hidef_Fig2a.png)
![HiDef png [236 KiB]](Directory_LHCb-PAPER-2018-039/hidef_Fig2b.png)
![HiDef png [1 MiB]](Directory_LHCb-PAPER-2018-039/hidef_Fig3.png)
![HiDef png [347 KiB]](Directory_LHCb-PAPER-2018-039/hidef_Fig4.png)
![HiDef png [982 KiB]](Directory_LHCb-PAPER-2018-039/hidef_Fig5.png)
![HiDef png [294 KiB]](Directory_LHCb-PAPER-2018-039/hidef_Fig6a.png)
![HiDef png [355 KiB]](Directory_LHCb-PAPER-2018-039/hidef_Fig6b.png)
![HiDef png [353 KiB]](Directory_LHCb-PAPER-2018-039/hidef_Fig6c.png)
![HiDef png [291 KiB]](Directory_LHCb-PAPER-2018-039/hidef_Fig6d.png)
![HiDef png [318 KiB]](Directory_LHCb-PAPER-2018-039/hidef_Fig7a.png)
![HiDef png [237 KiB]](Directory_LHCb-PAPER-2018-039/hidef_Fig7b.png)
![HiDef png [579 KiB]](Directory_LHCb-PAPER-2018-039/hidef_Fig8a.png)
![HiDef png [479 KiB]](Directory_LHCb-PAPER-2018-039/hidef_Fig8b.png)
![Fig9.png [157 KiB]](Directory_LHCb-PAPER-2018-039/Fig9.png)
![HiDef png [42 KiB]](Directory_LHCb-PAPER-2018-039/hidef_Fig9.png)
![Fig10.png [182 KiB]](Directory_LHCb-PAPER-2018-039/Fig10.png)
![HiDef png [130 KiB]](Directory_LHCb-PAPER-2018-039/hidef_Fig10.png)
![HiDef png [294 KiB]](Directory_LHCb-PAPER-2018-039/hidef_Fig11a.png)
![HiDef png [354 KiB]](Directory_LHCb-PAPER-2018-039/hidef_Fig11b.png)
![HiDef png [353 KiB]](Directory_LHCb-PAPER-2018-039/hidef_Fig11c.png)
![HiDef png [291 KiB]](Directory_LHCb-PAPER-2018-039/hidef_Fig11d.png)
![HiDef png [318 KiB]](Directory_LHCb-PAPER-2018-039/hidef_Fig12a.png)
![HiDef png [233 KiB]](Directory_LHCb-PAPER-2018-039/hidef_Fig12b.png)
![HiDef png [310 KiB]](Directory_LHCb-PAPER-2018-039/hidef_Fig13.png)
![HiDef png [188 KiB]](Directory_LHCb-PAPER-2018-039/hidef_Fig14a.png)
![HiDef png [193 KiB]](Directory_LHCb-PAPER-2018-039/hidef_Fig14b.png)
![HiDef png [175 KiB]](Directory_LHCb-PAPER-2018-039/hidef_Fig14c.png)
![HiDef png [167 KiB]](Directory_LHCb-PAPER-2018-039/hidef_Fig14d.png)
Tables and captions
|
Results from the D+→K−K+K+ Dalitz plot fit with the isobar models A, B and C. Magnitudes, |ck| , phases, arg(ck) (in degrees), and fit fractions (in %) are given with statistical uncertainties only. |
Table_1.pdf [74 KiB] HiDef png [121 KiB] Thumbnail [42 KiB] tex code |

|
|
Fit results with model A, given in terms of the magnitudes |ck|, phases, arg(ck) (in degrees), and fit fractions (in %). For each measurement, the first uncertainty is statistical, the second systematic and the third is a systematic uncertainty due to model. |
Table_2.pdf [72 KiB] HiDef png [44 KiB] Thumbnail [21 KiB] tex code |

|
|
Results of the D+→K−K+K+ Dalitz plot fit with the Triple-M amplitude. |
Table_3.pdf [106 KiB] HiDef png [148 KiB] Thumbnail [73 KiB] tex code |

|
|
Relative fractions (%) of the various components of the Triple-M amplitude. The uncertainties correspond to the combined statistical and systematic uncertainties. |
Table_4.pdf [72 KiB] HiDef png [17 KiB] Thumbnail [9 KiB] tex code |

|
|
Systematic uncertainties (%) on the results of the isobar model fit. For comparison, the statistical uncertainties are listed in the last column. |
Table_5.pdf [88 KiB] HiDef png [58 KiB] Thumbnail [29 KiB] tex code |

|
|
Systematic uncertainties (%) on the results of the Triple-M fit. For comparison, the statistcal uncertainties are listed in the last column. |
Table_6.pdf [81 KiB] HiDef png [79 KiB] Thumbnail [38 KiB] tex code |

|
|
Blatt--Weisskopf form factors for angular momentum L=0,1,2 with two distinct formulations. |
Table_7.pdf [93 KiB] HiDef png [55 KiB] Thumbnail [28 KiB] tex code |

|
![HiDef png [121 KiB]](Directory_LHCb-PAPER-2018-039/hidef_Table_1.png)
![HiDef png [44 KiB]](Directory_LHCb-PAPER-2018-039/hidef_Table_2.png)
![HiDef png [148 KiB]](Directory_LHCb-PAPER-2018-039/hidef_Table_3.png)
![HiDef png [17 KiB]](Directory_LHCb-PAPER-2018-039/hidef_Table_4.png)
![HiDef png [58 KiB]](Directory_LHCb-PAPER-2018-039/hidef_Table_5.png)
![HiDef png [79 KiB]](Directory_LHCb-PAPER-2018-039/hidef_Table_6.png)
![HiDef png [55 KiB]](Directory_LHCb-PAPER-2018-039/hidef_Table_7.png)
Created on 05 April 2025.