Observation of the doubly Cabibbo-suppressed decay $\Xi_{c}^{+}\to p\phi$
[to restricted-access page]Information
LHCb-PAPER-2018-040
CERN-EP-2018-349
arXiv:1901.06222 [PDF]
(Submitted on 18 Jan 2019)
JHEP 04 (2019) 084
Inspire 1714986
Tools
Abstract
The doubly Cabibbo-suppressed decay $\Xi_{c}^{+}\to p\phi$ with $\phi\to K^{+}K^{-}$ is observed for the first time, with a statistical significance of more than fifteen standard deviations. The data sample used in this analysis corresponds to an integrated luminosity of 2 fb$^{-1}$ recorded with the LHCb detector in $pp$ collisions at a centre-of-mass energy of 8 TeV. The ratio of branching fractions between the decay $\Xi_{c}^{+}\to p\phi$ and the singly Cabibbo-suppressed decay $\Xi_{c}^{+}\to pK^{-}\pi^{+}$ is measured to be \begin{equation*} \frac{\mathcal{B}(\Xi_{c}^{+}\to p\phi)}{\mathcal{B}(\Xi_{c}^{+}\to pK^{-}\pi^{+})} = (19.8 \pm 0.7 \pm 0.9 \pm 0.2) \times 10^{-3}, \end{equation*} where the first uncertainty is statistical, the second systematic and the third due to the knowledge of the $\phi\to K^{+}K^{-}$ branching fraction.
Figures and captions
|
Tree quark diagram for the $\Xi ^+_ c \rightarrow p \phi $ decay. |
Fig_1.pdf [17 KiB] HiDef png [1 KiB] Thumbnail [0 KiB] tex code |

|
|
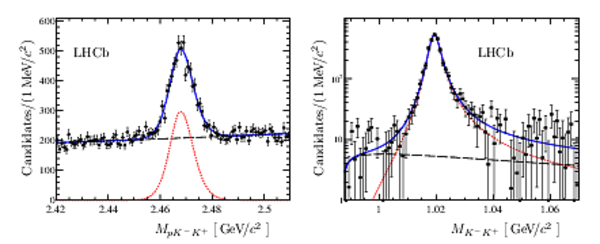
(Left) Fit results for the $\Xi ^+_ c \rightarrow p K ^- K ^+ $ decay. The candidates are selected in the $\phi $ meson region, i.e. with the requirement of $ M_{ K ^- K ^+ } <1.07 {\mathrm{ Ge V /}c^2} $. The red dotted line corresponds to the signal component, the black dashed line reflects the background distribution, and the blue solid line is their sum. (Right) Background subtracted $ K ^- K ^+ $ mass distribution for the $\Xi ^+_ c \rightarrow p K ^- K ^+ $ decay. The red dotted line shows the $\Xi ^+_ c \rightarrow p \phi $ contribution, the black dashed line represents the non- $\phi $ contribution, and the solid blue line is the total fit function. |
Fig_2.pdf [111 KiB] HiDef png [219 KiB] Thumbnail [190 KiB] tex code |
|
|
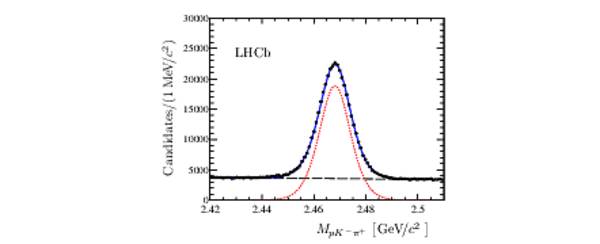
Fit results for the $\Xi ^+_ c \rightarrow p K ^- \pi ^+ $ decay. The red dotted line corresponds to the signal component, the black dashed line reflects the background distribution and the blue solid line is their sum. |
Fig_3.pdf [89 KiB] HiDef png [98 KiB] Thumbnail [79 KiB] tex code |
|
|
Animated gif made out of all figures. |
PAPER-2018-040.gif Thumbnail |

|
![HiDef png [1 KiB]](Directory_LHCb-PAPER-2018-040/hidef_Fig_1.png)
![HiDef png [219 KiB]](Directory_LHCb-PAPER-2018-040/hidef_Fig_2.png)
![HiDef png [98 KiB]](Directory_LHCb-PAPER-2018-040/hidef_Fig_3.png)
Tables and captions
|
Systematic uncertainties relative to the central value of the ratio $R_{p\phi}$. |
Table_1.pdf [58 KiB] HiDef png [110 KiB] Thumbnail [49 KiB] tex code |

|
![HiDef png [110 KiB]](Directory_LHCb-PAPER-2018-040/hidef_Table_1.png)
Created on 20 April 2024.