Information
LHCb-PAPER-2018-051
CERN-EP-2019-062
arXiv:1905.09244 [PDF]
(Submitted on 22 May 2019)
Phys. Rev. Lett. 123 (2019) 231802
Inspire 1736300
Tools
Abstract
The first amplitude analysis of the $B^\pm \to \pi^\pm K^+ K^-$ decay is reported based on a data sample corresponding to an integrated luminosity of 3.0 fb$^{-1}$ of $pp$ collisions recorded in 2011 and 2012 with the LHCb detector. The data is found to be best described by a coherent sum of five resonant structures plus a nonresonant component and a contribution from $\pi\pi \leftrightarrow KK$ $S$-wave rescattering. The dominant contributions in the $\pi^\pm K^\mp$ and $K^{+}K^{-}$ systems are the nonresonant and the $B^\pm \to \rho(1450)^{0}\pi^{\pm}$ amplitudes, respectively, with fit fractions around $30\%$. For the rescattering contribution, a sizeable fit fraction is observed. This component has the largest $CP$ asymmetry reported to date for a single amplitude of $(-66 \pm 4 \pm 2)\%$, where the first uncertainty is statistical and the second systematic. No significant $CP$ violation is observed in the other contributions.
Figures and captions
|
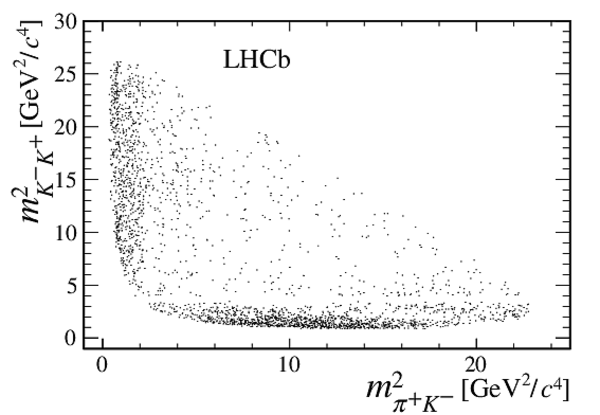
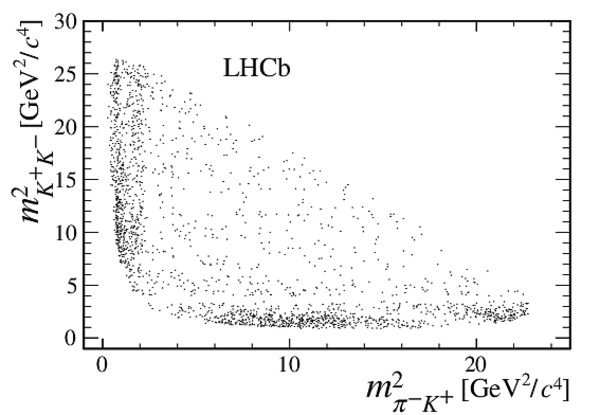
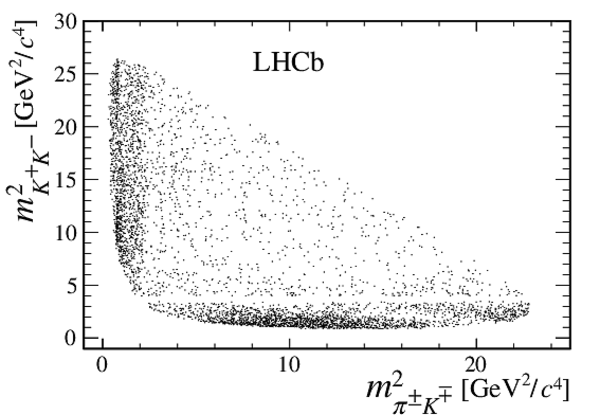
Dalitz plot for (left) $ { B ^+ \rightarrow \pi ^+ K ^- K ^+ }$ and (right) $ { B ^- \rightarrow \pi ^- K ^+ K ^- }$ candidates in the selected signal region. |
DP_plu[..].pdf [42 KiB] HiDef png [148 KiB] Thumbnail [87 KiB] *.C file |
|
|
DP_min[..].pdf [37 KiB] HiDef png [140 KiB] Thumbnail [86 KiB] *.C file |
|
|
|
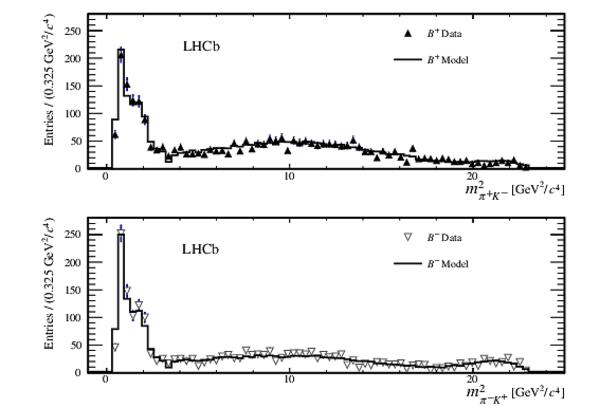
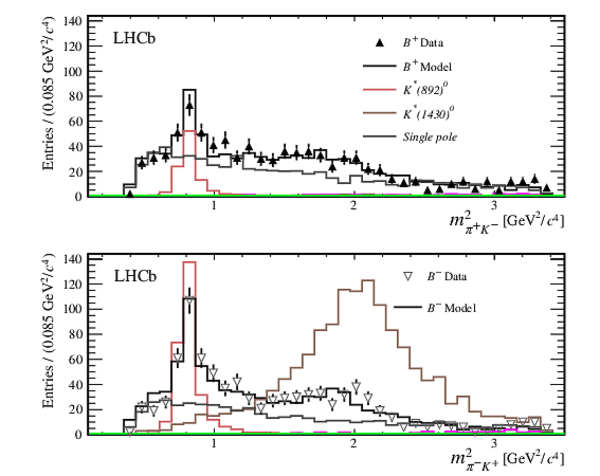
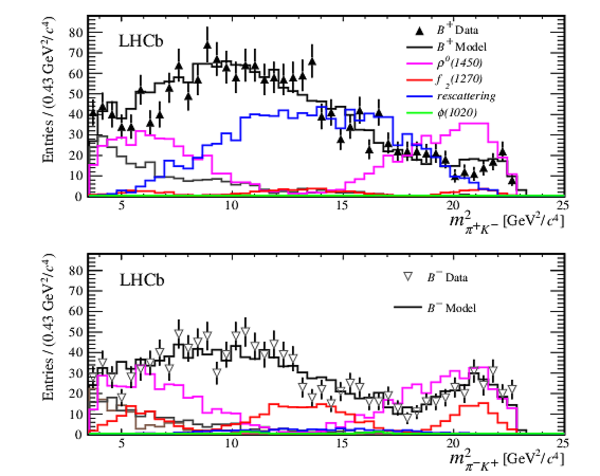
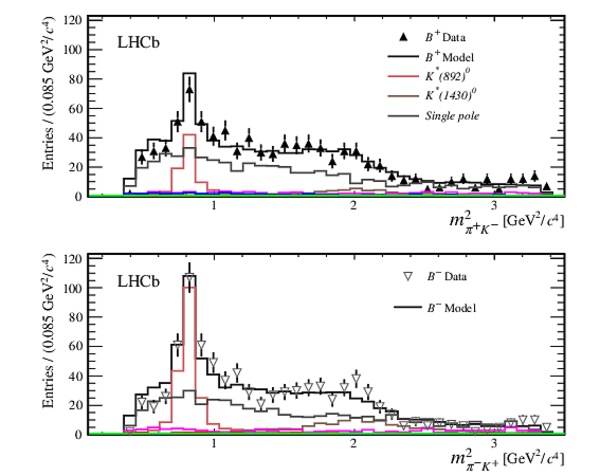
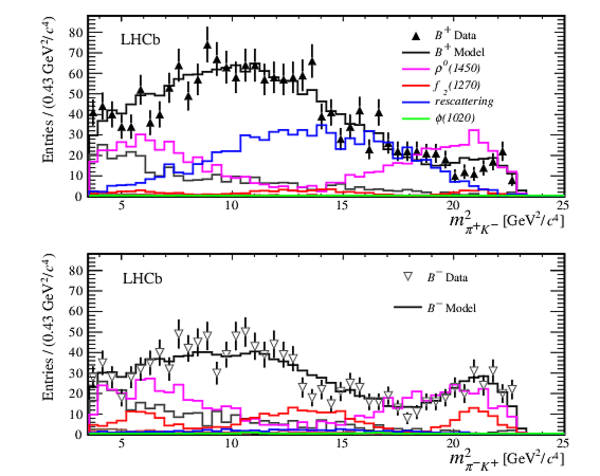
Distribution of $ m^2_{\pi ^\pm K ^\mp }$ . Data are represented by points for $ B ^+ $ and $ B ^- $ candidates separately, with the result of the fit overlaid. |
mkpi_a[..].pdf [19 KiB] HiDef png [166 KiB] Thumbnail [168 KiB] *.C file |
|
|
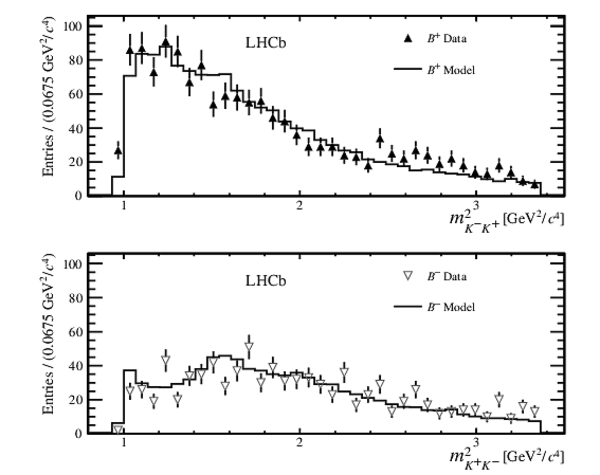
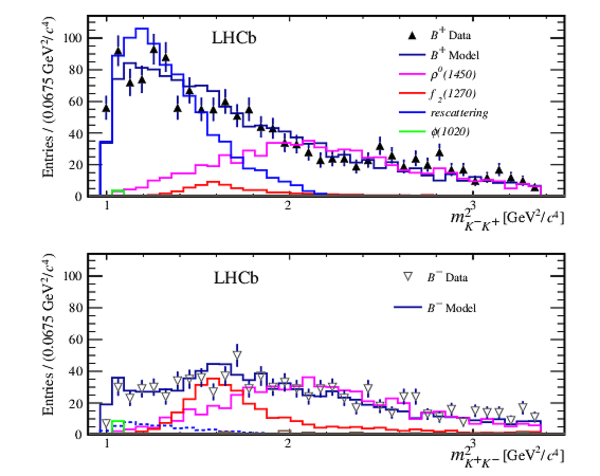
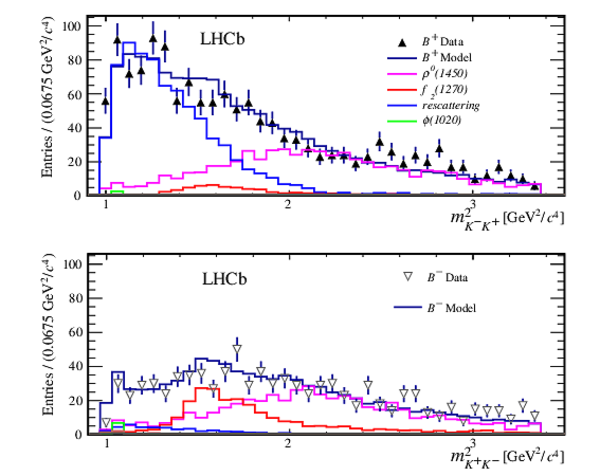
Distribution of $ m^2_{ K ^+ K ^- }$ up to 3.5 $\text{ Ge V} ^2/c^4$ . Data are represented by points for $ B ^+ $ and $ B ^- $ separately, with the result of the fit overlaid. |
mkk_lo[..].pdf [18 KiB] HiDef png [141 KiB] Thumbnail [82 KiB] *.C file |
|
|
Animated gif made out of all figures. |
PAPER-2018-051.gif Thumbnail |

|
![HiDef png [148 KiB]](Directory_LHCb-PAPER-2018-051/hidef_DP_plus_paper.png)
![HiDef png [140 KiB]](Directory_LHCb-PAPER-2018-051/hidef_DP_minus_paper.png)
![HiDef png [166 KiB]](Directory_LHCb-PAPER-2018-051/hidef_mkpi_all_paper_Components_separated.png)
![HiDef png [141 KiB]](Directory_LHCb-PAPER-2018-051/hidef_mkk_low_paper_Components_separated.png)
Tables and captions
|
Results of the Dalitz plot fit, where the first uncertainty is statistical and the second systematic. The fitted values of $c_i$ ($\bar c_i$) are expressed in terms of magnitudes $|c_i|$ ($|\bar c_i|$) and phases $\arg(c_i)$ ($\arg(\bar c_i)$) for each $ B ^+ $ ( $ B ^- $ ) contribution. The top row corresponds to $ B ^+ $ and the bottom to $ B ^- $ mesons. |
Table_1.pdf [73 KiB] HiDef png [92 KiB] Thumbnail [44 KiB] tex code |

|
![HiDef png [92 KiB]](Directory_LHCb-PAPER-2018-051/hidef_Table_1.png)
Supplementary Material [file]
| Supplementary material full pdf |
supple[..].pdf [387 KiB] |

|
|
This ZIP file contains supplemetary material for the publication LHCb-PAPER-2018-051. The files are: Supplementary.pdf : An overview of the extra figures *.pdf, *.png, *.eps : The figures in variuous formats *.tex : Tables included in this section in .tex format |
Fig10.pdf [64 KiB] HiDef png [200 KiB] Thumbnail [110 KiB] *C file |
|
|
Fig4.pdf [20 KiB] HiDef png [232 KiB] Thumbnail [228 KiB] *C file |
|
|
|
Fig5.pdf [23 KiB] HiDef png [297 KiB] Thumbnail [304 KiB] *C file |
|
|
|
Fig6.pdf [20 KiB] HiDef png [271 KiB] Thumbnail [237 KiB] *C file |
|
|
|
Fig7.pdf [20 KiB] HiDef png [230 KiB] Thumbnail [229 KiB] *C file |
|
|
|
Fig8.pdf [24 KiB] HiDef png [302 KiB] Thumbnail [308 KiB] *C file |
|
|
|
Fig9.pdf [20 KiB] HiDef png [260 KiB] Thumbnail [235 KiB] *C file |
|
![HiDef png [200 KiB]](Directory_LHCb-PAPER-2018-051/supplementary/hidef_Fig10.png)
![HiDef png [232 KiB]](Directory_LHCb-PAPER-2018-051/supplementary/hidef_Fig4.png)
![HiDef png [297 KiB]](Directory_LHCb-PAPER-2018-051/supplementary/hidef_Fig5.png)
![HiDef png [271 KiB]](Directory_LHCb-PAPER-2018-051/supplementary/hidef_Fig6.png)
![HiDef png [230 KiB]](Directory_LHCb-PAPER-2018-051/supplementary/hidef_Fig7.png)
![HiDef png [302 KiB]](Directory_LHCb-PAPER-2018-051/supplementary/hidef_Fig8.png)
![HiDef png [260 KiB]](Directory_LHCb-PAPER-2018-051/supplementary/hidef_Fig9.png)
Created on 20 April 2024.