A search for $\it{\Xi}^{++}_{cc} \rightarrow D^{+} p K^{-} \pi^{+}$ decays
[to restricted-access page]Information
LHCb-PAPER-2019-011
CERN-EP-2019-067
arXiv:1905.02421 [PDF]
(Submitted on 07 May 2019)
JHEP 10 (2019) 124
Inspire 1733762
Tools
Abstract
A search for the $\it{\Xi}^{++}_{cc}$ baryon through the $\it{\Xi}^{++}_{cc} \rightarrow D^{+} p K^{-} \pi^{+}$ decay is performed with a data sample corresponding to an integrated luminosity of 1.7 $\mathrm{fb}^{-1}$ recorded by the LHCb experiment in $pp$ collisions at a centre-of-mass energy of 13 TeV. No significant signal is observed in the mass range from the kinematic threshold of the decay to 3800 $\mathrm{MeV}/c^{2}$. An upper limit is set on the ratio of branching fractions $\mathcal{R} = \frac{\mathcal{B}(\it{\Xi}^{++}_{cc} \rightarrow D^{+} p K^{-} \pi^{+})}{\mathcal{B}(\it{\Xi}^{++}_{cc} \rightarrow \Lambda^{+}_{c} K^{-} \pi^{+}\pi^{+})}$ with $\mathcal{R} < 1.7 \hspace{2pt} (2.1) \times 10^{-2}$ at the 90 (95) confidence level at the known mass of the $\it{\Xi}^{++}_{cc}$ state.
Figures and captions
|
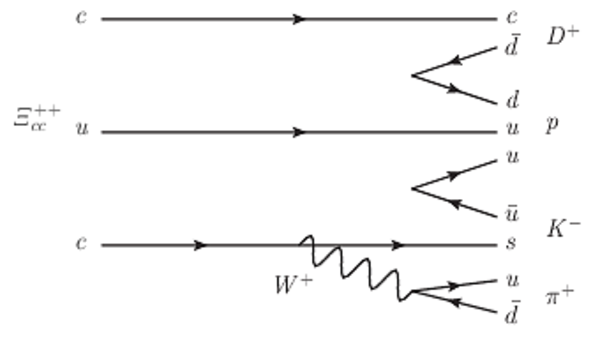
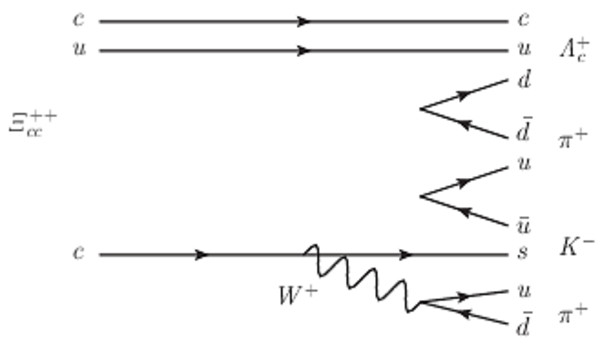
The Feynman diagram contributing to the inclusive (left) $\Xi _{ c c }^{++}\rightarrow D ^+ p K ^- \pi ^+ $ decay with the analogous (right) $\Xi _{ c c }^{++}\rightarrow \Lambda _ c ^+ K ^- \pi ^+ \pi ^+ $ diagram. |
pub-Dp[..].pdf [20 KiB] HiDef png [139 KiB] Thumbnail [81 KiB] *.C file |
|
|
pub-Lc[..].pdf [20 KiB] HiDef png [147 KiB] Thumbnail [86 KiB] *.C file |
|
|
|
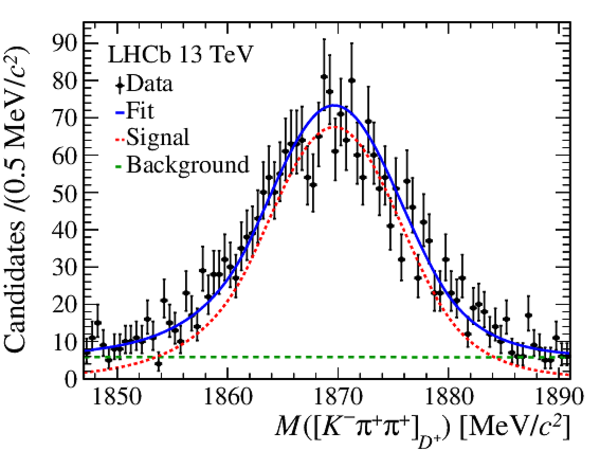
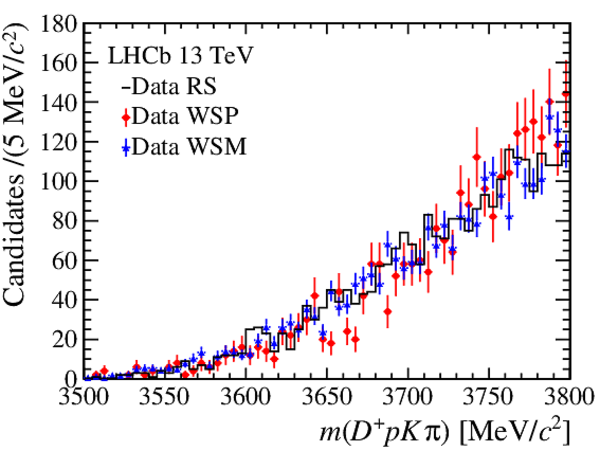
(left) Invariant-mass distribution of the $ D ^+$ candidates after the full selection. The black points represent data and the fit is indicated by the continuous (blue) line with the individual signal and background components represented by the dotted (red) line and dashed (green) line, respectively. (right) Invariant-mass distributions of right-sign (black) $ D ^+ p K ^- \pi ^+ $, wrong-sign-plus (red) $ D ^+ p K ^+ \pi ^+ $ and wrong-sign-minus (blue) $ D ^+ p K ^- \pi ^- $ data combinations are shown. The control samples have been normalised to the right-sign sample. |
pub-Dp[..].pdf [25 KiB] HiDef png [305 KiB] Thumbnail [279 KiB] *.C file |
|
|
pub-co[..].pdf [22 KiB] HiDef png [281 KiB] Thumbnail [242 KiB] *.C file |
|
|
|
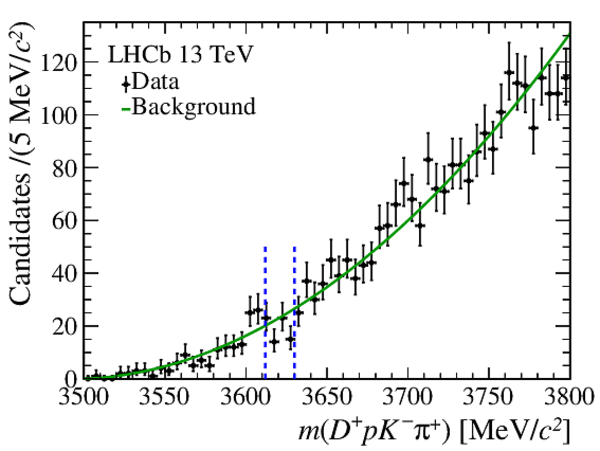
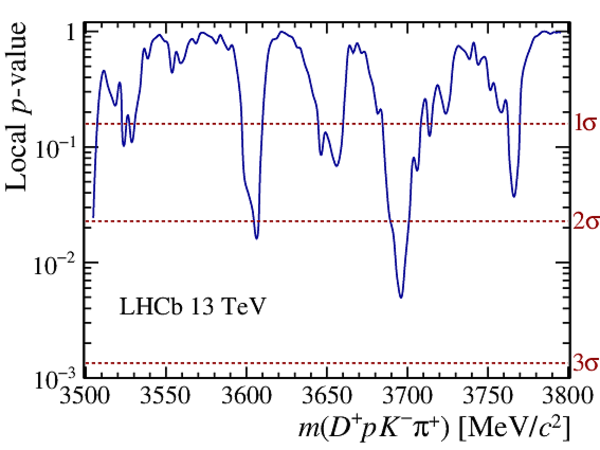
(left) Invariant-mass distribution of the ${\Xi _{ c c }^{++}\rightarrow D ^+ p K ^- \pi ^+ }$ candidates with the fit overlaid. The black points represent data, the continuous (green) line represents the combinatorial background and the two vertical parallel dashed (blue) lines define the region where the signal is expected. (right) The local p-value expressing the compatibility of the data with the background-only hypothesis. The horizontal dashed (red) lines indicate p-values of 1, 2 and 3$\sigma$ local significance. |
pub-Xi[..].pdf [20 KiB] HiDef png [246 KiB] Thumbnail [215 KiB] *.C file |
|
|
pub-Xi[..].pdf [18 KiB] HiDef png [337 KiB] Thumbnail [219 KiB] *.C file |
|
|
|
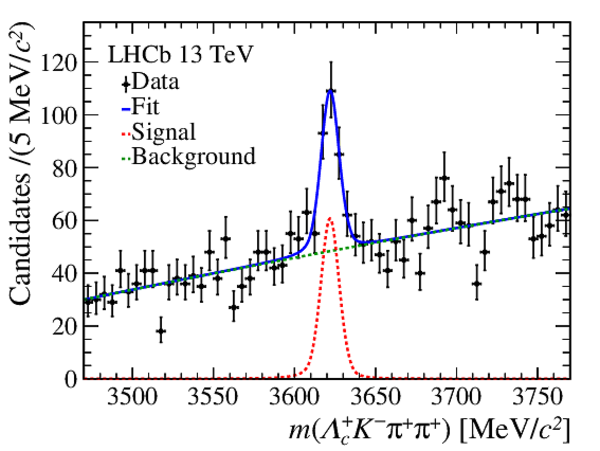
Invariant-mass distribution of the ${\Xi _{ c c }^{++}\rightarrow \Lambda _ c ^+ K ^- \pi ^+ \pi ^+ }$ candidates with the fit overlaid. The black points represent data, the dashed (green) line represents combinatorial background, the dotted (red) line represents the signal contribution and the continuous (blue) line is the total fit. |
pub-Lc[..].pdf [23 KiB] HiDef png [286 KiB] Thumbnail [243 KiB] *.C file |
|
|
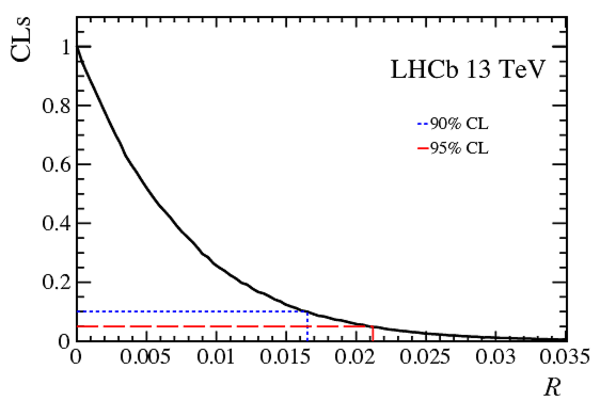
The scores from the \texttt{CLs} method for each value of the assumed ratio of branching fractions $\mathcal{R}$. Observed values are shown by the solid black line. The set upper limits at 90% and 95% CL are indicated by the dotted (blue) line and the dashed (red) line, respectively. |
pub-Cls-R.pdf [16 KiB] HiDef png [123 KiB] Thumbnail [115 KiB] *.C file |
|
|
Animated gif made out of all figures. |
PAPER-2019-011.gif Thumbnail |

|
![HiDef png [139 KiB]](Directory_LHCb-PAPER-2019-011/hidef_pub-DpKpi-feynman.png)
![HiDef png [147 KiB]](Directory_LHCb-PAPER-2019-011/hidef_pub-LcKpipi-feynman.png)
![HiDef png [305 KiB]](Directory_LHCb-PAPER-2019-011/hidef_pub-Dp-mass.png)
![HiDef png [281 KiB]](Directory_LHCb-PAPER-2019-011/hidef_pub-controlmodes-mass.png)
![HiDef png [246 KiB]](Directory_LHCb-PAPER-2019-011/hidef_pub-Xicc-mass.png)
![HiDef png [337 KiB]](Directory_LHCb-PAPER-2019-011/hidef_pub-Xicc-pValues.png)
![HiDef png [286 KiB]](Directory_LHCb-PAPER-2019-011/hidef_pub-LcKpipi-mass.png)
![HiDef png [123 KiB]](Directory_LHCb-PAPER-2019-011/hidef_pub-Cls-R.png)
Tables and captions
|
Systematic and statistical uncertainties on the single-event sensitivity $\alpha_{s}$. |
Table_1.pdf [39 KiB] HiDef png [142 KiB] Thumbnail [60 KiB] tex code |

|
![HiDef png [142 KiB]](Directory_LHCb-PAPER-2019-011/hidef_Table_1.png)
Created on 20 April 2024.