Measurement of charged hadron production in $Z$-tagged jets in proton-proton collisions at $\sqrt{s}=8$ TeV
[to restricted-access page]Information
LHCb-PAPER-2019-012
CERN-EP-2019-065
arXiv:1904.08878 [PDF]
(Submitted on 18 Apr 2019)
Phys. Rev. Lett. 123 (2019) 232001
Inspire 1730448
Tools
Abstract
The production of charged hadrons within jets recoiling against a $Z$ boson is measured in proton-proton collision data at $\sqrt{s}=8$ TeV recorded by the LHCb experiment. The charged-hadron structure of the jet is studied longitudinally and transverse to the jet axis for jets with transverse momentum $p_{\mathrm{T}}>20$ GeV and in the pseudorapidity range $2.5<\eta<4$. These are the first measurements of jet hadronization at these forward rapidities and also the first where the jet is produced in association with a $Z$ boson. In contrast to previous hadronization measurements at the Large Hadron Collider, which are dominated by gluon jets, these measurements probe predominantly light-quark jets which are found to be more longitudinally and transversely collimated with respect to the jet axis when compared to the previous gluon dominated measurements. Therefore, these results provide valuable information on differences between quarks and gluons regarding nonperturbative hadronization dynamics.
Figures and captions
|
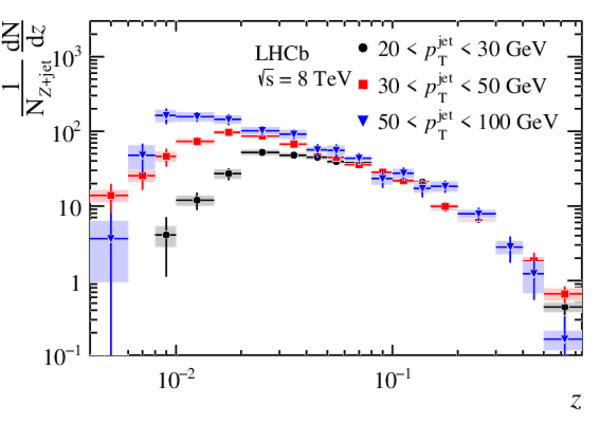
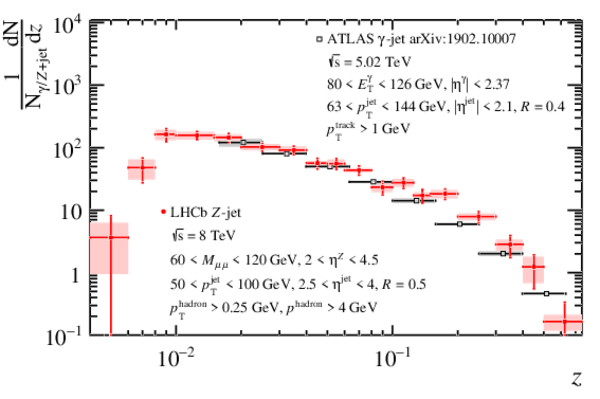
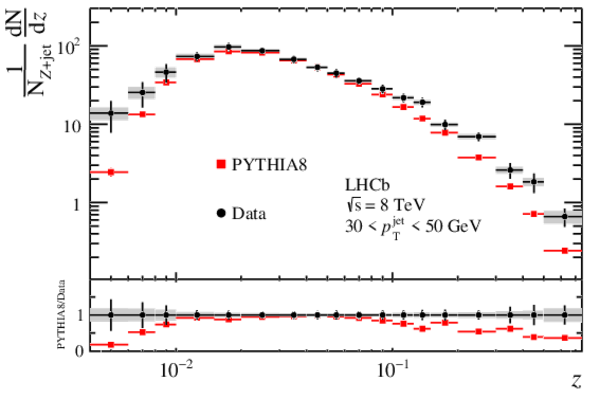
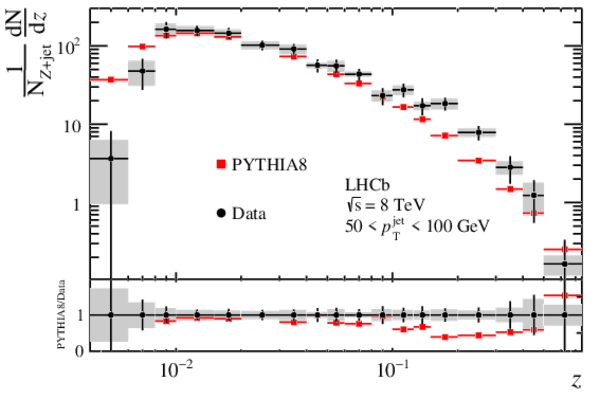
Distributions of the longitudinal momentum fraction of the hadron with respect to the jet in three bins of jet $ p_{\mathrm{T}}$ . The bars (boxes) show the statistical (systematic) uncertainties. |
Fig1.pdf [18 KiB] HiDef png [202 KiB] Thumbnail [155 KiB] *.C file |
|
|
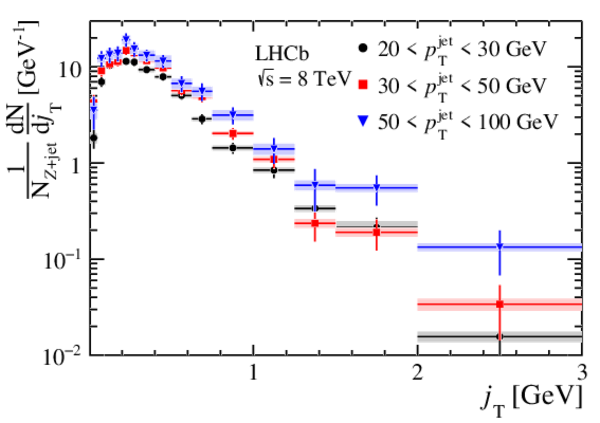
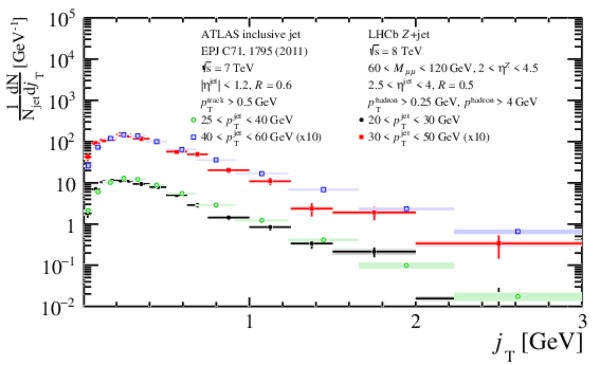
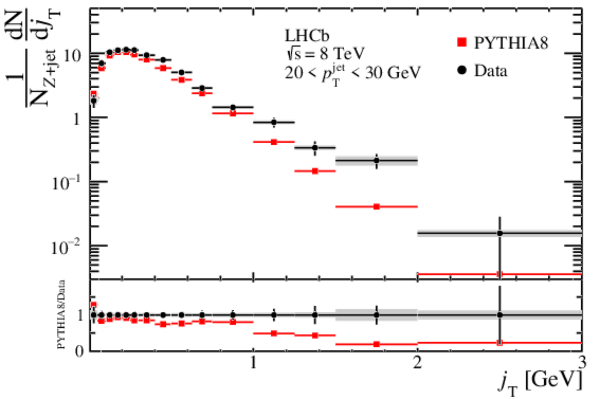
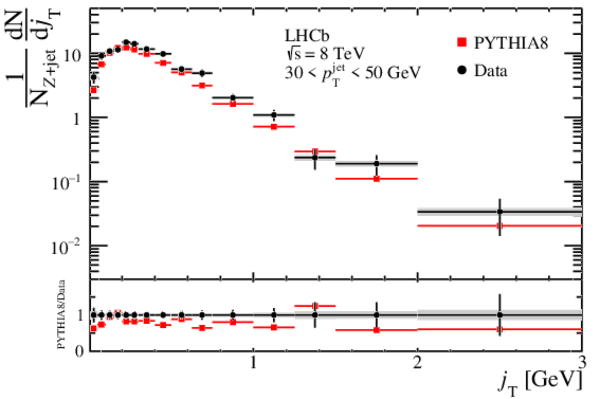
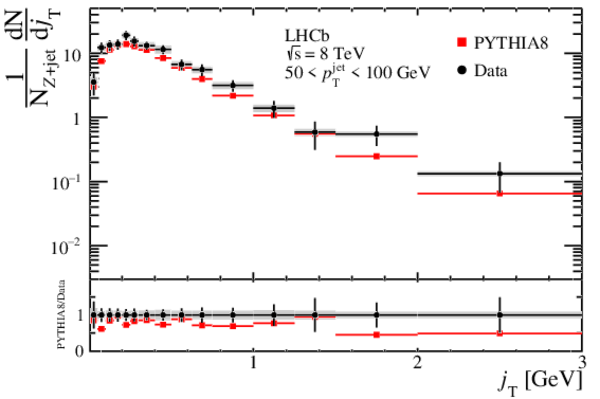
Distributions of the transverse momentum of charged hadrons with respect to the jet axis in three bins of jet $ p_{\mathrm{T}}$ . The bars (boxes) show the statistical (systematic) uncertainties. |
Fig2.pdf [17 KiB] HiDef png [201 KiB] Thumbnail [153 KiB] *.C file |
|
|
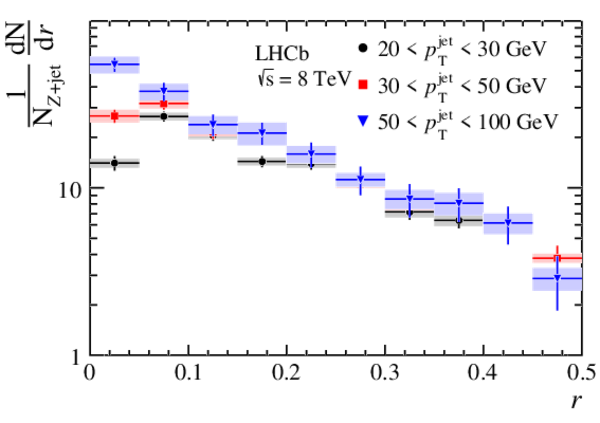
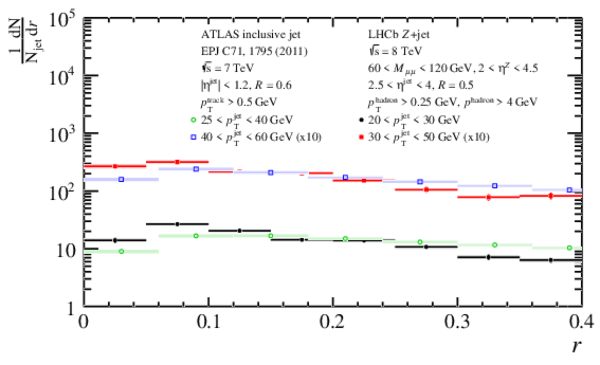
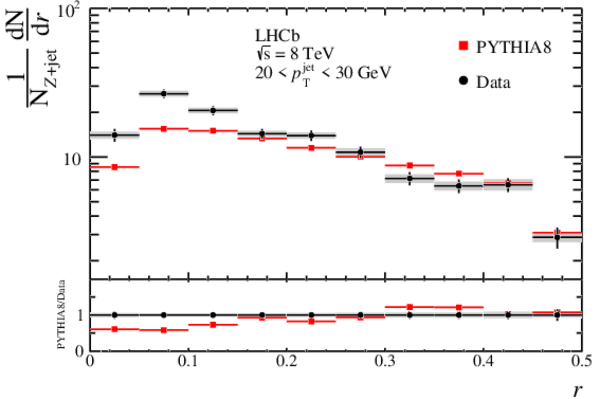
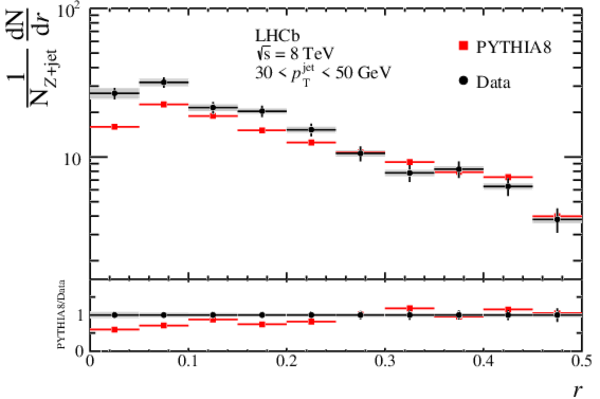
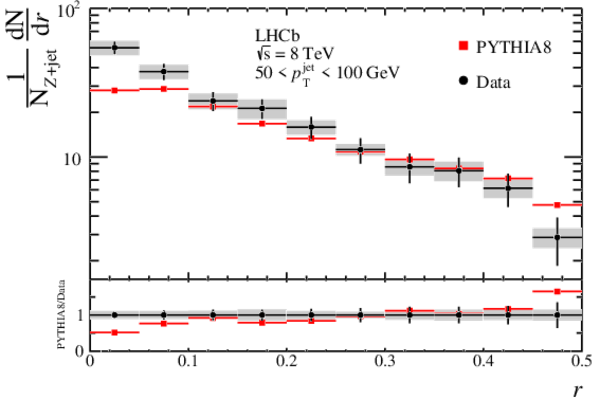
Radial profile distributions of hadrons with respect to the jet axis in three bins of jet $ p_{\mathrm{T}}$ . The bars (boxes) show the statistical (systematic) uncertainties. |
Fig3.pdf [16 KiB] HiDef png [173 KiB] Thumbnail [133 KiB] *.C file |
|
|
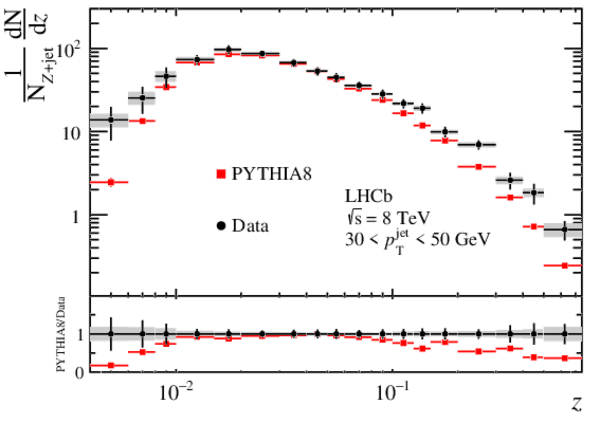
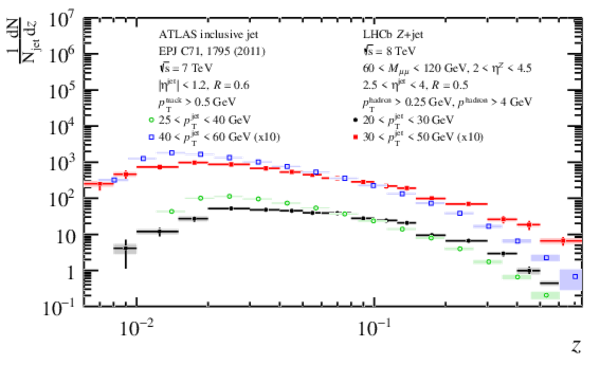
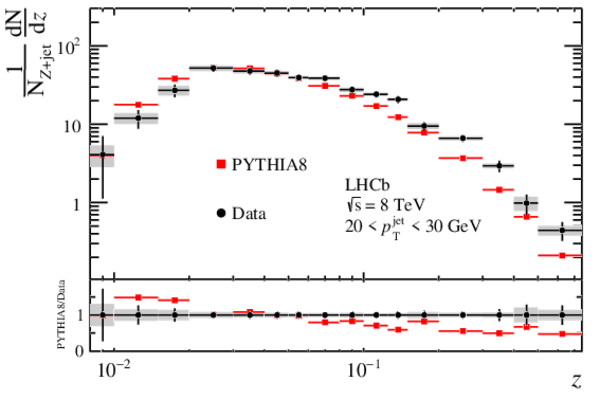
The $z$ distribution for jets with $30< p_{\mathrm{T}} <50\text{ Ge V} $ compared to Pythia 8 simulation predictions. The bars (boxes) show the statistical (systematic) uncertainties. |
Fig4.pdf [19 KiB] HiDef png [183 KiB] Thumbnail [148 KiB] *.C file |
|
|
Animated gif made out of all figures. |
PAPER-2019-012.gif Thumbnail |

|
Supplementary Material [file]
![HiDef png [202 KiB]](Directory_LHCb-PAPER-2019-012/hidef_Fig1.png)
![HiDef png [201 KiB]](Directory_LHCb-PAPER-2019-012/hidef_Fig2.png)
![HiDef png [173 KiB]](Directory_LHCb-PAPER-2019-012/hidef_Fig3.png)
![HiDef png [183 KiB]](Directory_LHCb-PAPER-2019-012/hidef_Fig4.png)
![HiDef png [260 KiB]](Directory_LHCb-PAPER-2019-012/supplementary/hidef_Fig1-S.png)
![HiDef png [182 KiB]](Directory_LHCb-PAPER-2019-012/supplementary/hidef_Fig10-S.png)
![HiDef png [168 KiB]](Directory_LHCb-PAPER-2019-012/supplementary/hidef_Fig11-S.png)
![HiDef png [190 KiB]](Directory_LHCb-PAPER-2019-012/supplementary/hidef_Fig12-S.png)
![HiDef png [253 KiB]](Directory_LHCb-PAPER-2019-012/supplementary/hidef_Fig2-S.png)
![HiDef png [225 KiB]](Directory_LHCb-PAPER-2019-012/supplementary/hidef_Fig3-S.png)
![HiDef png [255 KiB]](Directory_LHCb-PAPER-2019-012/supplementary/hidef_Fig4-S.png)
![HiDef png [166 KiB]](Directory_LHCb-PAPER-2019-012/supplementary/hidef_Fig5a-S.png)
![HiDef png [178 KiB]](Directory_LHCb-PAPER-2019-012/supplementary/hidef_Fig5b-S.png)
![HiDef png [184 KiB]](Directory_LHCb-PAPER-2019-012/supplementary/hidef_Fig5c-S.png)
![HiDef png [168 KiB]](Directory_LHCb-PAPER-2019-012/supplementary/hidef_Fig6a-S.png)
![HiDef png [169 KiB]](Directory_LHCb-PAPER-2019-012/supplementary/hidef_Fig6b-S.png)
![HiDef png [174 KiB]](Directory_LHCb-PAPER-2019-012/supplementary/hidef_Fig6c-S.png)
![HiDef png [154 KiB]](Directory_LHCb-PAPER-2019-012/supplementary/hidef_Fig7a-S.png)
![HiDef png [155 KiB]](Directory_LHCb-PAPER-2019-012/supplementary/hidef_Fig7b-S.png)
![HiDef png [160 KiB]](Directory_LHCb-PAPER-2019-012/supplementary/hidef_Fig7c-S.png)
![HiDef png [284 KiB]](Directory_LHCb-PAPER-2019-012/supplementary/hidef_Fig8-S.png)
![HiDef png [265 KiB]](Directory_LHCb-PAPER-2019-012/supplementary/hidef_Fig9-S.png)
Created on 20 April 2024.