Search for the lepton-flavour-violating decays $B^{0}_{s}\to\tau^{\pm}\mu^{\mp}$ and $B^{0}\to\tau^{\pm}\mu^{\mp}$
[to restricted-access page]Information
LHCb-PAPER-2019-016
CERN-EP-2019-076
arXiv:1905.06614 [PDF]
(Submitted on 16 May 2019)
Phys. Rev. Lett. 123 (2019) 211801
Inspire 1735300
Tools
Abstract
A search for $B^{0}_{s}\to\tau^{\pm}\mu^{\mp}$ and $B^{0}\to\tau^{\pm}\mu^{\mp}$ decays is performed using data corresponding to an integrated luminosity of 3 fb$^{-1}$ of proton-proton collisions, recorded with the LHCb detector in 2011 and 2012. For this search, the $\tau$ lepton is reconstructed in the $\tau^{-}\to\pi^{-}\pi^{+}\pi^{-}\nu_{\tau}$ channel. No significant signal is observed. Assuming no contribution from $B^{0}\to\tau^{\pm}\mu^{\mp}$ decays, an upper limit is set on the $B^{0}_{s}\to\tau^{\pm}\mu^{\mp}$ branching fraction of $\mathcal{B}\left( B^{0}_{s}\to\tau^{\pm}\mu^{\mp}\right) < 4.2\times 10^{-5}$ at $95\%$ confidence level. If instead no contribution from $B^{0}_{s}\to\tau^{\pm}\mu^{\mp}$ decays is assumed, a limit of $\mathcal{B}\left( B^{0}\to\tau^{\pm}\mu^{\mp}\right) < 1.4\times 10^{-5}$ is obtained at $95\%$ confidence level. These are the first limit on $\mathcal{B}\left( B^{0}_{s}\to\tau^{\pm}\mu^{\mp}\right)$ and the world's best limit on $\mathcal{B}\left( B^{0}\to\tau^{\pm}\mu^{\mp}\right)$.
Figures and captions
|
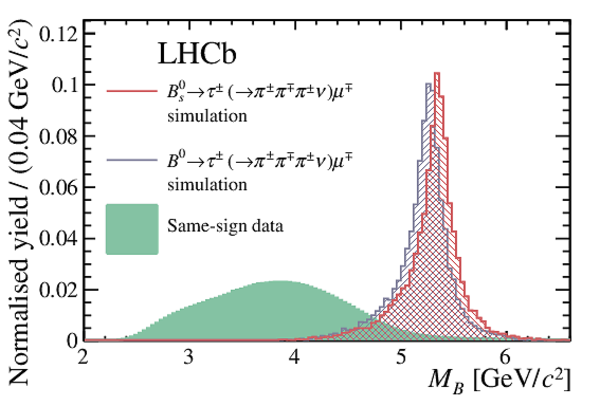
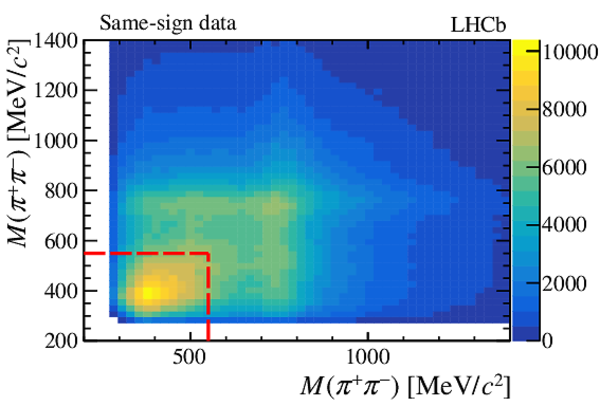
Normalized distributions of the reconstructed invariant mass for $ B ^0_ s $ and $ B ^0$ in simulated event samples and for same-sign candidates in data, after applying the initial event selection (see the text). |
Fig1.pdf [16 KiB] HiDef png [344 KiB] Thumbnail [240 KiB] *.C file |
|
|
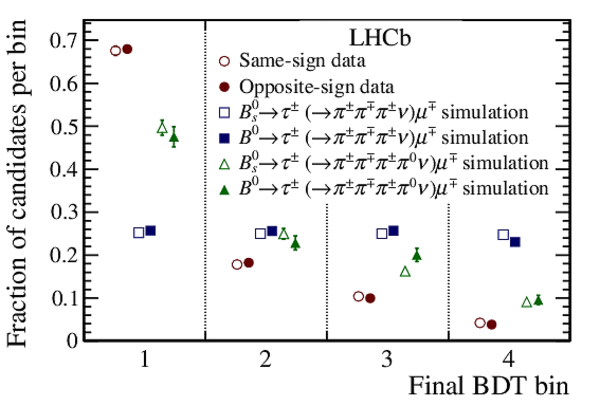
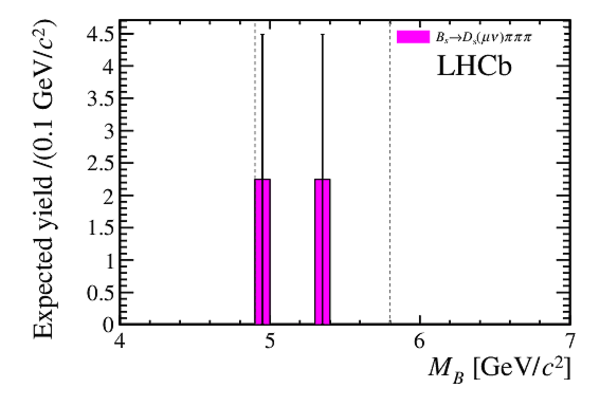
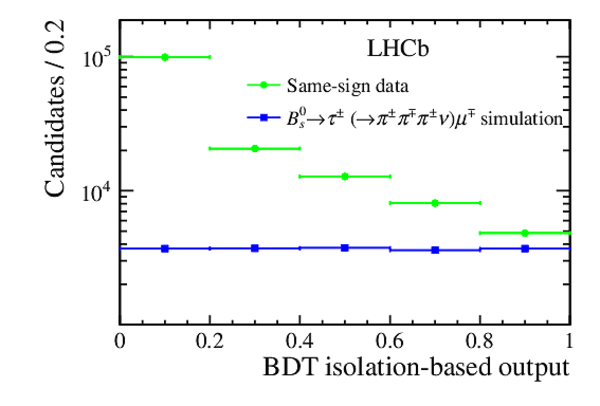
Final BDT output binned distributions for data and simulated signal samples. The markers are displaced horizontally to improve visibility. |
Fig2.pdf [15 KiB] HiDef png [238 KiB] Thumbnail [218 KiB] *.C file |
|
|
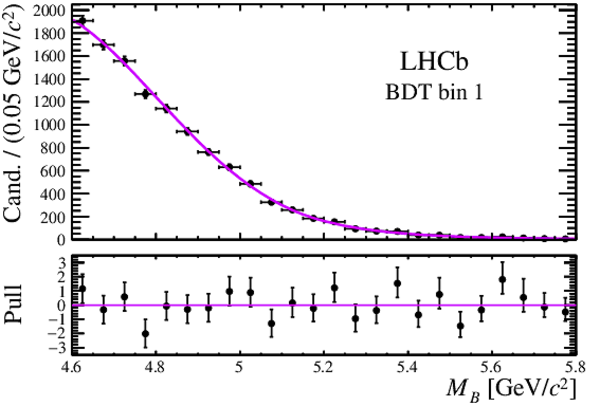
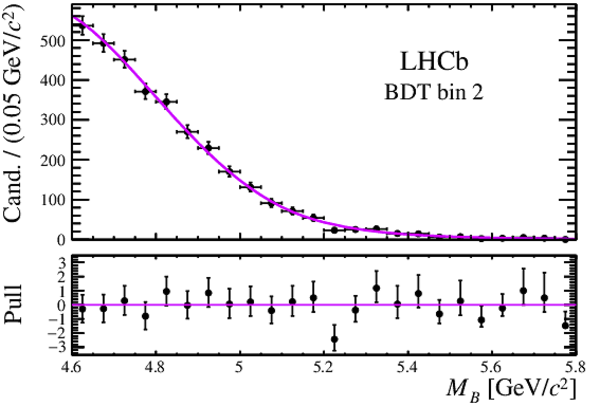
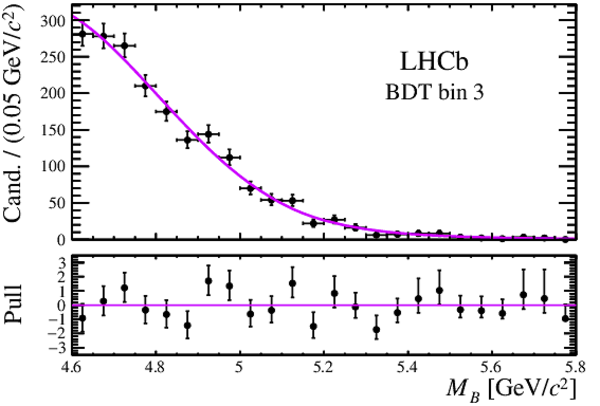
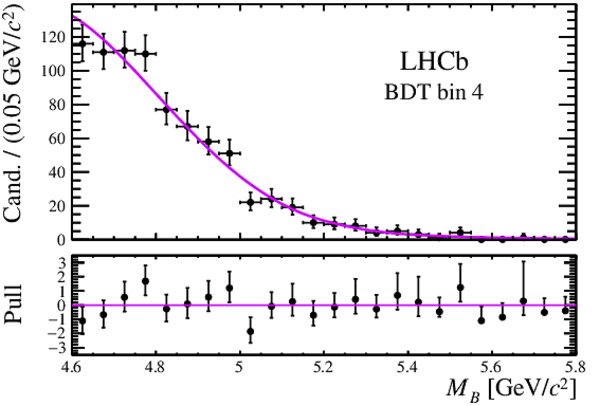
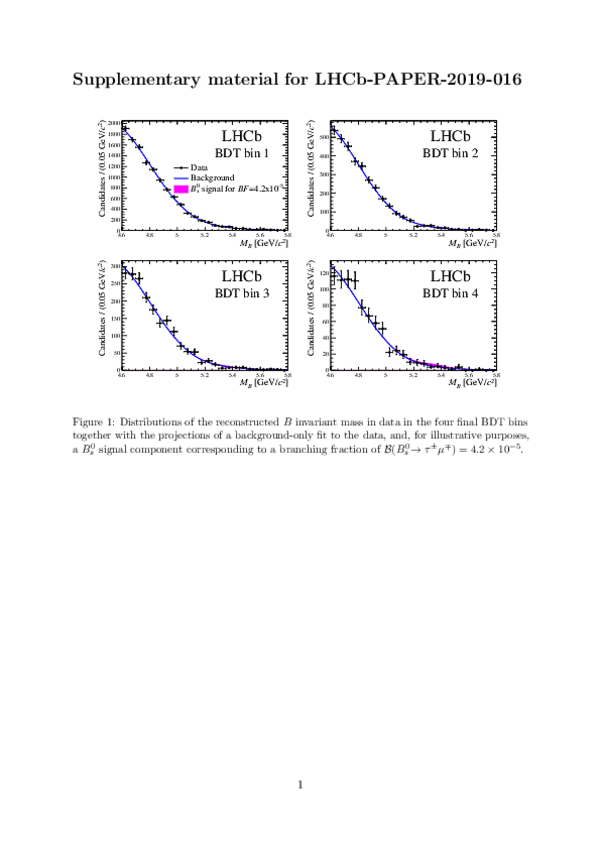
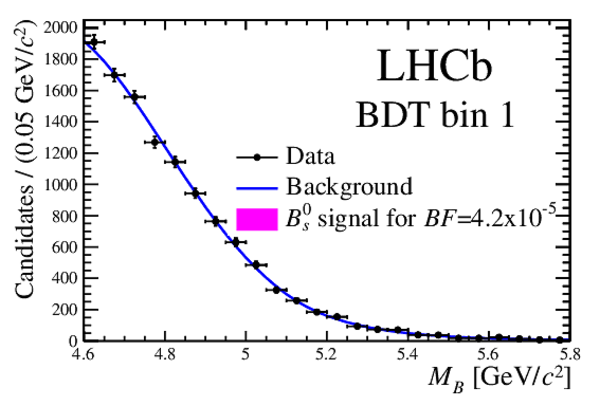
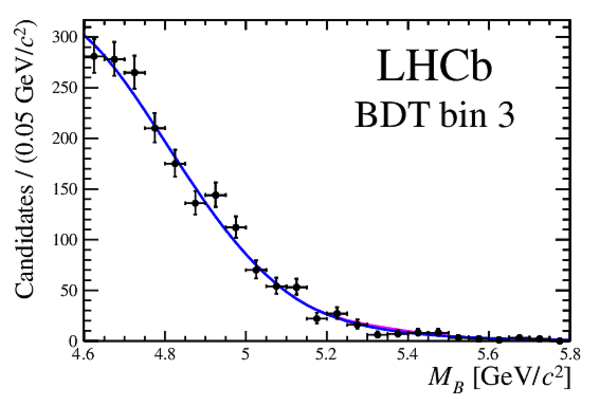
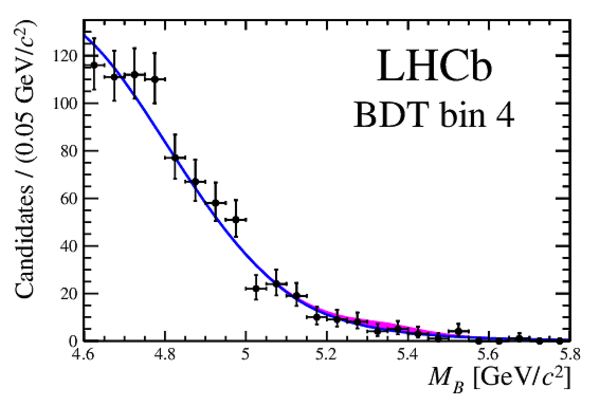
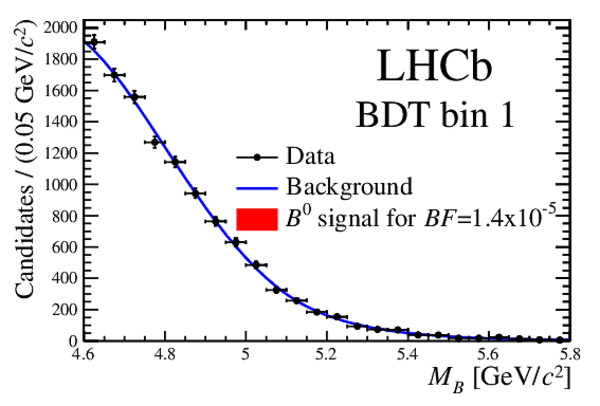
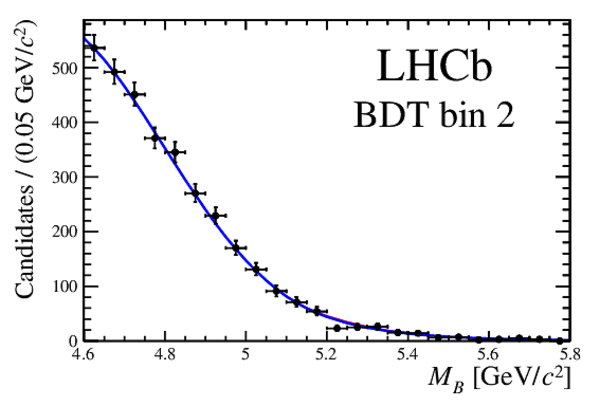
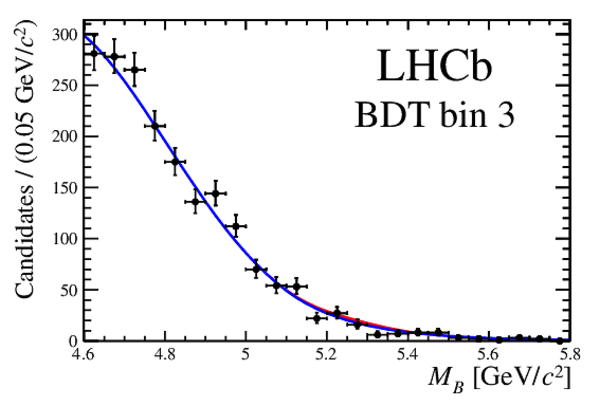
Distributions of the reconstructed $ B $ invariant-mass in data in the four final BDT bins with the projections of the fit for the $ B ^0_ s $ signal-only hypothesis overlaid. The lower-part of each figure shows the normalised residuals. |
Fig3a.pdf [19 KiB] HiDef png [193 KiB] Thumbnail [183 KiB] *.C file |
|
|
Fig3b.pdf [19 KiB] HiDef png [180 KiB] Thumbnail [169 KiB] *.C file |
|
|
|
Fig3c.pdf [19 KiB] HiDef png [181 KiB] Thumbnail [173 KiB] *.C file |
|
|
|
Fig3d.pdf [18 KiB] HiDef png [181 KiB] Thumbnail [173 KiB] *.C file |
|
|
|
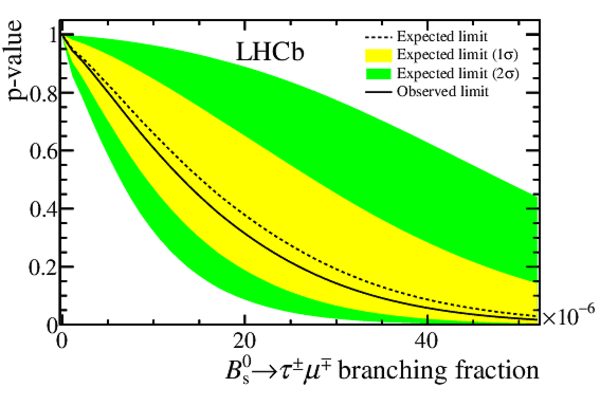
The expected and observed p-values derived with the CLs method as a function of the $ B ^0_ s \rightarrow \tau ^\pm \mu ^\mp $ branching fraction. |
Fig4.pdf [16 KiB] HiDef png [195 KiB] Thumbnail [154 KiB] *.C file |
|
|
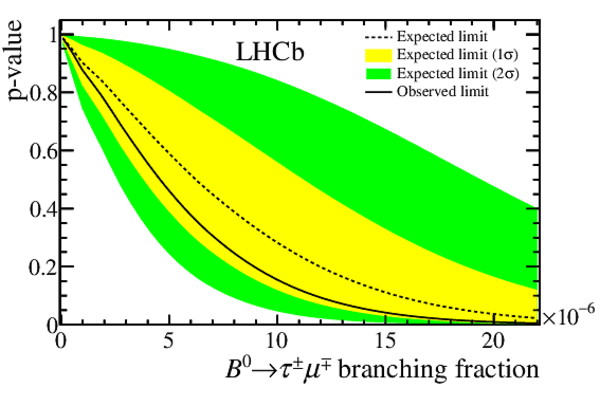
The expected and observed p-values derived with the CLs method as a function of the $ B ^0 \rightarrow \tau ^\pm \mu ^\mp $ branching fraction. |
Fig5.pdf [16 KiB] HiDef png [199 KiB] Thumbnail [157 KiB] *.C file |
|
|
Animated gif made out of all figures. |
PAPER-2019-016.gif Thumbnail |

|
Tables and captions
|
Expected and observed $90\%$ and $95\%$ CL limits on the $ B ^0_{( s )} \rightarrow \tau ^\pm \mu ^\mp $ branching fraction. |
Table_1.pdf [68 KiB] HiDef png [58 KiB] Thumbnail [29 KiB] tex code |

|
Supplementary Material [file]


![HiDef png [344 KiB]](Directory_LHCb-PAPER-2019-016/hidef_Fig1.png)
![HiDef png [238 KiB]](Directory_LHCb-PAPER-2019-016/hidef_Fig2.png)
![HiDef png [193 KiB]](Directory_LHCb-PAPER-2019-016/hidef_Fig3a.png)
![HiDef png [180 KiB]](Directory_LHCb-PAPER-2019-016/hidef_Fig3b.png)
![HiDef png [181 KiB]](Directory_LHCb-PAPER-2019-016/hidef_Fig3c.png)
![HiDef png [181 KiB]](Directory_LHCb-PAPER-2019-016/hidef_Fig3d.png)
![HiDef png [195 KiB]](Directory_LHCb-PAPER-2019-016/hidef_Fig4.png)
![HiDef png [199 KiB]](Directory_LHCb-PAPER-2019-016/hidef_Fig5.png)
![HiDef png [58 KiB]](Directory_LHCb-PAPER-2019-016/hidef_Table_1.png)
![HiDef png [264 KiB]](Directory_LHCb-PAPER-2019-016/supplementary/hidef_Fig10.png)
![HiDef png [254 KiB]](Directory_LHCb-PAPER-2019-016/supplementary/hidef_Fig11.png)
![HiDef png [138 KiB]](Directory_LHCb-PAPER-2019-016/supplementary/hidef_Fig12a.png)
![HiDef png [115 KiB]](Directory_LHCb-PAPER-2019-016/supplementary/hidef_Fig12b.png)
![HiDef png [191 KiB]](Directory_LHCb-PAPER-2019-016/supplementary/hidef_Fig6a.png)
![HiDef png [143 KiB]](Directory_LHCb-PAPER-2019-016/supplementary/hidef_Fig6b.png)
![HiDef png [149 KiB]](Directory_LHCb-PAPER-2019-016/supplementary/hidef_Fig6c.png)
![HiDef png [151 KiB]](Directory_LHCb-PAPER-2019-016/supplementary/hidef_Fig6d.png)
![HiDef png [190 KiB]](Directory_LHCb-PAPER-2019-016/supplementary/hidef_Fig7a.png)
![HiDef png [144 KiB]](Directory_LHCb-PAPER-2019-016/supplementary/hidef_Fig7b.png)
![HiDef png [152 KiB]](Directory_LHCb-PAPER-2019-016/supplementary/hidef_Fig7c.png)
![HiDef png [153 KiB]](Directory_LHCb-PAPER-2019-016/supplementary/hidef_Fig7d.png)
![HiDef png [380 KiB]](Directory_LHCb-PAPER-2019-016/supplementary/hidef_Fig8a.png)
![HiDef png [370 KiB]](Directory_LHCb-PAPER-2019-016/supplementary/hidef_Fig8b.png)
![HiDef png [119 KiB]](Directory_LHCb-PAPER-2019-016/supplementary/hidef_Fig9.png)
Created on 20 April 2024.