Measurement of $C P$ observables in the process $B^0 \to DK^{*0}$ with two- and four-body $D$ decays
[to restricted-access page]Information
LHCb-PAPER-2019-021
CERN-EP-2019-111
arXiv:1906.08297 [PDF]
(Submitted on 19 Jun 2019)
JHEP 08 (2019) 041
Inspire 1740747
Tools
Abstract
Measurements of $C P$ observables in $B^0 \to DK^{*0}$ decays are presented, where $D$ represents a superposition of $D^0$ and $\bar{D}^0$ states. The $D$ meson is reconstructed in the two-body final states $K^+\pi^-$, $\pi^+ K^-$, $K^+K^-$ and $\pi^+\pi^-$, and, for the first time, in the four-body final states $K^+\pi^-\pi^+\pi^-$, $\pi^+ K^-\pi^+\pi^-$ and $\pi^+\pi^-\pi^+\pi^-$. The analysis uses a sample of neutral $B$ mesons produced in proton-proton collisions, corresponding to an integrated luminosity of 1.0, 2.0 and 1.8 $\rm fb^{-1}$ collected with the LHCb detector at centre-of-mass energies of $\sqrt{s} = $ 7, 8 and 13 TeV, respectively. First observations of the decays $B^0 \to D(\pi^+ K^-)K^{*0}$ and $B^0 \to D(\pi^+\pi^-\pi^+\pi^-)K^{*0}$ are obtained. The measured observables are interpreted in terms of the $C P$-violating weak phase $\gamma$.
Figures and captions
|
Feynman diagrams of (left) $ B ^0 \rightarrow D ^0 K ^{*0} $ and (right) $ B ^0 \rightarrow \overline{ D } {}^0 K ^{*0} $. |
Fig1.pdf [49 KiB] HiDef png [34 KiB] Thumbnail [16 KiB] *.C file |

|
|
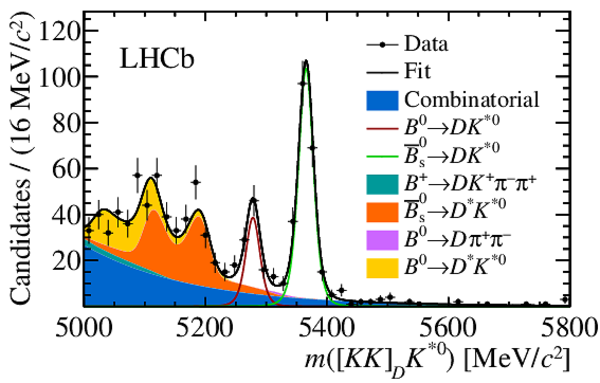
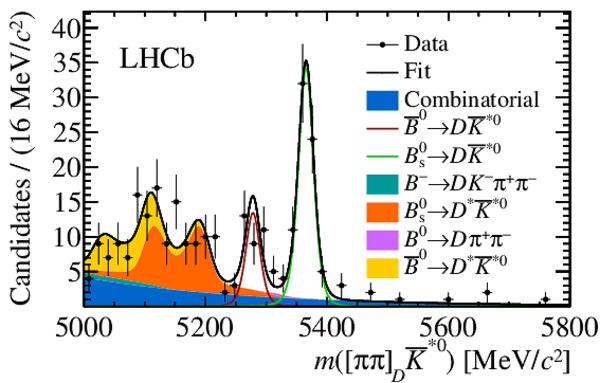
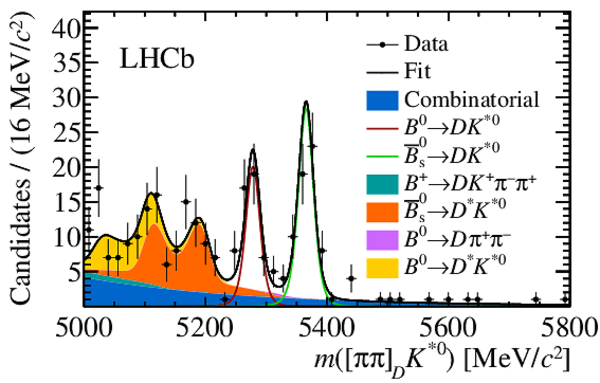
Invariant-mass distributions (data points with error bars) and results of the fit (lines and coloured areas) for the two-body GLW modes (top left) $\overline{ B } {}^0 \rightarrow D( K ^+ K ^- )\overline{ K } {}^{*0} $, (top right) $ B ^0 \rightarrow D( K ^+ K ^- ) K ^{*0} $, (bottom left) $\overline{ B } {}^0 \rightarrow D(\pi ^+ \pi ^- )\overline{ K } {}^{*0} $ and (bottom right) $ B ^0 \rightarrow D(\pi ^+ \pi ^- ) K ^{*0} $. |
Fig2a.pdf [49 KiB] HiDef png [297 KiB] Thumbnail [245 KiB] *.C file |

|
|
Fig2b.pdf [49 KiB] HiDef png [305 KiB] Thumbnail [249 KiB] *.C file |
|
|
|
Fig2c.pdf [50 KiB] HiDef png [311 KiB] Thumbnail [256 KiB] *.C file |
|
|
|
Fig2d.pdf [50 KiB] HiDef png [316 KiB] Thumbnail [259 KiB] *.C file |
|
|
|
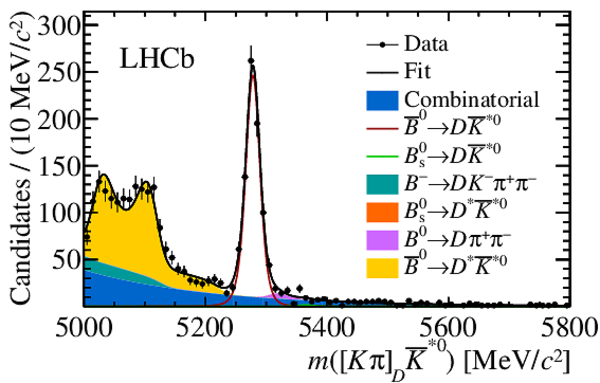
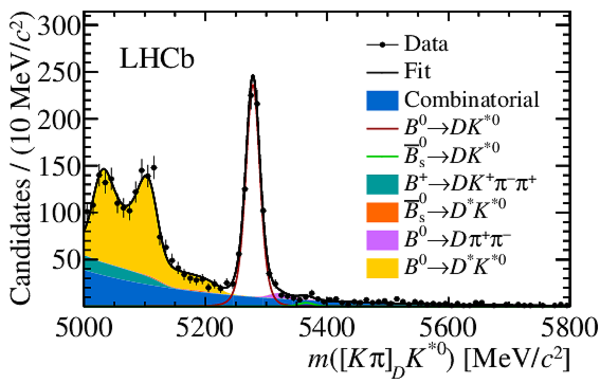
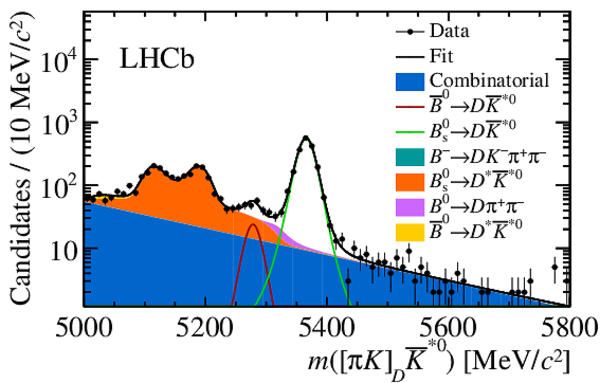
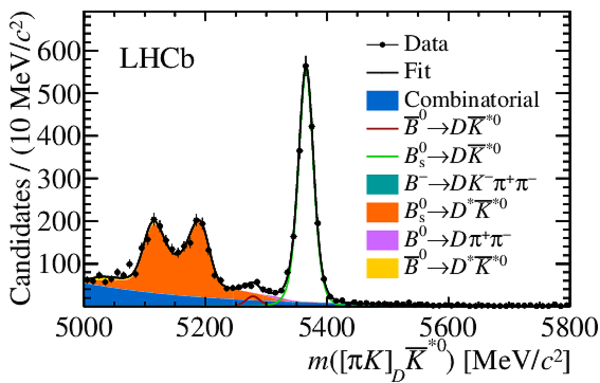
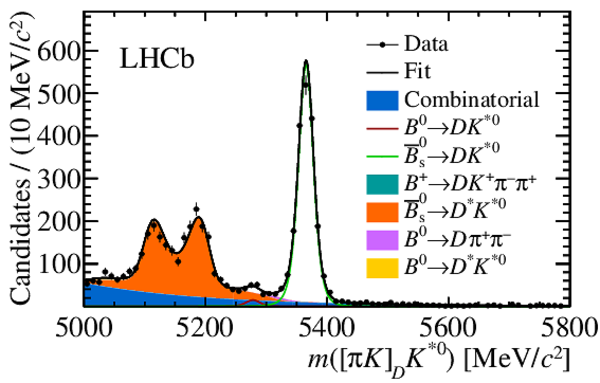
Invariant-mass distributions (data points with error bars) and results of the fit (lines and coloured areas) for the two-body ADS modes (top left) $\overline{ B } {}^0 \rightarrow D( K ^- \pi ^+ )\overline{ K } {}^{*0} $, (top right) $ B ^0 \rightarrow D( K ^+ \pi ^- ) K ^{*0} $, (bottom left) $\overline{ B } {}^0 \rightarrow D(\pi ^- K ^+ )\overline{ K } {}^{*0} $ and (bottom right) $ B ^0 \rightarrow D(\pi ^+ K ^- ) K ^{*0} $. The bottom distributions are shown on a logarithmic scale. |
Fig3a.pdf [60 KiB] HiDef png [281 KiB] Thumbnail [241 KiB] *.C file |
|
|
Fig3b.pdf [61 KiB] HiDef png [282 KiB] Thumbnail [240 KiB] *.C file |
|
|
|
Fig3c.pdf [58 KiB] HiDef png [289 KiB] Thumbnail [242 KiB] *.C file |
|
|
|
Fig3d.pdf [58 KiB] HiDef png [286 KiB] Thumbnail [240 KiB] *.C file |

|
|
|
Invariant-mass distributions (data points with error bars) and results of the fit (lines and coloured areas) for the four-body GLW mode (left) $\overline{ B } {}^0 \rightarrow D(\pi ^+ \pi ^- \pi ^+ \pi ^- )\overline{ K } {}^{*0} $, (right) $ B ^0 \rightarrow D(\pi ^+ \pi ^- \pi ^+ \pi ^- ) K ^{*0} $. |
Fig4a.pdf [46 KiB] HiDef png [316 KiB] Thumbnail [265 KiB] *.C file |
|
|
Fig4b.pdf [46 KiB] HiDef png [326 KiB] Thumbnail [269 KiB] *.C file |
|
|
|
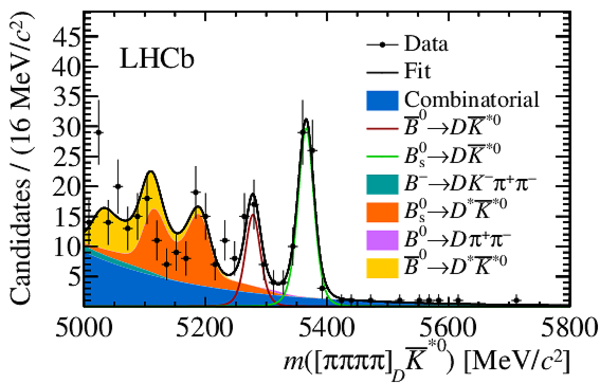
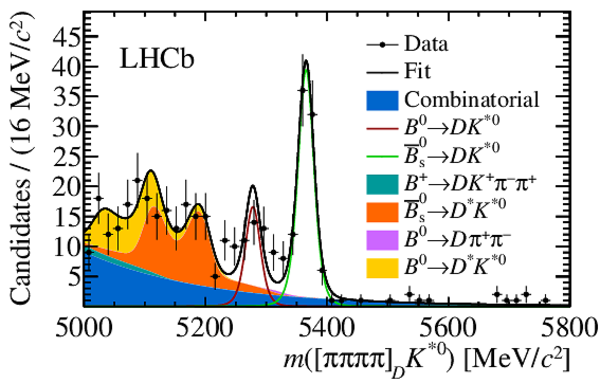
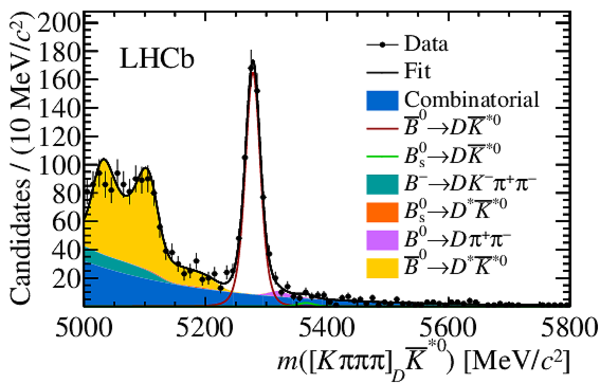
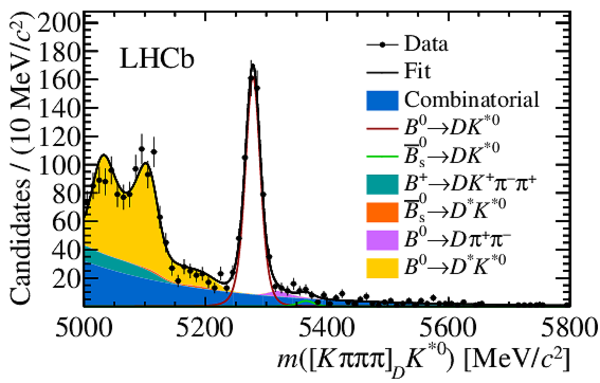
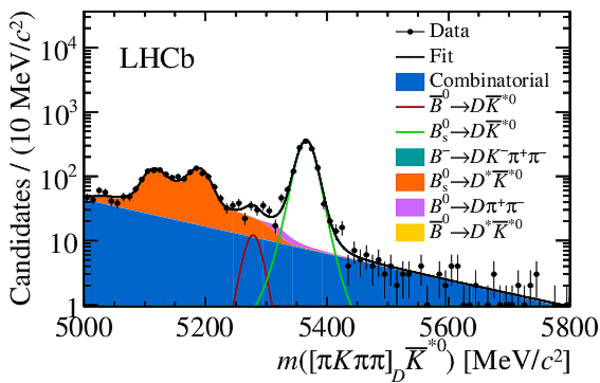
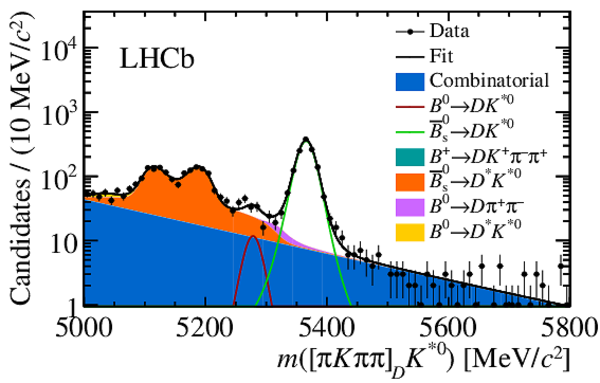
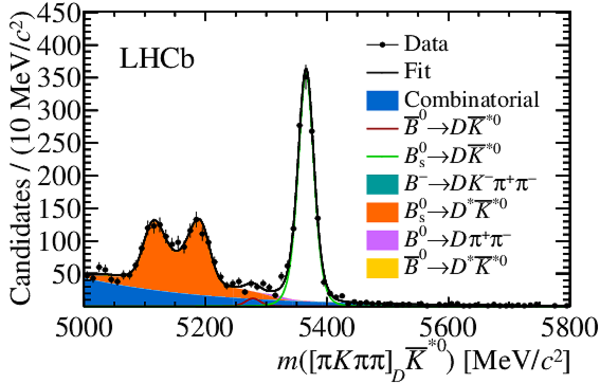
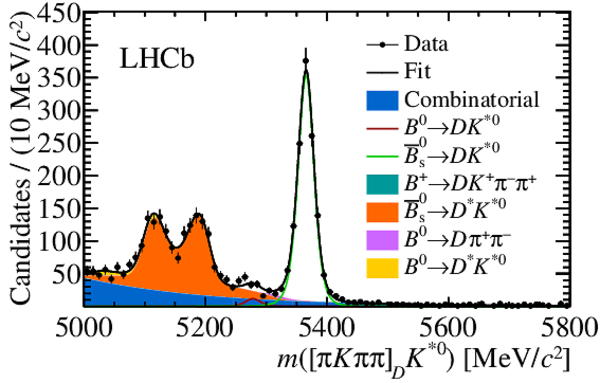
Invariant-mass distributions (data points with error bars) and results of the fit (lines and coloured areas) for the four-body ADS modes (top left) $\overline{ B } {}^0 \rightarrow D( K ^- \pi ^+ \pi ^- \pi ^+ )\overline{ K } {}^{*0} $, (top right) $ B ^0 \rightarrow D( K ^+ \pi ^- \pi ^+ \pi ^- ) K ^{*0} $, (bottom left) $\overline{ B } {}^0 \rightarrow D(\pi ^- K ^+ \pi ^+ \pi ^- )\overline{ K } {}^{*0} $ and (bottom right) $ B ^0 \rightarrow D(\pi ^+ K ^- \pi ^- \pi ^+ ) K ^{*0} $. The bottom distributions are shown on a logarithmic scale. |
Fig5a.pdf [62 KiB] HiDef png [307 KiB] Thumbnail [262 KiB] *.C file |
|
|
Fig5b.pdf [62 KiB] HiDef png [310 KiB] Thumbnail [263 KiB] *.C file |
|
|
|
Fig5c.pdf [59 KiB] HiDef png [292 KiB] Thumbnail [244 KiB] *.C file |
|
|
|
Fig5d.pdf [59 KiB] HiDef png [294 KiB] Thumbnail [245 KiB] *.C file |
|
|
|
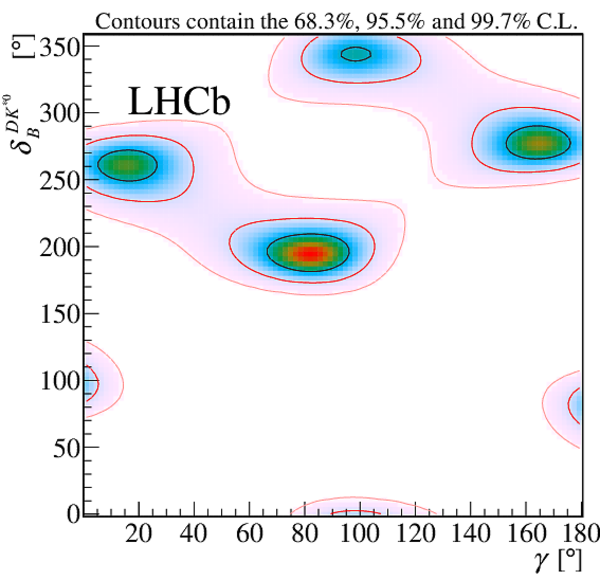
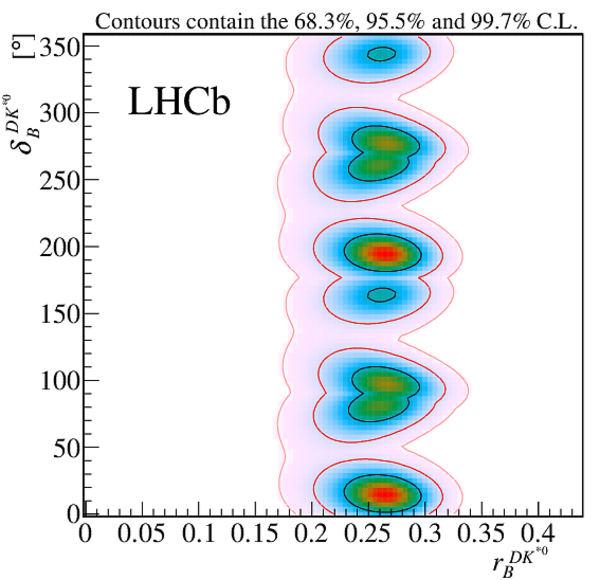
Contour plots showing 2D scans of (left) $\delta_B^{D K ^{*0} }$ versus $\gamma$ and (right) $\delta_B^{D K ^{*0} }$ versus $r_B^{D K ^{*0} }$. The lines represent the $\Delta\chi^2 =$ 2.30, 6.18 and 11.8 contours, corresponding to 68.6%, 95.5% and 99.7% confidence levels (C.L.), respectively. |
Fig6a.pdf [71 KiB] HiDef png [638 KiB] Thumbnail [408 KiB] *.C file |
|
|
Fig6b.pdf [77 KiB] HiDef png [760 KiB] Thumbnail [468 KiB] *.C file |
|
|
|
Animated gif made out of all figures. |
PAPER-2019-021.gif Thumbnail |

|
![HiDef png [34 KiB]](Directory_LHCb-PAPER-2019-021/hidef_Fig1.png)
![HiDef png [297 KiB]](Directory_LHCb-PAPER-2019-021/hidef_Fig2a.png)
![HiDef png [305 KiB]](Directory_LHCb-PAPER-2019-021/hidef_Fig2b.png)
![HiDef png [311 KiB]](Directory_LHCb-PAPER-2019-021/hidef_Fig2c.png)
![HiDef png [316 KiB]](Directory_LHCb-PAPER-2019-021/hidef_Fig2d.png)
![HiDef png [281 KiB]](Directory_LHCb-PAPER-2019-021/hidef_Fig3a.png)
![HiDef png [282 KiB]](Directory_LHCb-PAPER-2019-021/hidef_Fig3b.png)
![HiDef png [289 KiB]](Directory_LHCb-PAPER-2019-021/hidef_Fig3c.png)
![HiDef png [286 KiB]](Directory_LHCb-PAPER-2019-021/hidef_Fig3d.png)
![HiDef png [316 KiB]](Directory_LHCb-PAPER-2019-021/hidef_Fig4a.png)
![HiDef png [326 KiB]](Directory_LHCb-PAPER-2019-021/hidef_Fig4b.png)
![HiDef png [307 KiB]](Directory_LHCb-PAPER-2019-021/hidef_Fig5a.png)
![HiDef png [310 KiB]](Directory_LHCb-PAPER-2019-021/hidef_Fig5b.png)
![HiDef png [292 KiB]](Directory_LHCb-PAPER-2019-021/hidef_Fig5c.png)
![HiDef png [294 KiB]](Directory_LHCb-PAPER-2019-021/hidef_Fig5d.png)
![HiDef png [638 KiB]](Directory_LHCb-PAPER-2019-021/hidef_Fig6a.png)
![HiDef png [760 KiB]](Directory_LHCb-PAPER-2019-021/hidef_Fig6b.png)
Tables and captions
|
Summary of signal yields. The uncertainties are statistical. |
Table_1.pdf [60 KiB] HiDef png [108 KiB] Thumbnail [53 KiB] tex code |

|
|
Systematic uncertainties for the observables. Uncertainties are shown if they are larger than 1% of the statistical uncertainty. The total systematic uncertainty is calculated by summing all sources in quadrature. Statistical uncertainties are given for reference. |
Table_2.pdf [73 KiB] HiDef png [86 KiB] Thumbnail [30 KiB] tex code |

|
|
Measured observables split by LHC running period. Observables relating to $ B ^0 \rightarrow D(\pi ^+ \pi ^- \pi ^+ \pi ^- ) K ^{*0} $ decays are not presented for Run 1, as this decay channel was not selected in the Run 1 data. |
Table_3.pdf [67 KiB] HiDef png [227 KiB] Thumbnail [117 KiB] tex code |

|
|
Combined statistical and systematic correlation matrix for the principal observables. |
Table_4.pdf [63 KiB] HiDef png [134 KiB] Thumbnail [58 KiB] tex code |

|
|
Combined statistical and systematic correlation matrix for the principal observables in Run 1 data only. |
Table_5.pdf [63 KiB] HiDef png [92 KiB] Thumbnail [46 KiB] tex code |

|
|
Combined statistical and systematic correlation matrix for the principal observables in Run 2 data only. |
Table_6.pdf [64 KiB] HiDef png [118 KiB] Thumbnail [55 KiB] tex code |

|
|
Correlation matrix for the principal observables between Run 1 and Run 2 data. |
Table_7.pdf [63 KiB] HiDef png [112 KiB] Thumbnail [47 KiB] tex code |

|
![HiDef png [108 KiB]](Directory_LHCb-PAPER-2019-021/hidef_Table_1.png)
![HiDef png [86 KiB]](Directory_LHCb-PAPER-2019-021/hidef_Table_2.png)
![HiDef png [227 KiB]](Directory_LHCb-PAPER-2019-021/hidef_Table_3.png)
![HiDef png [134 KiB]](Directory_LHCb-PAPER-2019-021/hidef_Table_4.png)
![HiDef png [92 KiB]](Directory_LHCb-PAPER-2019-021/hidef_Table_5.png)
![HiDef png [118 KiB]](Directory_LHCb-PAPER-2019-021/hidef_Table_6.png)
![HiDef png [112 KiB]](Directory_LHCb-PAPER-2019-021/hidef_Table_7.png)
Supplementary Material [file]
| Supplementary material full pdf |
supple[..].pdf [339 KiB] |
|
| Supplementary material full pdf |
supple[..].pdf [96 KiB] |
|
|
This ZIP file contains supplementary material for the publication LHCb-PAPER-2019-021. The files are: Supplementary.pdf : An overview of the extra figures *.pdf, *.png, *.eps : The figures in various formats |
Fig1-S.pdf [19 KiB] HiDef png [306 KiB] Thumbnail [249 KiB] *C file |
|
|
Fig2a-S.pdf [62 KiB] HiDef png [270 KiB] Thumbnail [237 KiB] *C file |
|
|
|
Fig2b-S.pdf [62 KiB] HiDef png [270 KiB] Thumbnail [237 KiB] *C file |
|
|
|
Fig3a-S.pdf [63 KiB] HiDef png [285 KiB] Thumbnail [253 KiB] *C file |
|
|
|
Fig3b-S.pdf [62 KiB] HiDef png [289 KiB] Thumbnail [256 KiB] *C file |
|
|
|
Fig1-S.pdf [19 KiB] HiDef png [306 KiB] Thumbnail [249 KiB] *C file |
|
![HiDef png [306 KiB]](Directory_LHCb-PAPER-2019-021/supplementary/hidef_Fig1-S.png)
![HiDef png [270 KiB]](Directory_LHCb-PAPER-2019-021/supplementary/hidef_Fig2a-S.png)
![HiDef png [270 KiB]](Directory_LHCb-PAPER-2019-021/supplementary/hidef_Fig2b-S.png)
![HiDef png [285 KiB]](Directory_LHCb-PAPER-2019-021/supplementary/hidef_Fig3a-S.png)
![HiDef png [289 KiB]](Directory_LHCb-PAPER-2019-021/supplementary/hidef_Fig3b-S.png)
Created on 23 April 2024.