Search for the lepton-flavour violating decays $B^+ \to K^+ {\mu}^{\pm} e^{\mp}$
[to restricted-access page]Information
LHCb-PAPER-2019-022
CERN-EP-2019-172
arXiv:1909.01010 [PDF]
(Submitted on 03 Sep 2019)
Phys. Rev. Lett.123 (2019) 241802
Inspire 1752450
Tools
Abstract
A search for the lepton-flavour violating decays $B^+ \to K^+ {\mu}^{\pm} e^{\mp}$ is performed using a sample of proton-proton collision data, collected with the LHCb experiment at centre-of-mass energies of $7$ and $8 {\rm TeV}$ and corresponding to an integrated luminosity of 3$\rm fb^{-1}$. No significant signal is observed, and upper limits on the branching fractions are set as $\mathcal{B}(B^+ \to K^+ {\mu}^- e^+) < 7.0 (9.5) \times 10^{-9}$ and $\mathcal{B}(B^+ \to K^+ {\mu}^+ e^-) < 6.4 (8.8) \times 10^{-9}$ at 90 (95) confidence level. The results improve the current best limits on these decays by more than one order of magnitude.
Figures and captions
|
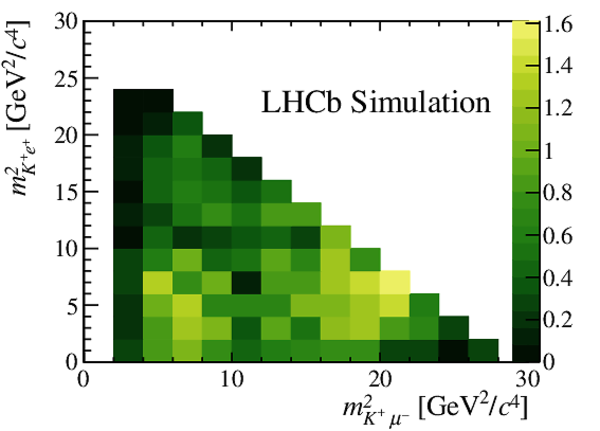
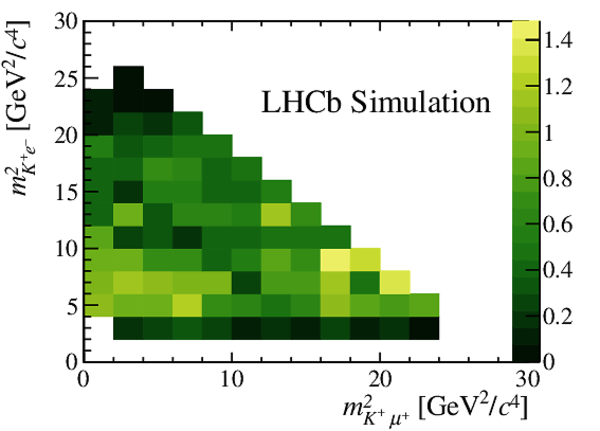
Efficiency of (left) $ B ^+ \rightarrow K ^+ \mu ^- e ^+ $ and (right) $ B ^+ \rightarrow K ^+ \mu ^+ e ^- $ as function of the squared invariant masses $m^2_{K^+e^\pm}$ and $m^2_{K^+\mu^\mp}$. The variation of efficiency across the Dalitz plane is due to applied vetoes. The efficiencies are given in per mille. |
Fig1a.pdf [14 KiB] HiDef png [143 KiB] Thumbnail [131 KiB] |
|
|
Fig1b.pdf [14 KiB] HiDef png [140 KiB] Thumbnail [130 KiB] |
|
|
|
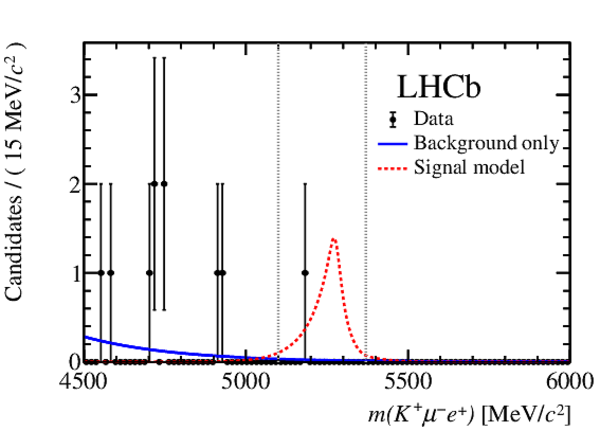
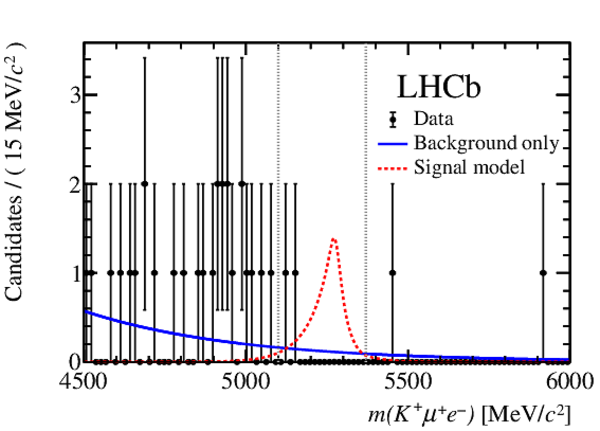
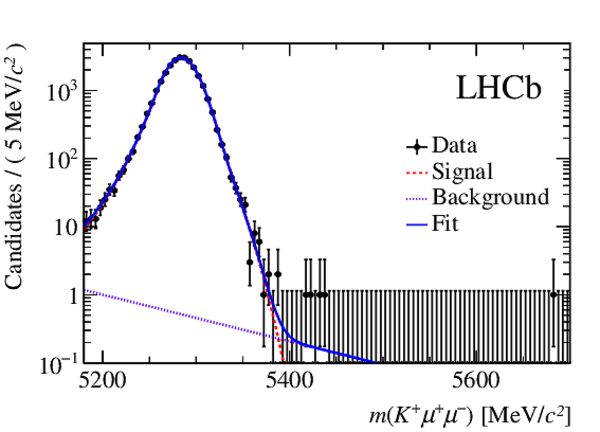
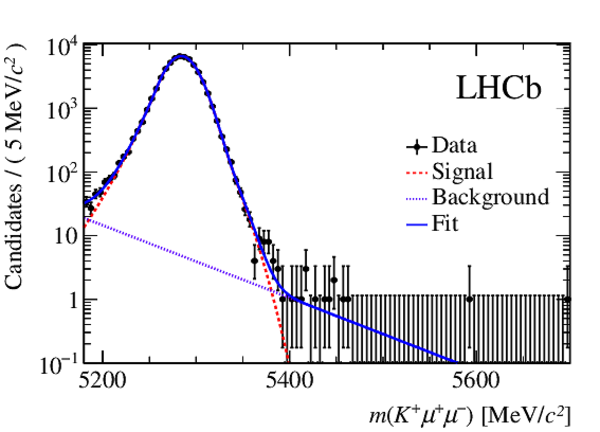
Invariant-mass distributions of the (left) $ B ^+ \rightarrow K ^+ \mu ^- e ^+ $ and (right) $ B ^+ \rightarrow K ^+ \mu ^+ e ^- $ candidates obtained on the combined data sets recorded in 2011 and 2012 with background only fit functions (blue continuous line) and the signal model normalised to 10 candidates (red dashed line) superimposed. The signal window is indicated with grey dotted lines. Difference between the two distributions arises from the effect of the $m(K^+\ell^-)$ requirement. |
Fig2a.pdf [21 KiB] HiDef png [191 KiB] Thumbnail [167 KiB] |
|
|
Fig2b.pdf [22 KiB] HiDef png [215 KiB] Thumbnail [184 KiB] |
|
|
|
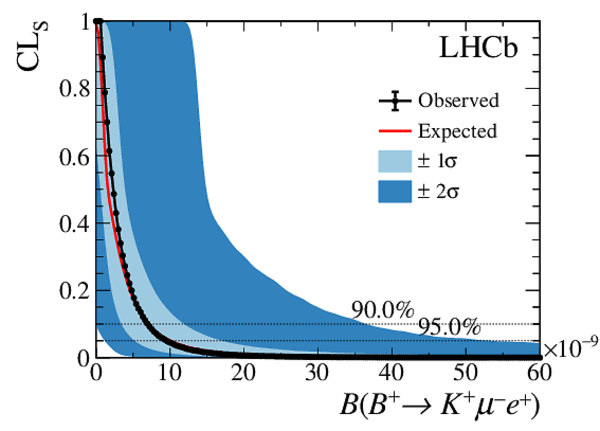
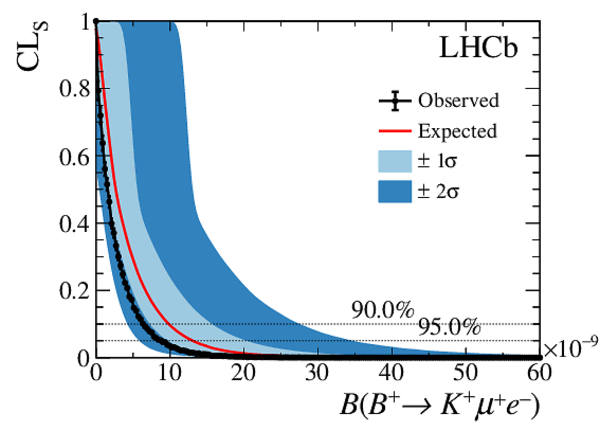
Upper limits on the branching fractions of (left) $ B ^+ \rightarrow K ^+ \mu ^- e ^+ $ and (right) $ B ^+ \rightarrow K ^+ \mu ^+ e ^- $ decays obtained on the combined data sets recorded in 2011 and 2012. The red solid line (black solid line with data points) corresponds to the distribution of the expected (observed) upper limits, and the light blue (dark blue) band contains the $1\sigma$ ($2\sigma$) uncertainties. |
Fig3a.pdf [28 KiB] HiDef png [299 KiB] Thumbnail [201 KiB] |
|
|
Fig3b.pdf [27 KiB] HiDef png [300 KiB] Thumbnail [205 KiB] |
|
|
|
Invariant-mass distributions of the $ B ^+ \rightarrow K ^+ { J \mskip -3mu/\mskip -2mu\psi \mskip 2mu} ( \rightarrow \mu ^+ \mu ^- )$ normalisation channel for (left) 2011 data and (right) 2012 data. |
Fig4a.pdf [22 KiB] HiDef png [208 KiB] Thumbnail [178 KiB] |
|
|
Fig4b.pdf [23 KiB] HiDef png [216 KiB] Thumbnail [186 KiB] |
|
|
|
Animated gif made out of all figures. |
PAPER-2019-022.gif Thumbnail |

|
![HiDef png [143 KiB]](Directory_LHCb-PAPER-2019-022/hidef_Fig1a.png)
![HiDef png [140 KiB]](Directory_LHCb-PAPER-2019-022/hidef_Fig1b.png)
![HiDef png [191 KiB]](Directory_LHCb-PAPER-2019-022/hidef_Fig2a.png)
![HiDef png [215 KiB]](Directory_LHCb-PAPER-2019-022/hidef_Fig2b.png)
![HiDef png [299 KiB]](Directory_LHCb-PAPER-2019-022/hidef_Fig3a.png)
![HiDef png [300 KiB]](Directory_LHCb-PAPER-2019-022/hidef_Fig3b.png)
![HiDef png [208 KiB]](Directory_LHCb-PAPER-2019-022/hidef_Fig4a.png)
![HiDef png [216 KiB]](Directory_LHCb-PAPER-2019-022/hidef_Fig4b.png)
Tables and captions
|
Normalisation factor $\alpha$ for $ B ^+ \rightarrow K ^+ \mu ^- e ^+ $ and $ B ^+ \rightarrow K ^+ \mu ^+ e ^- $ final states. The ratio $\alpha/\mathcal{B}( B ^+ \rightarrow K ^+ { J \mskip -3mu/\mskip -2mu\psi \mskip 2mu} ( \rightarrow \mu ^+ \mu ^- ) )$ is independent of external inputs. |
Table_1.pdf [60 KiB] HiDef png [27 KiB] Thumbnail [13 KiB] tex code |

|
|
Upper limit on the branching fraction of $ B ^+ \rightarrow K ^+ \mu ^- e ^+ $ and $ B ^+ \rightarrow K ^+ \mu ^+ e ^- $ decays obtained on the combined data sets recorded in 2011 and 2012 for confidence levels of $90\%$ and $95\%$. |
Table_2.pdf [58 KiB] HiDef png [29 KiB] Thumbnail [14 KiB] tex code |

|
|
Summary of systematic uncertainties. |
Table_3.pdf [62 KiB] HiDef png [64 KiB] Thumbnail [29 KiB] tex code |

|
![HiDef png [27 KiB]](Directory_LHCb-PAPER-2019-022/hidef_Table_1.png)
![HiDef png [29 KiB]](Directory_LHCb-PAPER-2019-022/hidef_Table_2.png)
![HiDef png [64 KiB]](Directory_LHCb-PAPER-2019-022/hidef_Table_3.png)
Created on 20 April 2024.