Search for $CP$ violation in $\Xi_c^+\rightarrow pK^-\pi^+$ decays using model-independent techniques
[to restricted-access page]Information
LHCb-PAPER-2019-026
CERN-EP-2020-069
arXiv:2006.03145 [PDF]
(Submitted on 04 Jun 2020)
Eur. Phys. J. C80 (2020) 986
Inspire 1799606
Tools
Abstract
A first search for $CP$ violation in the Cabibbo-suppressed $\Xi_c^+\rightarrow pK^-\pi^+$ decay is performed using both a binned and an unbinned model-independent technique in the Dalitz plot. The studies are based on a sample of proton-proton collision data, corresponding to an integrated luminosity of $3.0 {\rm fb^{-1}}$, and collected by the LHCb experiment at centre-of-mass energies of $7$ and $8 \rm TeV$. The data are consistent with the hypothesis of no $CP$ violation.
Figures and captions
|
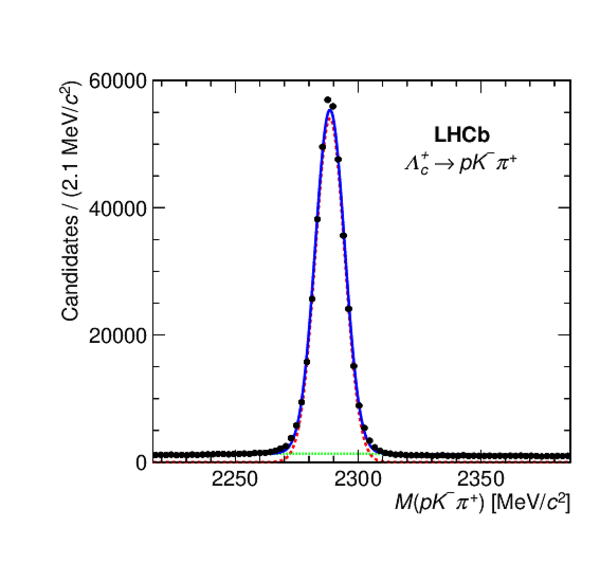
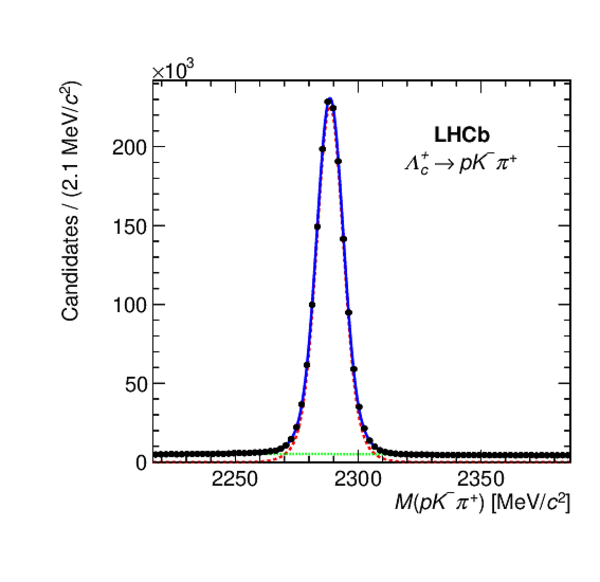
Invariant-mass, $M( p K ^- \pi ^+ )$, distributions of selected $\Lambda ^+_ c $ candidates are shown in the (left) 2011 and (right) 2012 data samples. Data points are in black. The overlaid fitted model (blue continuous line) is a sum of two Gaussian functions with the same mean and different widths (red dashed line) and a second-order Chebyshev polynomial function (green dotted line) describing the signal and background components. |
Fig1a.pdf [30 KiB] HiDef png [183 KiB] Thumbnail [137 KiB] *.C file |
|
|
Fig1b.pdf [30 KiB] HiDef png [182 KiB] Thumbnail [140 KiB] *.C file |
|
|
|
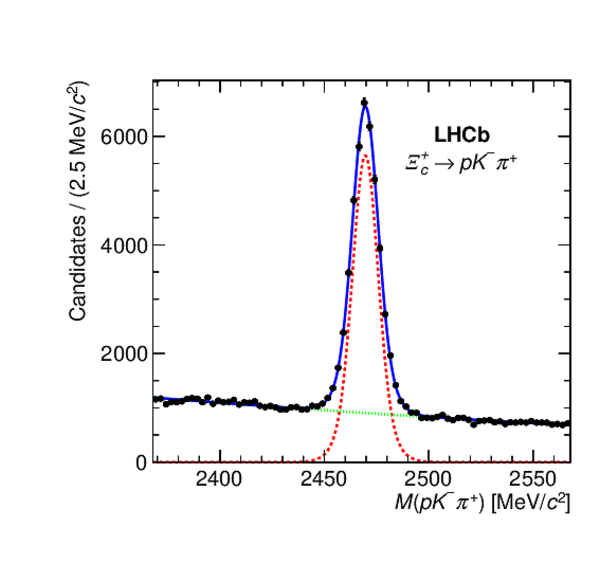
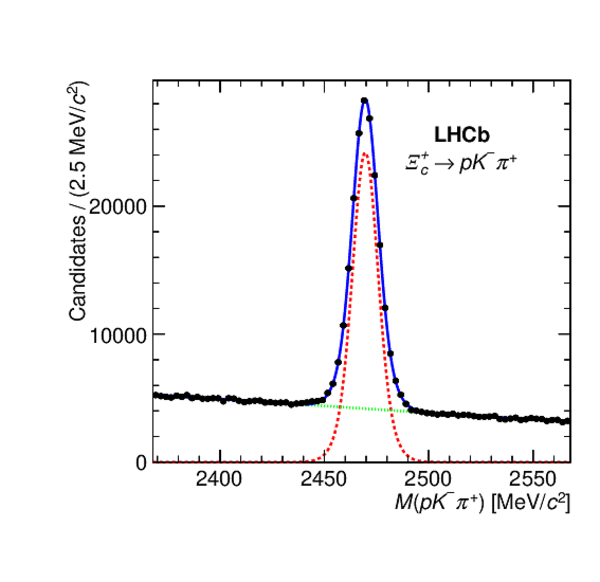
Invariant-mass, $M( p K ^- \pi ^+ )$, distributions of selected $\Xi ^+_ c $ candidates are shown in the (left) 2011 and (right) 2012 data samples. Data points are in black. The overlaid fitted model (blue continuous line) is a sum of two Gaussian functions with the same mean and different widths (red dashed line) and a second-order Chebyshev polynomial function (green dotted line) describing the signal and background components. |
Fig2a.pdf [30 KiB] HiDef png [200 KiB] Thumbnail [151 KiB] *.C file |
|
|
Fig2b.pdf [30 KiB] HiDef png [193 KiB] Thumbnail [147 KiB] *.C file |
|
|
|
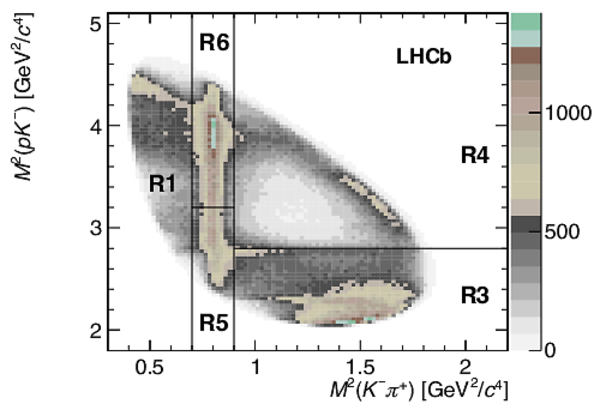
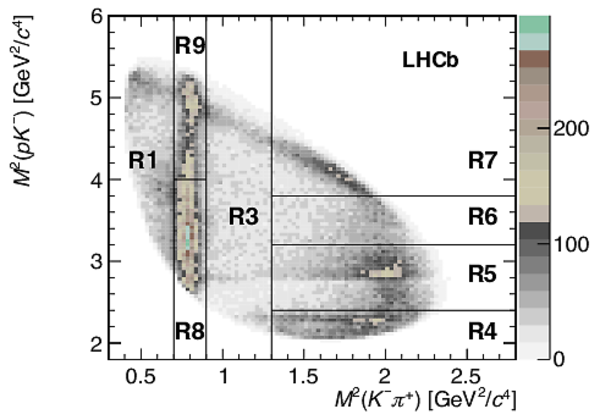
Definition of the Dalitz plot regions for (left) $\Lambda ^+_ c \rightarrow p K ^- \pi ^+ $ and (right) $\Xi ^+_ c \rightarrow p K ^- \pi ^+ $ decays. Additional regions are defined by combining regions. For $\Lambda ^+_ c \rightarrow p K ^- \pi ^+ $ R2=R5$\cup$R6 and for $\Xi ^+_ c \rightarrow p K ^- \pi ^+ $ R2=R8$\cup$R9, R10=R4$\cup$R5 and R11=R4$\cup$R5$\cup$R6$\cup$R7. The presented distributions correspond to the 2012 data sample. |
Fig3a.pdf [54 KiB] HiDef png [390 KiB] Thumbnail [330 KiB] *.C file |
|
|
Fig3b.pdf [56 KiB] HiDef png [382 KiB] Thumbnail [363 KiB] *.C file |
|
|
|
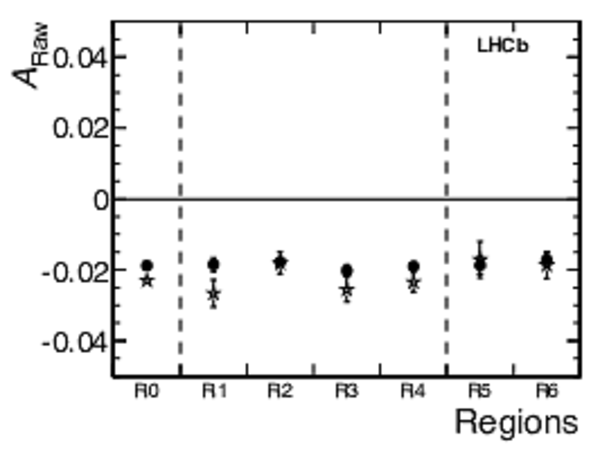
Measured values of $A_{\rm Raw}$ in regions of $\Lambda ^+_ c \rightarrow p K ^- \pi ^+ $ candidate decays for 2011 (stars) and 2012 (dots) data samples. R0 corresponds to full Dalitz plot and R2 is separated into R5 and R6, and these regions are correlated and separated by dashed lines. |
Fig4.pdf [22 KiB] HiDef png [87 KiB] Thumbnail [75 KiB] *.C file |
|
|
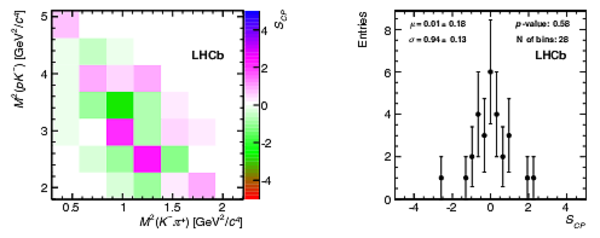
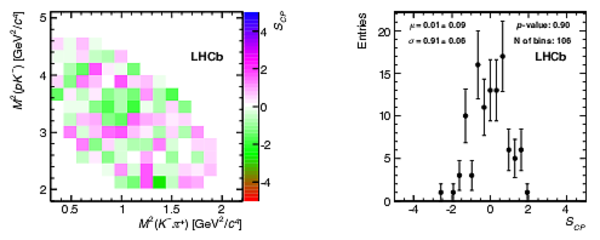
Distributions of $S_ C P ^i$ and corresponding one-dimensional distributions for $\Lambda ^+_ c \rightarrow p K ^- \pi ^+ $ decays for the data collected in the 2012 data sample: (top row) 28 same-size bins and (bottom row) 106 same-size bins of the Dalitz plot. The number of analysed bins, nbins, and the {\it p}-values are given. |
Fig5a.pdf [44 KiB] HiDef png [114 KiB] Thumbnail [107 KiB] *.C file |
|
|
Fig5b.pdf [45 KiB] HiDef png [119 KiB] Thumbnail [128 KiB] *.C file |
|
|
|
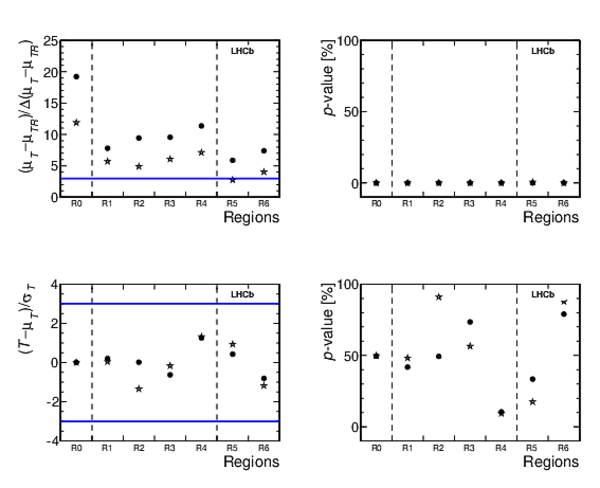
(Top left) pulls, $(\mu_T - \mu_{TR} )/\Delta(\mu_T - \mu_{TR} )$, and (top right) the corresponding {\it p}-values, (bottom left) pull values of the test statistic $T$ and (bottom right) the corresponding {\it p}-values in regions for control $\Lambda ^+_ c \rightarrow p K ^- \pi ^+ $ candidate decays obtained using the kNN method with $n_k=50$ for data collected in 2011 (stars) and 2012 (dots). The horizontal lines in the left figures represent -3 and +3 pull values. R0 corresponds to full Dalitz plot and R2 is separated into R5 and R6, and these regions are correlated and separated by dashed lines. |
Fig6.pdf [17 KiB] HiDef png [163 KiB] Thumbnail [157 KiB] *.C file |
|
|
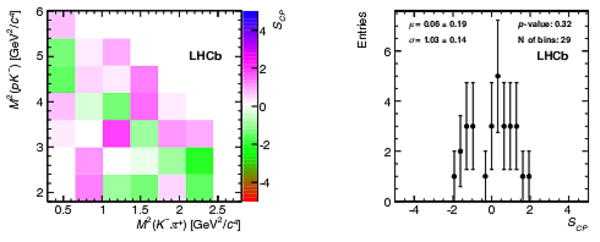
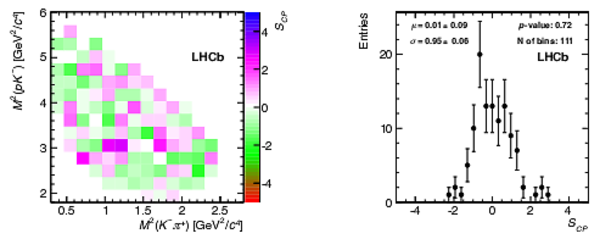
Distributions of $S_ C P ^i$ and corresponding one-dimensional distributions for $\Xi ^+_ c \rightarrow p K ^- \pi ^+ $ decays for the combined data collected 2011 and 2012: (top row) 29 uniform bins and (bottom row) 111 uniform bins of the Dalitz plot. The number of analysed bins and the {\it p}-values are given. |
Fig7a.pdf [44 KiB] HiDef png [114 KiB] Thumbnail [116 KiB] *.C file |
|
|
Fig7b.pdf [46 KiB] HiDef png [120 KiB] Thumbnail [131 KiB] *.C file |
|
|
|
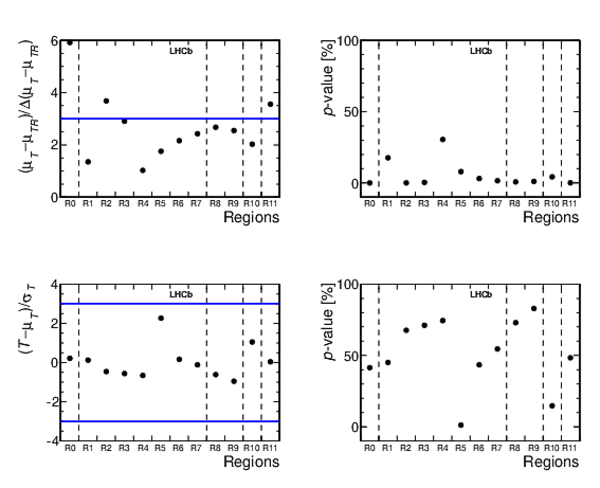
(Top left) pulls, $(\mu_T - \mu_{TR} )/\Delta(\mu_T - \mu_{TR} )$, and (top right) the corresponding {\it p}-values; (bottom left) pull values of the test statistic $T$ and (bottom right) the corresponding {\it p}-values in regions for signal $\Xi ^+_ c \rightarrow p K ^- \pi ^+ $ candidate decays obtained using the kNN method with $n_k=50$ for combined data collected 2011 and 2012. The horizontal lines in the left figures represent $-3$ and $+3$ pull values. R0 corresponds to full Dalitz plot and R2 is separated into R8 and R9, R10 is separated into R4 and R5, R11 is separated into R4, R5, R6 and R7, and these regions are correlated and separated by dashed lines. |
Fig8.pdf [16 KiB] HiDef png [190 KiB] Thumbnail [189 KiB] *.C file |
|
|
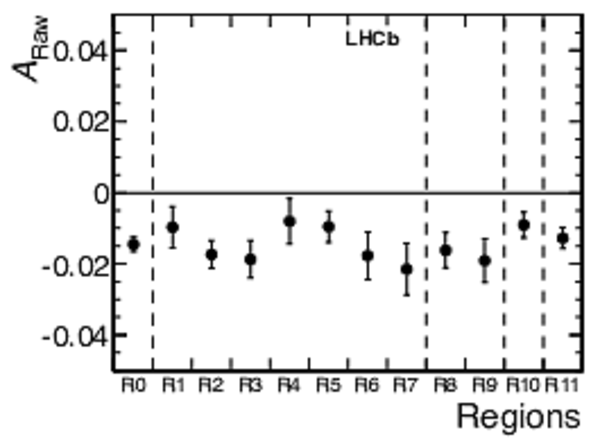
The measured $A_{\rm Raw}$ in regions in signal $\Xi ^+_ c \rightarrow p K ^- \pi ^+ $ candidate decays for the combined data collected in 2011 and 2012. R0 corresponds to full Dalitz plot and R2 is separated into R8 and R9, R10 is separated into R4 and R5, R11 is separated into R4, R5, R6 and R7, and these regions are correlated and separated by dashed lines. |
Fig9.pdf [23 KiB] HiDef png [95 KiB] Thumbnail [96 KiB] *.C file |
|
|
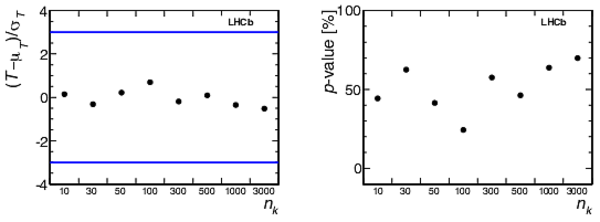
(Left) the pull values of the test statistic $T$ and (right) the corresponding {\it p}-value dependence on the $n_k$ parameter for the whole Dalitz plot (region R0) for $\Xi ^+_ c \rightarrow p K ^- \pi ^+ $ candidate decays obtained using the kNN method for the combined data collected in 2011 and 2012. The horizontal lines in the left figures represent $-3$ and $+3$ pull values. The points are determined with different $n_k$ using same data sample, therefore are correlated. |
Fig10.pdf [31 KiB] HiDef png [70 KiB] Thumbnail [65 KiB] *.C file |
|
|
Animated gif made out of all figures. |
PAPER-2019-026.gif Thumbnail |

|
![HiDef png [183 KiB]](Directory_LHCb-PAPER-2019-026/hidef_Fig1a.png)
![HiDef png [182 KiB]](Directory_LHCb-PAPER-2019-026/hidef_Fig1b.png)
![HiDef png [200 KiB]](Directory_LHCb-PAPER-2019-026/hidef_Fig2a.png)
![HiDef png [193 KiB]](Directory_LHCb-PAPER-2019-026/hidef_Fig2b.png)
![HiDef png [390 KiB]](Directory_LHCb-PAPER-2019-026/hidef_Fig3a.png)
![HiDef png [382 KiB]](Directory_LHCb-PAPER-2019-026/hidef_Fig3b.png)
![HiDef png [87 KiB]](Directory_LHCb-PAPER-2019-026/hidef_Fig4.png)
![HiDef png [114 KiB]](Directory_LHCb-PAPER-2019-026/hidef_Fig5a.png)
![HiDef png [119 KiB]](Directory_LHCb-PAPER-2019-026/hidef_Fig5b.png)
![HiDef png [163 KiB]](Directory_LHCb-PAPER-2019-026/hidef_Fig6.png)
![HiDef png [114 KiB]](Directory_LHCb-PAPER-2019-026/hidef_Fig7a.png)
![HiDef png [120 KiB]](Directory_LHCb-PAPER-2019-026/hidef_Fig7b.png)
![HiDef png [190 KiB]](Directory_LHCb-PAPER-2019-026/hidef_Fig8.png)
![HiDef png [95 KiB]](Directory_LHCb-PAPER-2019-026/hidef_Fig9.png)
![HiDef png [70 KiB]](Directory_LHCb-PAPER-2019-026/hidef_Fig10.png)
Tables and captions
|
Definitions of the Dalitz plot regions for the control mode, $\Lambda ^+_ c \rightarrow p K ^- \pi ^+ $ . |
Table_1.pdf [62 KiB] HiDef png [78 KiB] Thumbnail [38 KiB] tex code |

|
|
Definitions of the Dalitz plot regions for $\Xi ^+_ c \rightarrow p K ^- \pi ^+ $ decays. |
Table_2.pdf [63 KiB] HiDef png [131 KiB] Thumbnail [64 KiB] tex code |

|
![HiDef png [78 KiB]](Directory_LHCb-PAPER-2019-026/hidef_Table_1.png)
![HiDef png [131 KiB]](Directory_LHCb-PAPER-2019-026/hidef_Table_2.png)
Created on 20 April 2024.