Measurement of the branching fraction of the decay $B_s^0\to K_S^0 K_S^0$
[to restricted-access page]Information
LHCb-PAPER-2019-030
CERN-EP-2020-008
arXiv:2002.08229 [PDF]
(Submitted on 19 Feb 2020)
Phys. Rev. D102 (2020) 012011
Inspire 1781408
Tools
Abstract
A measurement of the branching fraction of the decay $B_s^0 \to K_S^0 K_S^0$ is performed using proton-proton collision data corresponding to an integrated luminosity of 5 $fb^{-1}$ collected by the LHCb experiment between 2011 and 2016. The branching fraction is determined to be BR($B_s^0 \to K_S^0 K_S^0$) = [8.3 $\pm$ 1.6 (stat) $\pm$ 0.9 (syst) $\pm$ 0.8 (norm) $\pm$ 0.3 ($f_s/f_d$)] $\times 10^{-6}$ , where the first uncertainty is statistical, the second is systematic, and the third and fourth are due to uncertainties on the branching fraction of the normalization mode $B^0 \to \phi K_S^0$ and the ratio of hadronization fractions $f_s/f_d$. This is the most precise measurement of this branching fraction to date. Furthermore, a measurement of the branching fraction of the decay $B^0 \to K_S^0 K_S^0$ is performed relative to that of the $B_s^0 \to K_S^0 K_S^0$ channel, and is found to be $\frac{BR(B^0 \to K_S^0 K_S^0)}{BR(B_s^0 \to K_S^0 K_S^0)}$ = [7.5 $\pm$ 3.1 (stat) $\pm$ 0.5 (syst) $\pm$ 0.3 ($f_s/f_d$)] $\times 10^{-2}$.
Figures and captions
|
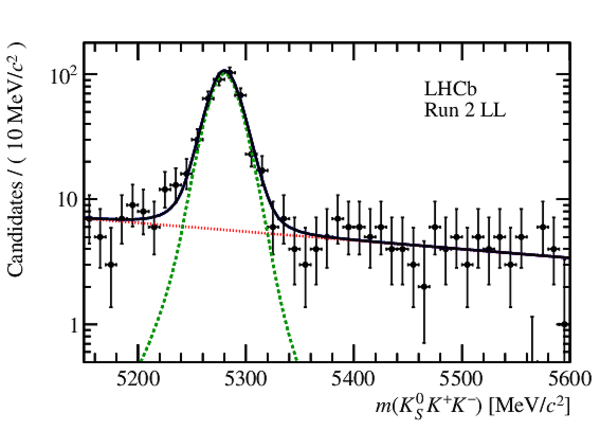
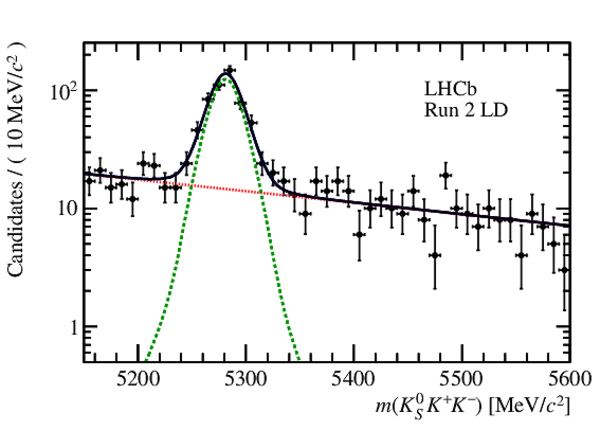
Fits to the invariant-mass distribution $m( K ^0_{\mathrm{S}} K ^+ K ^- )$ of the normalization decay channel. The black curve represents the complete model, the $ B ^0 \rightarrow \phi K ^0_{\mathrm{S}} $ component is given in green (dashed), while the background component in shown in red (dotted). |
B2phiK[..].pdf [19 KiB] HiDef png [223 KiB] Thumbnail [180 KiB] *.C file |
|
|
B2phiK[..].pdf [19 KiB] HiDef png [216 KiB] Thumbnail [178 KiB] *.C file |
|
|
|
Combined invariant-mass distribution $m( K ^0_{\mathrm{S}} K ^0_{\mathrm{S}} )$ of the signal decay channel. The black (solid) curve represents the complete model, the $ B ^0_ s $ signal component is given in green (dashed), the smaller $ B ^0$ signal is given in blue (dash-dotted) and the background component in red (dotted). |
B2KSKS[..].pdf [17 KiB] HiDef png [200 KiB] Thumbnail [162 KiB] *.C file |

|
|
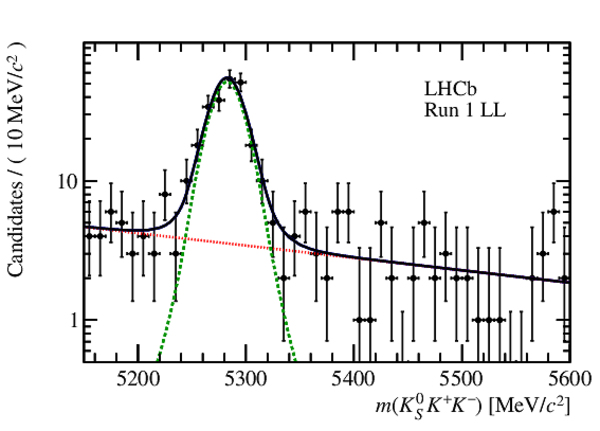
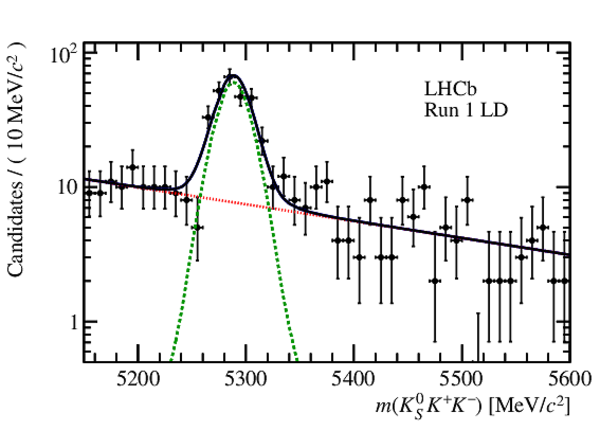
Fits to the invariant-mass distribution $m( K ^0_{\mathrm{S}} K ^+ K ^- )$ of the normalization decay channel. The black curve represents the complete model, the $ B ^0 \rightarrow \phi K ^0_{\mathrm{S}} $ component is given in green (dashed), while the background component in shown in red (dotted). |
B2phiK[..].pdf [18 KiB] HiDef png [223 KiB] Thumbnail [175 KiB] *.C file |
|
|
B2phiK[..].pdf [18 KiB] HiDef png [222 KiB] Thumbnail [179 KiB] *.C file |
|
|
|
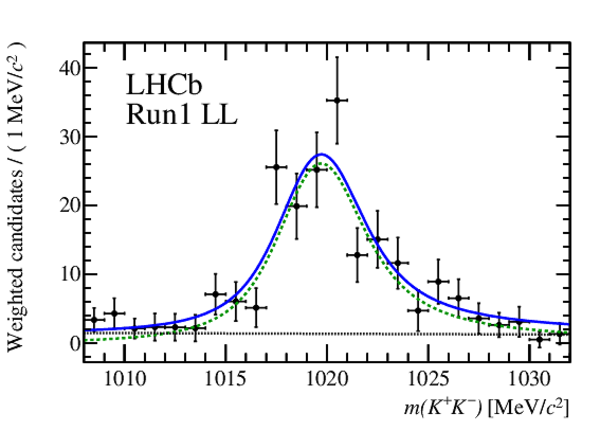
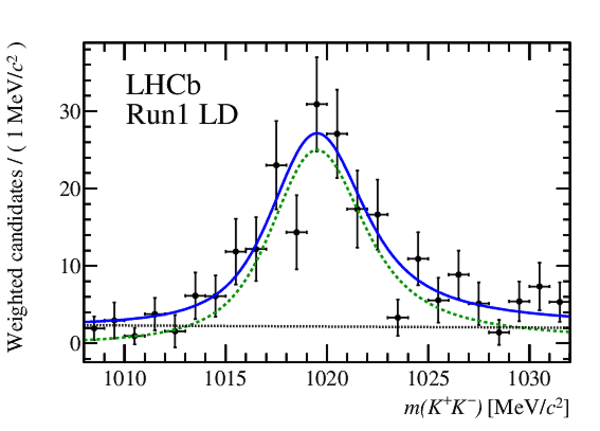
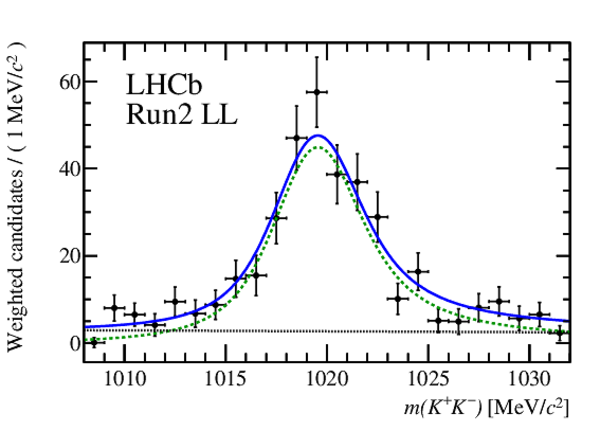
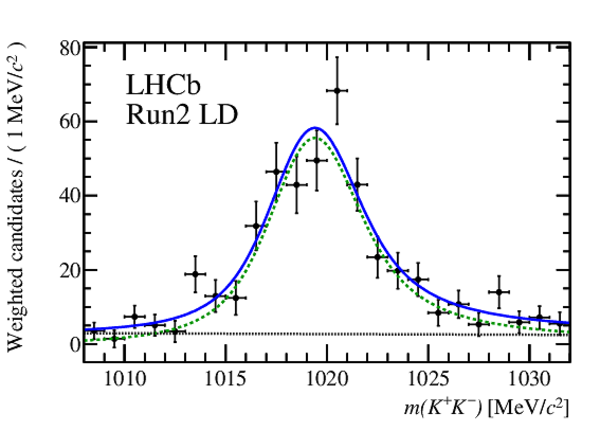
Fits to the invariant-mass distribution $m( K ^+ K ^- )$ of $ B ^0 \rightarrow \phi K ^0_{\mathrm{S}} $ data weighted using the $ {}_s\mathcal{P}\text{lot}$ technique. The blue curve represents the complete model, the signal $\phi $ component is given in green (dashed), and the background $f_0(980) \rightarrow K ^+ K ^- $ model is shown in black (dotted). |
B2phiK[..].pdf [16 KiB] HiDef png [210 KiB] Thumbnail [174 KiB] *.C file |
|
|
B2phiK[..].pdf [16 KiB] HiDef png [214 KiB] Thumbnail [182 KiB] *.C file |
|
|
|
B2phiK[..].pdf [16 KiB] HiDef png [211 KiB] Thumbnail [173 KiB] *.C file |
|
|
|
B2phiK[..].pdf [16 KiB] HiDef png [216 KiB] Thumbnail [176 KiB] *.C file |
|
|
|
Animated gif made out of all figures. |
PAPER-2019-030.gif Thumbnail |

|
![HiDef png [223 KiB]](Directory_LHCb-PAPER-2019-030/hidef_B2phiKS_mass_log_run2ll.png)
![HiDef png [216 KiB]](Directory_LHCb-PAPER-2019-030/hidef_B2phiKS_mass_log_run2ld.png)
![HiDef png [200 KiB]](Directory_LHCb-PAPER-2019-030/hidef_B2KSKS_mass_combined.png)
![HiDef png [223 KiB]](Directory_LHCb-PAPER-2019-030/hidef_B2phiKS_mass_log_run1ll.png)
![HiDef png [222 KiB]](Directory_LHCb-PAPER-2019-030/hidef_B2phiKS_mass_log_run1ld.png)
![HiDef png [210 KiB]](Directory_LHCb-PAPER-2019-030/hidef_B2phiKS_phi_f0_run1ll.png)
![HiDef png [214 KiB]](Directory_LHCb-PAPER-2019-030/hidef_B2phiKS_phi_f0_run1ld.png)
![HiDef png [211 KiB]](Directory_LHCb-PAPER-2019-030/hidef_B2phiKS_phi_f0_run2ll.png)
![HiDef png [216 KiB]](Directory_LHCb-PAPER-2019-030/hidef_B2phiKS_phi_f0_run2ld.png)
Tables and captions
|
Results of the simultaneous fit to the invariant mass of the $ K ^0_{\mathrm{S}} K ^0_{\mathrm{S}} $ system. The fit results for $\mathcal{B}$ and $f_{ B ^0 / B ^0_ s }$ are shared among all data categories. The given uncertainties are statistical only. The normalization constant $\alpha$ and the corresponding normalization channel yields $N_{\text{norm}}$ are shown for reference. |
Table_1.pdf [85 KiB] HiDef png [66 KiB] Thumbnail [30 KiB] tex code |

|
|
All systematic uncertainties on the $ B ^0_ s \rightarrow K ^0_{\mathrm{S}} K ^0_{\mathrm{S}} $ branching fraction, presented as relative measurements. The last row shows the combined systematic uncertainty for each data sample. |
Table_2.pdf [50 KiB] HiDef png [91 KiB] Thumbnail [38 KiB] tex code |

|
![HiDef png [66 KiB]](Directory_LHCb-PAPER-2019-030/hidef_Table_1.png)
![HiDef png [91 KiB]](Directory_LHCb-PAPER-2019-030/hidef_Table_2.png)
Created on 20 April 2024.