Measurement of the $B_c^-$ meson production fraction and asymmetry in 7 and 13 TeV $pp$ collisions
[to restricted-access page]Information
LHCb-PAPER-2019-033
CERN-EP-2019-216
arXiv:1910.13404 [PDF]
(Submitted on 29 Oct 2019)
Phys. Rev. D100 (2019) 112006
Inspire 1762092
Tools
Abstract
The production fraction of the $B_c^-$ meson with respect to the sum of $B^-$ and $\bar{B}^0$ mesons is measured in both 7 and 13 TeV center-of-mass energy $pp$ collisions produced by the Large Hadron Collider (LHC), using the LHCb detector. The rate, approximately 3.7 per mille, does not change with energy, but shows a transverse momentum dependence. The $B_c^- - B_c^+$ production asymmetry is also measured, and is consistent with zero within the determined statistical and systematic uncertainties of a few percent.
Figures and captions
|
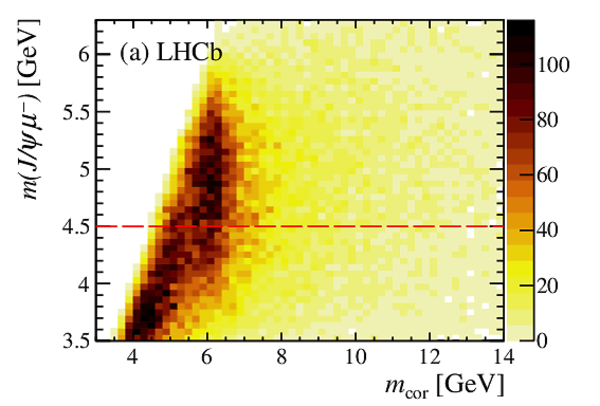
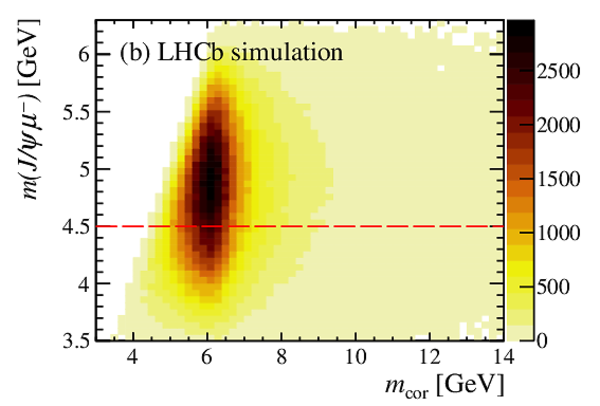
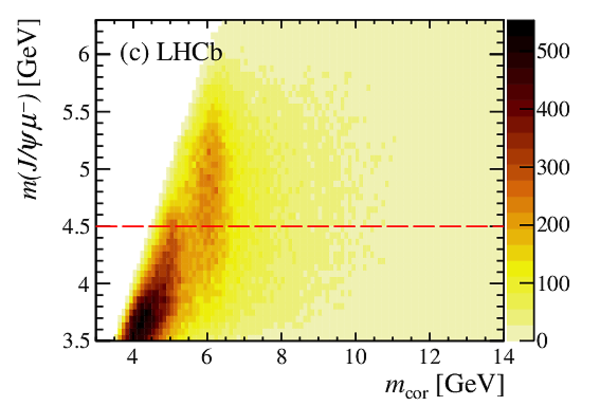
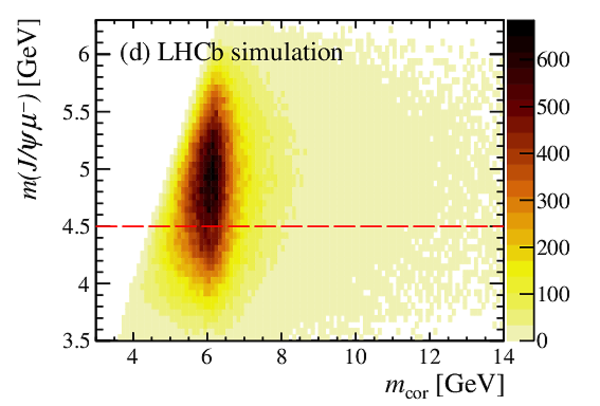
Distributions of corrected mass $ m_{\mathrm{cor}} $ and $m( { J \mskip -3mu/\mskip -2mu\psi \mskip 2mu} \mu^-)$ for (top) $7\text{ Te V} $ and (bottom) $13\text{ Te V} $ data, where (a) and (c) are data and (b) and (d) simulated signal. The (red) dashed line indicates the $m( { J \mskip -3mu/\mskip -2mu\psi \mskip 2mu} \mu^-)>4.5\text{ Ge V} $ requirement. |
mcorr-[..].pdf [25 KiB] HiDef png [353 KiB] Thumbnail [345 KiB] |
|
|
mcorr-[..].pdf [23 KiB] HiDef png [292 KiB] Thumbnail [247 KiB] |
|
|
|
mcorr-[..].pdf [33 KiB] HiDef png [399 KiB] Thumbnail [378 KiB] |
|
|
|
mcorr-[..].pdf [30 KiB] HiDef png [430 KiB] Thumbnail [391 KiB] |
|
|
|
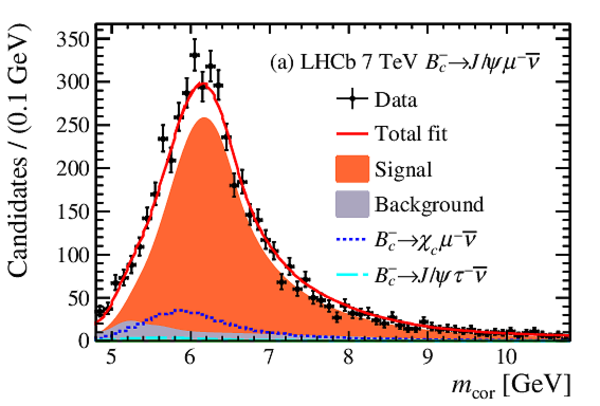
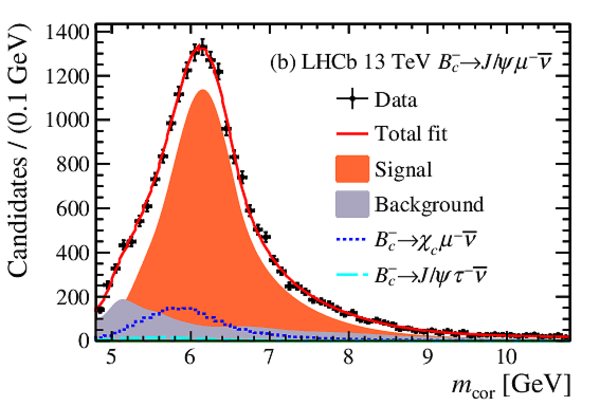
Fitted $ m_{\mathrm{cor}} $ distributions in (a) $7\text{ Te V} $ and (b) $13\text{ Te V} $ samples. The signal and the backgrounds are shown as the dark (orange) and lighter (gray) areas. The dashed (cyan) curves show the $ B _ c ^- \rightarrow { J \mskip -3mu/\mskip -2mu\psi \mskip 2mu} \tau ^- \nu _\tau $ components, while the dotted (blue) curves show the $ B _ c ^- \rightarrow \chi_{c0,1,2}\mu ^- \overline{\nu} $ components. The $ B _ c ^- \rightarrow \psi {(2S)} \mu ^- \overline{\nu} $ contribution is also in the fit but is too small to be seen. The total fit is shown by the solid (red) curve. |
CorrMa[..].pdf [25 KiB] HiDef png [300 KiB] Thumbnail [239 KiB] |
|
|
CorrMa[..].pdf [25 KiB] HiDef png [297 KiB] Thumbnail [232 KiB] |
|
|
|
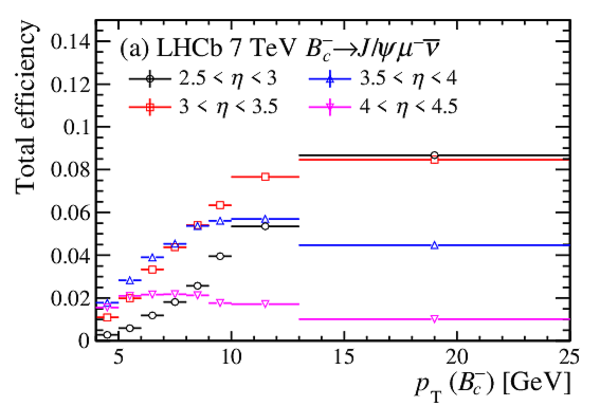
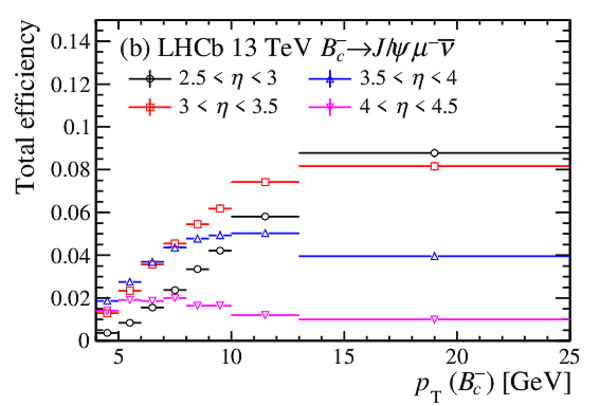
The total efficiency for $ B _ c ^- \rightarrow { J \mskip -3mu/\mskip -2mu\psi \mskip 2mu} \mu ^- \overline{\nu} $, as a function of $ p_{\mathrm{T}} ( B _ c ^- )$ in different intervals of $\eta$ in (a) 7 TeV and (b) 13 TeV samples. |
Effici[..].pdf [15 KiB] HiDef png [159 KiB] Thumbnail [159 KiB] |
|
|
Effici[..].pdf [15 KiB] HiDef png [160 KiB] Thumbnail [160 KiB] |
|
|
|
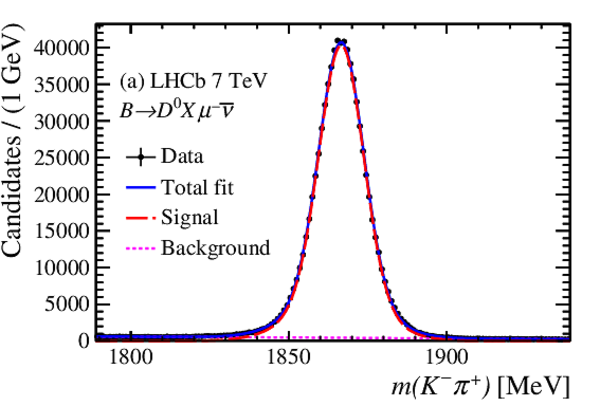
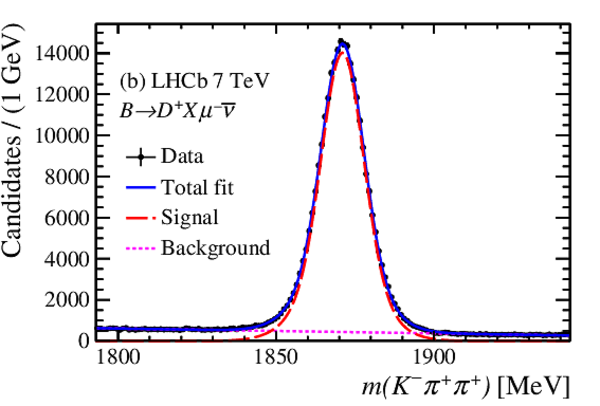
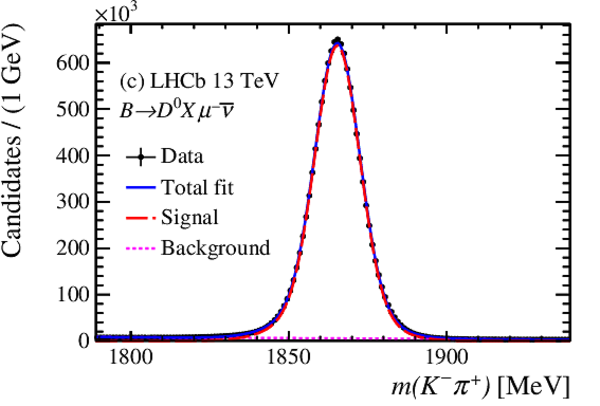
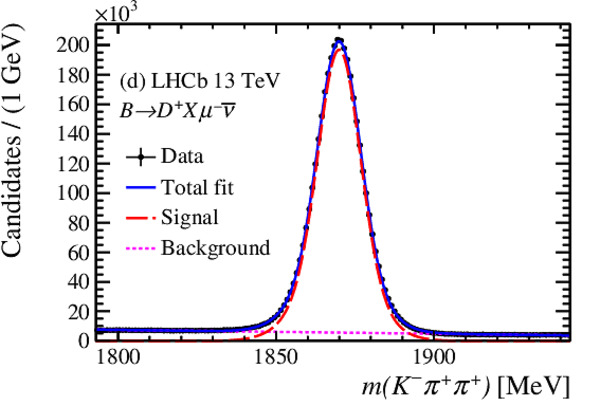
Invariant-mass distributions of (a) $K^-\pi^+$ and (b) $K^-\pi^+\pi^+$ for 7 $\text{ Te V}$ , and (c) and (d) for 13 $\text{ Te V}$ collisions. The data are shown by solid points. The (red) dashed lines represent the signal components. The combinatorial backgrounds are shown as the dotted (magenta) line, and the solid (blue) line shows the total fit. |
b2D0Mu[..].pdf [32 KiB] HiDef png [235 KiB] Thumbnail [199 KiB] |
|
|
b2DpMu[..].pdf [31 KiB] HiDef png [233 KiB] Thumbnail [191 KiB] |
|
|
|
b2D0Mu[..].pdf [31 KiB] HiDef png [214 KiB] Thumbnail [177 KiB] |
|
|
|
b2DpMu[..].pdf [32 KiB] HiDef png [232 KiB] Thumbnail [198 KiB] |
|
|
|
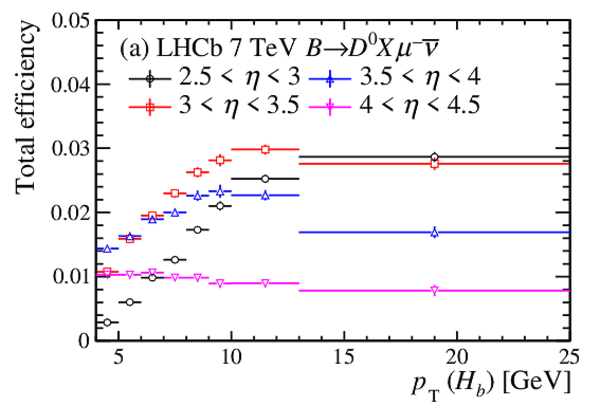
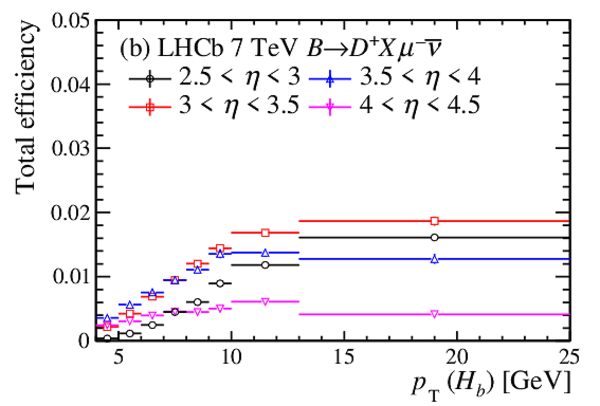
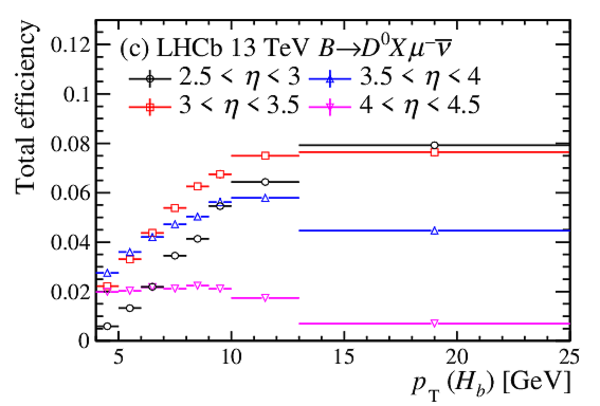
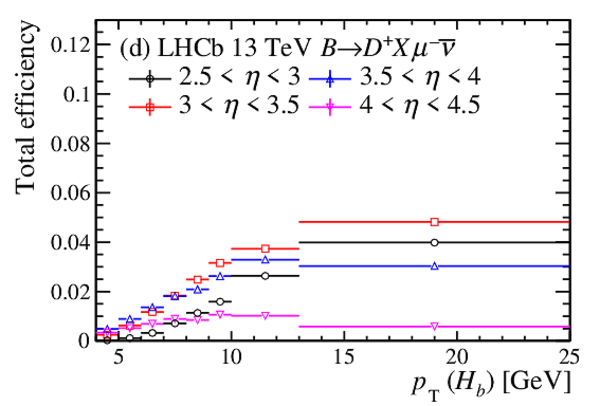
Total efficiencies for the (a) $ D ^0 X \mu^-\overline{\nu}$ and (b) $ D ^+ X \mu^-\overline{\nu}$ signals in 7 $\text{ Te V}$ and (c) and (d) in 13 $\text{ Te V}$ samples as functions of $ p_{\mathrm{T}}$ in $\eta$ intervals. |
Effici[..].pdf [15 KiB] HiDef png [162 KiB] Thumbnail [160 KiB] |
|
|
Effici[..].pdf [15 KiB] HiDef png [158 KiB] Thumbnail [158 KiB] |
|
|
|
Effici[..].pdf [15 KiB] HiDef png [163 KiB] Thumbnail [161 KiB] |
|
|
|
Effici[..].pdf [15 KiB] HiDef png [160 KiB] Thumbnail [160 KiB] |
|
|
|
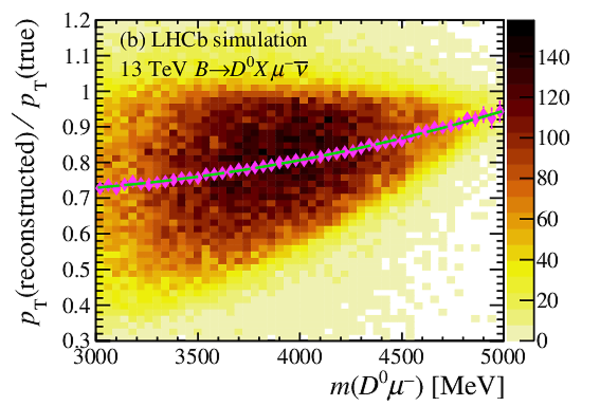
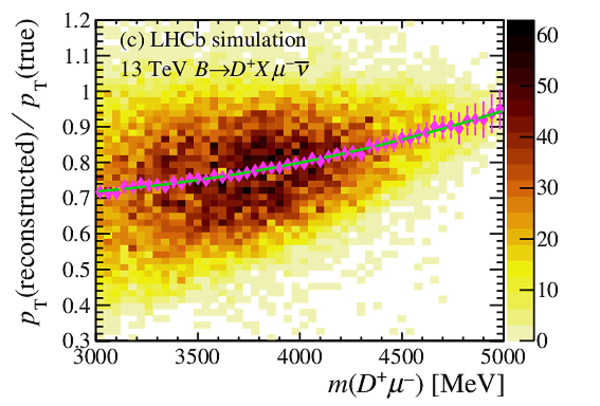
The $k$-factor corrections as a function of invariant mass of (a) $m( { J \mskip -3mu/\mskip -2mu\psi \mskip 2mu} \mu^-)$, (b) $m( D ^0 \mu^-)$, and (c) $m( D ^+ \mu^-)$ for the 13 $\text{ Te V}$ simulation samples. (The 7 $\text{ Te V}$ results are almost identical.) The points (magenta) are the average $k$-factor corrections, and the (green) dashed line shows a second-order polynomial fit to the average data. |
kFacto[..].pdf [26 KiB] HiDef png [484 KiB] Thumbnail [412 KiB] |

|
|
kFacto[..].pdf [28 KiB] HiDef png [563 KiB] Thumbnail [476 KiB] |
|
|
|
kFacto[..].pdf [26 KiB] HiDef png [543 KiB] Thumbnail [455 KiB] |
|
|
|
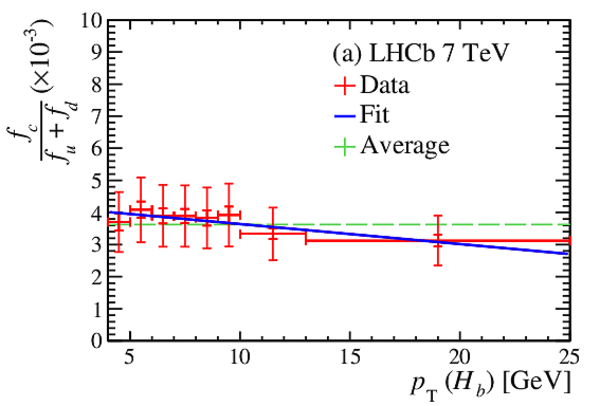
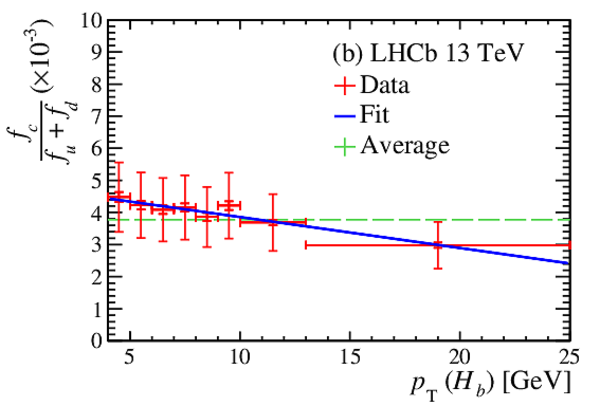
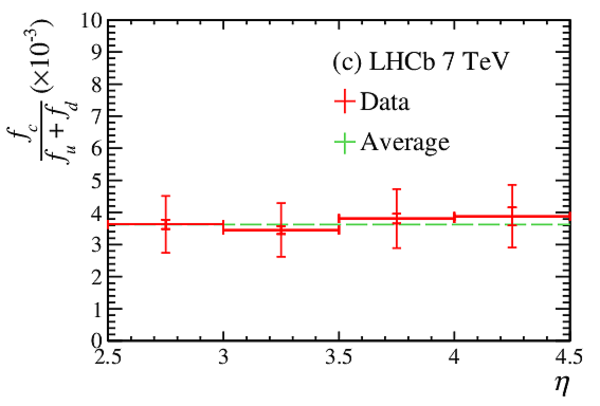
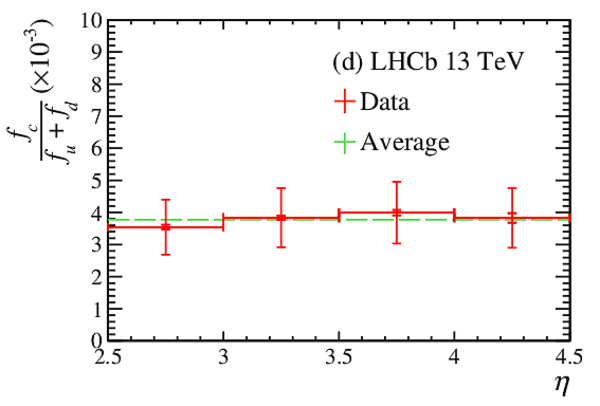
Ratio of production fractions after the $k$-factor correction as a function of (a) $ p_{\mathrm{T}} (H_b)$ and (c) $\eta$ in 7 $\text{ Te V}$ data and (b) and (d) in 13 $\text{ Te V}$ data. The smaller error bars show the statistical uncertainties and the larger ones include the statistical and systematic uncertainties. The horizontal (green) dashed-lines show the average values. |
FINALR[..].pdf [15 KiB] HiDef png [151 KiB] Thumbnail [145 KiB] |
|
|
FINALR[..].pdf [16 KiB] HiDef png [152 KiB] Thumbnail [144 KiB] |
|
|
|
FINALR[..].pdf [14 KiB] HiDef png [107 KiB] Thumbnail [113 KiB] |
|
|
|
FINALR[..].pdf [14 KiB] HiDef png [109 KiB] Thumbnail [114 KiB] |
|
|
|
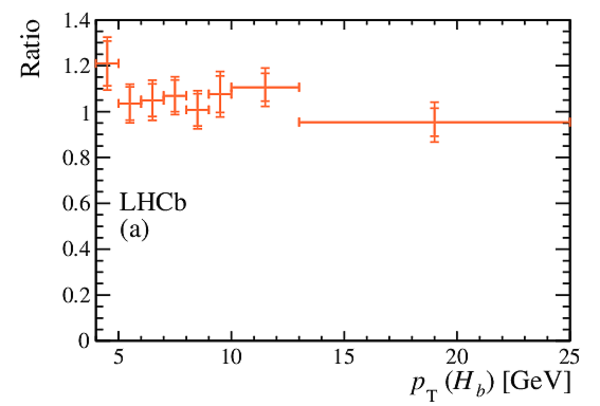
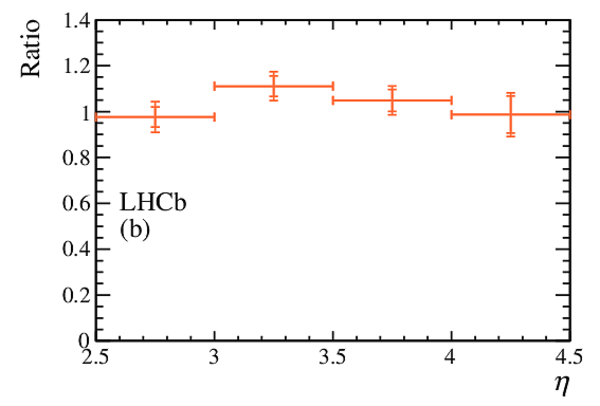
Ratio of the $ B _ c ^- $ production fractions at 13 TeV to 7 TeV as a function of (a) $ p_{\mathrm{T}} (H_b)$ and (b) $\eta$. The smaller error bars show the statistical uncertainties and the larger ones include the statistical and systematic uncertainties added in quadrature. |
FINALR[..].pdf [14 KiB] HiDef png [99 KiB] Thumbnail [96 KiB] |
|
|
FINALR[..].pdf [13 KiB] HiDef png [76 KiB] Thumbnail [77 KiB] |
|
|
|
Animated gif made out of all figures. |
PAPER-2019-033.gif Thumbnail |

|
![HiDef png [353 KiB]](Directory_LHCb-PAPER-2019-033/hidef_mcorr-2011-data.png)
![HiDef png [292 KiB]](Directory_LHCb-PAPER-2019-033/hidef_mcorr-2011-mc.png)
![HiDef png [399 KiB]](Directory_LHCb-PAPER-2019-033/hidef_mcorr-2016-data.png)
![HiDef png [430 KiB]](Directory_LHCb-PAPER-2019-033/hidef_mcorr-2016-mc.png)
![HiDef png [300 KiB]](Directory_LHCb-PAPER-2019-033/hidef_CorrMass_PolScale_Bc2JpsiMuNu_BPT_AllBins_Data_2011.png)
![HiDef png [297 KiB]](Directory_LHCb-PAPER-2019-033/hidef_CorrMass_PolScale_Bc2JpsiMuNu_BPT_AllBins_Data_2016.png)
![HiDef png [159 KiB]](Directory_LHCb-PAPER-2019-033/hidef_Efficiency_Total_Bc2JpsiMuNu_MC2011_BPT.png)
![HiDef png [160 KiB]](Directory_LHCb-PAPER-2019-033/hidef_Efficiency_Total_Bc2JpsiMuNu_MC2016_BPT.png)
![HiDef png [235 KiB]](Directory_LHCb-PAPER-2019-033/hidef_b2D0MuX2011.png)
![HiDef png [233 KiB]](Directory_LHCb-PAPER-2019-033/hidef_b2DpMuX2011.png)
![HiDef png [214 KiB]](Directory_LHCb-PAPER-2019-033/hidef_b2D0MuX2016.png)
![HiDef png [232 KiB]](Directory_LHCb-PAPER-2019-033/hidef_b2DpMuX2016.png)
![HiDef png [162 KiB]](Directory_LHCb-PAPER-2019-033/hidef_Efficiency_Total_b2D0MuX_MC2011_BPT.png)
![HiDef png [158 KiB]](Directory_LHCb-PAPER-2019-033/hidef_Efficiency_Total_b2DpMuX_MC2011_BPT.png)
![HiDef png [163 KiB]](Directory_LHCb-PAPER-2019-033/hidef_Efficiency_Total_b2D0MuX_MC2016_BPT.png)
![HiDef png [160 KiB]](Directory_LHCb-PAPER-2019-033/hidef_Efficiency_Total_b2DpMuX_MC2016_BPT.png)
![HiDef png [484 KiB]](Directory_LHCb-PAPER-2019-033/hidef_kFactor_Bc2JpsiMu_MC2016.png)
![HiDef png [563 KiB]](Directory_LHCb-PAPER-2019-033/hidef_kFactor_b2D0XMu_MC2016.png)
![HiDef png [543 KiB]](Directory_LHCb-PAPER-2019-033/hidef_kFactor_b2DpXMu_MC2016.png)
![HiDef png [151 KiB]](Directory_LHCb-PAPER-2019-033/hidef_FINALRESULTS_BcFraction_1D_PT_Data2011_BPT.png)
![HiDef png [152 KiB]](Directory_LHCb-PAPER-2019-033/hidef_FINALRESULTS_BcFraction_1D_PT_Data2016_BPT.png)
![HiDef png [107 KiB]](Directory_LHCb-PAPER-2019-033/hidef_FINALRESULTS_BcFraction_1D_ETA_Data2011_BPT.png)
![HiDef png [109 KiB]](Directory_LHCb-PAPER-2019-033/hidef_FINALRESULTS_BcFraction_1D_ETA_Data2016_BPT.png)
![HiDef png [99 KiB]](Directory_LHCb-PAPER-2019-033/hidef_FINALRESULTS_BcFraction_1D_PT_Ratio_2011And2016_BPT.png)
![HiDef png [76 KiB]](Directory_LHCb-PAPER-2019-033/hidef_FINALRESULTS_BcFraction_1D_ETA_Ratio_2011And2016_BPT.png)
Tables and captions
|
Charm and charmonium branching fractions for the decay modes used in this analysis. |
Table_1.pdf [70 KiB] HiDef png [53 KiB] Thumbnail [26 KiB] tex code |

|
|
Branching fractions predictions (%). The $ B _ c ^- $ lifetime is taken as 0.507 ps \cite{PDG2018}. The value for the semileptonic decays of the $ B _ c ^-$ meson, ${\cal{B}}^c_{\rm sl}$, is derived by summing the $ { J \mskip -3mu/\mskip -2mu\psi \mskip 2mu} \mu^-\overline{\nu}$ and $\eta_c\mu^-\overline{\nu}$ individual predictions with the average predictions of 0.1% for $\psi(2S)\mu^-\overline{\nu}$, the sum of $\chi_{c0,1,2}\mu^-\overline{\nu}$ as 0.6%, and 0.3% for $h_c\mu^-\nu$. In the one case where $\eta_c\mu^-\overline{\nu}$ was not predicted averages from other measurements are used. |
Table_2.pdf [75 KiB] HiDef png [82 KiB] Thumbnail [41 KiB] tex code |

|
|
Yields of $B\rightarrow DX\mu^-\overline{\nu}$ decays. |
Table_3.pdf [52 KiB] HiDef png [42 KiB] Thumbnail [19 KiB] tex code |

|
|
Results of the fits to Eq. 5 |
Table_4.pdf [57 KiB] HiDef png [34 KiB] Thumbnail [18 KiB] tex code |

|
|
The $ B _ c ^- - B _ c ^+ $ production asymmetry ($\times10^{-2}$) as a function of $ p_{\mathrm{T}} (H_b)$ and $\eta$ at 7 TeV and 13 TeV. |
Table_5.pdf [52 KiB] HiDef png [119 KiB] Thumbnail [63 KiB] tex code |

|
|
Summary of the relative systematic uncertainties for $f_c/(f_u+f_d)$(%) and the absolute production asymmetries $a_{\rm prod}$(%). For local uncertainties, the ranges correspond to the minimum and maximum uncertainties evaluated in the $ p_{\mathrm{T}} (H_b)$ and $\eta$ ranges. |
Table_6.pdf [87 KiB] HiDef png [173 KiB] Thumbnail [75 KiB] tex code |

|
![HiDef png [53 KiB]](Directory_LHCb-PAPER-2019-033/hidef_Table_1.png)
![HiDef png [82 KiB]](Directory_LHCb-PAPER-2019-033/hidef_Table_2.png)
![HiDef png [42 KiB]](Directory_LHCb-PAPER-2019-033/hidef_Table_3.png)
![HiDef png [34 KiB]](Directory_LHCb-PAPER-2019-033/hidef_Table_4.png)
![HiDef png [119 KiB]](Directory_LHCb-PAPER-2019-033/hidef_Table_5.png)
![HiDef png [173 KiB]](Directory_LHCb-PAPER-2019-033/hidef_Table_6.png)
Created on 20 April 2024.