Measurement of $\mathit{\Xi}_{cc}^{++}$ production in $pp$ collisions at $\sqrt{s}=13$ TeV
[to restricted-access page]Information
LHCb-PAPER-2019-035
CERN-EP-2019-220
arXiv:1910.11316 [PDF]
(Submitted on 24 Oct 2019)
Chin. Phys. C44 (2020) 022001
Inspire 1760788
Tools
Abstract
The production of $\mathit{\Xi}_{cc}^{++}$ baryons in proton-proton collisions at a centre-of-mass energy of $\sqrt{s}=13$ TeV is measured in the transverse-momentum range $4<p_\mathrm{T}<15 \mathrm{GeV}$/$c$ and the rapidity range $2.0<y<4.5$. The data used in this measurement correspond to an integrated luminosity of 1.7 $\mathrm{fb}^{-1}$, recorded by the LHCb experiment during 2016. The ratio of the $\mathit{\Xi}_{cc}^{++}$ production cross-section times the branching fraction of the $\mathit{\Xi_{cc}^{++} \to \Lambda_{c}^{+} K^- \pi^+ \pi^+}$ decay relative to the prompt $\mathit{\Lambda_c^{+}}$ production cross-section is found to be $(2.22\pm 0.27 \pm 0.29)\times 10^{-4}$, assuming the central value of the measured $\mathit{\Xi_{cc}^{++}}$ lifetime, where the first uncertainty is statistical and the second systematic.
Figures and captions
|
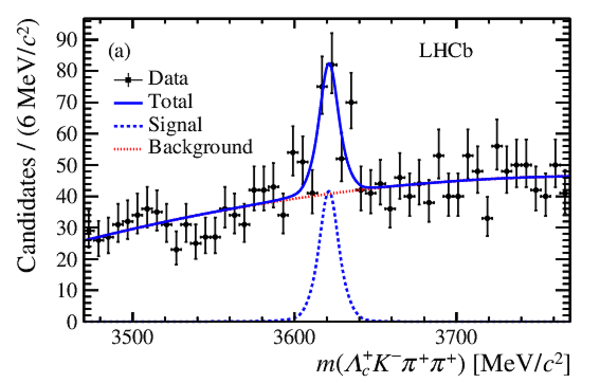
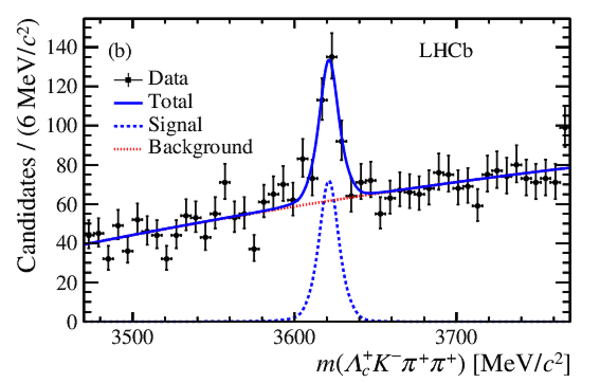
Invariant-mass distributions of $\Xi ^{++}_{ c c } $ candidates (a) triggered by TOS and (b) triggered by exTIS, with fit results shown. |
TOSMassFit.pdf [20 KiB] HiDef png [240 KiB] Thumbnail [219 KiB] |
|
|
TISMassFit.pdf [20 KiB] HiDef png [232 KiB] Thumbnail [207 KiB] |
|
|
|
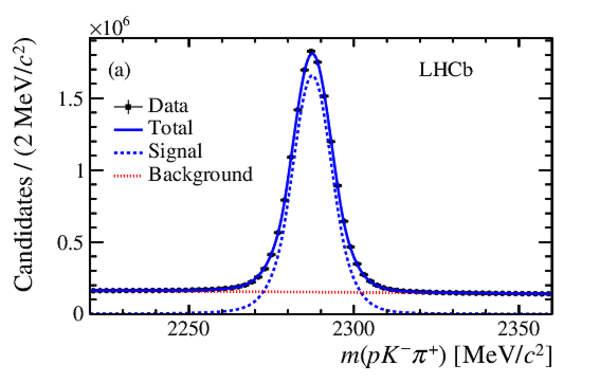
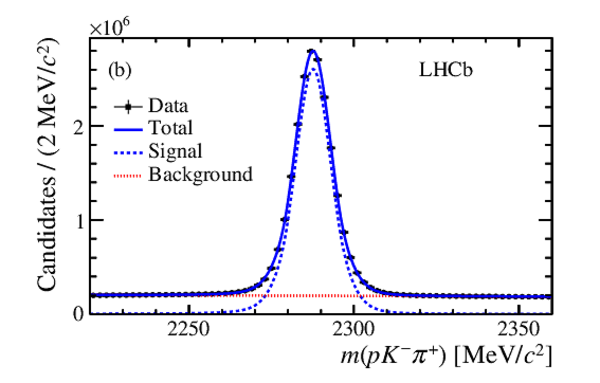
Invariant-mass distributions of $\Lambda ^+_ c $ candidates (a) triggered by TOS and (b) triggered by exTIS, with fit results shown. |
LcTOSm[..].pdf [22 KiB] HiDef png [199 KiB] Thumbnail [156 KiB] |
|
|
LcTISm[..].pdf [22 KiB] HiDef png [191 KiB] Thumbnail [149 KiB] |
|
|
|
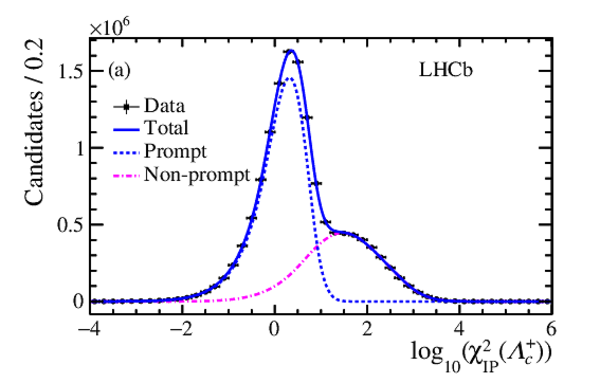
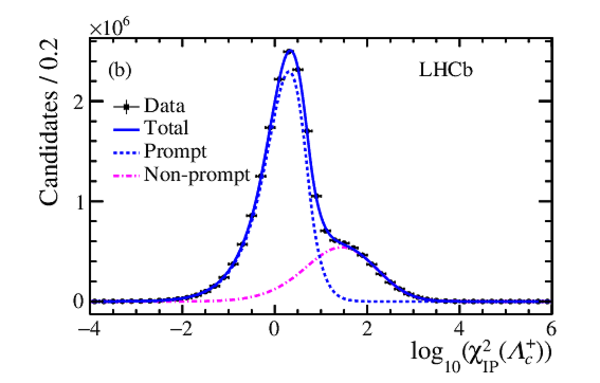
Distributions of $\log_{10}(\chi^2_{\text{IP}} (\Lambda ^+_ c ))$ for background-subtracted candidates (a) triggered by TOS and (b) triggered by exTIS, with fit results shown. |
LcIPTO[..].pdf [20 KiB] HiDef png [168 KiB] Thumbnail [134 KiB] |
|
|
LcIPTI[..].pdf [20 KiB] HiDef png [163 KiB] Thumbnail [129 KiB] |
|
|
|
Animated gif made out of all figures. |
PAPER-2019-035.gif Thumbnail |

|
![HiDef png [240 KiB]](Directory_LHCb-PAPER-2019-035/hidef_TOSMassFit.png)
![HiDef png [232 KiB]](Directory_LHCb-PAPER-2019-035/hidef_TISMassFit.png)
![HiDef png [199 KiB]](Directory_LHCb-PAPER-2019-035/hidef_LcTOSmassfits.png)
![HiDef png [191 KiB]](Directory_LHCb-PAPER-2019-035/hidef_LcTISmassfits.png)
![HiDef png [168 KiB]](Directory_LHCb-PAPER-2019-035/hidef_LcIPTOStight.png)
![HiDef png [163 KiB]](Directory_LHCb-PAPER-2019-035/hidef_LcIPTIStight.png)
Tables and captions
|
Yields of the signal and normalisation modes. |
Table_1.pdf [50 KiB] HiDef png [56 KiB] Thumbnail [24 KiB] tex code |

|
|
Ratios of the normalisation and signal efficiencies. |
Table_2.pdf [85 KiB] HiDef png [35 KiB] Thumbnail [17 KiB] tex code |

|
|
Relative systematic uncertainties on the production ratio measurement for the two trigger categories. |
Table_3.pdf [33 KiB] HiDef png [88 KiB] Thumbnail [42 KiB] tex code |

|
|
Production rate ratio results for three different $\Xi ^{++}_{ c c } $ lifetime hypotheses. The first uncertainty is statistical and the second is systematic. |
Table_4.pdf [93 KiB] HiDef png [49 KiB] Thumbnail [24 KiB] tex code |

|
![HiDef png [56 KiB]](Directory_LHCb-PAPER-2019-035/hidef_Table_1.png)
![HiDef png [35 KiB]](Directory_LHCb-PAPER-2019-035/hidef_Table_2.png)
![HiDef png [88 KiB]](Directory_LHCb-PAPER-2019-035/hidef_Table_3.png)
![HiDef png [49 KiB]](Directory_LHCb-PAPER-2019-035/hidef_Table_4.png)
Created on 20 April 2024.