Information
LHCb-PAPER-2019-036
CERN-EP-2019-264
arXiv:1912.03723 [PDF]
(Submitted on 08 Dec 2019)
JHEP 03 (2020) 147
Inspire 1769307
Tools
Abstract
The decay-time-dependent $CP$ asymmetry in $B^0 \to D^{*\pm}D^{\mp}$ decays is measured using a data set corresponding to an integrated luminosity of $9$fb$^{-1}$ recorded by the LHCb detector in proton-proton collisions at centre-of-mass energies of 7, 8 and 13 TeV. The $CP$ parameters are measured as $ S_{D^*D} = -0.861 \pm 0.077 \text{(stat)} \pm 0.019 \text{(syst)} , $ $ \Delta S_{D^*D} = 0.019 \pm 0.075 \text{(stat)} \pm 0.012 \text{(syst)} , $ $ C_{D^*D} = -0.059 \pm 0.092 \text{(stat)} \pm 0.020 \text{(syst)} , $ $ \Delta C_{D^*D} = -0.031 \pm 0.092 \text{(stat)} \pm 0.016 \text{(syst)} , $ $ {\cal A}_{D^*D} = 0.008 \pm 0.014 \text{(stat)} \pm 0.006 \text{(syst)} . $ The analysis provides the most precise single measurement of $CP$ violation in this decay channel to date. All parameters are consistent with their current world average values.
Figures and captions
|
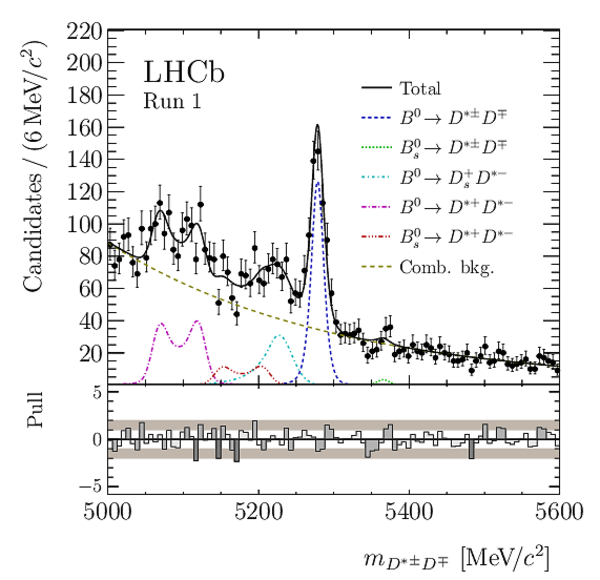
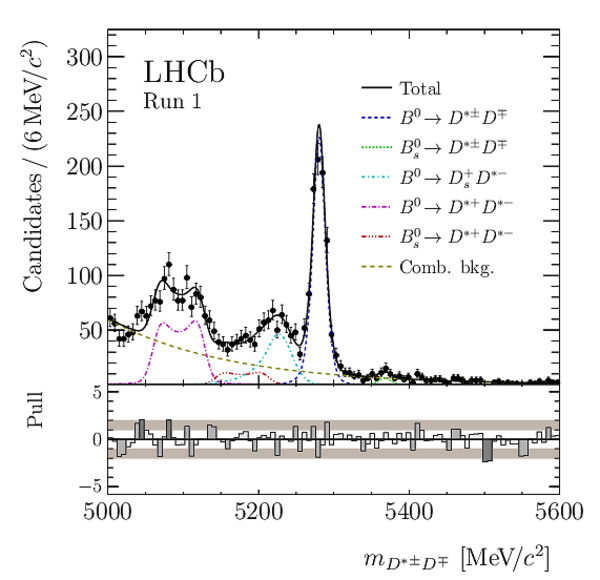
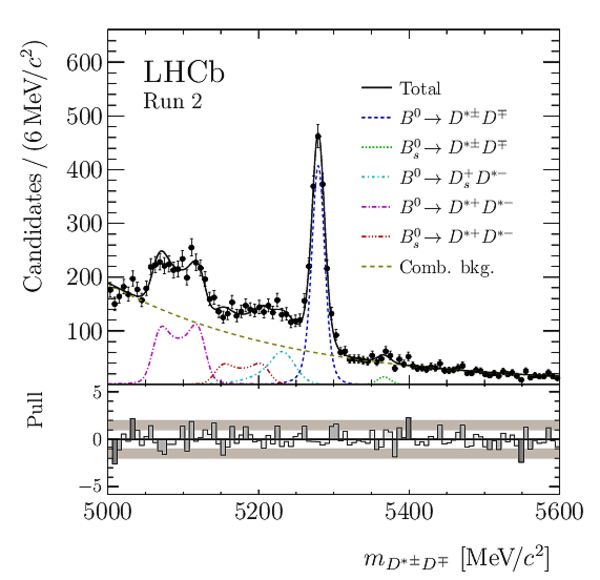
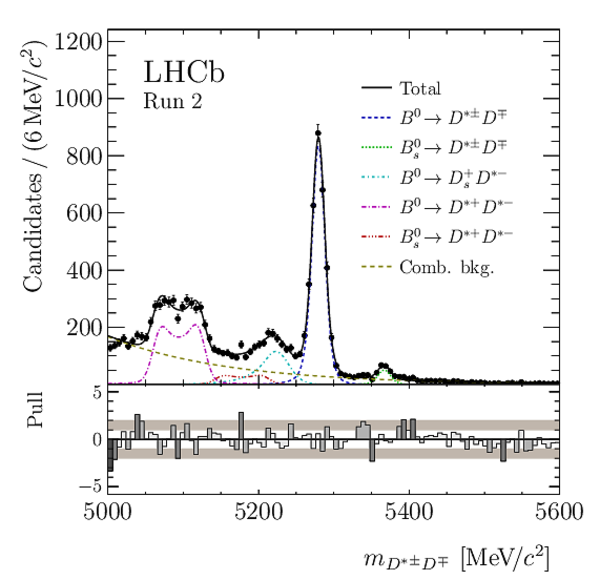
Mass distributions for the $ B ^0 \rightarrow D ^{*\pm} D ^\mp $ decay with (left) $ D ^0 \rightarrow K ^- \pi ^- \pi ^+ \pi ^+ $ and (right) $ D ^0 \rightarrow K ^- \pi ^+ $ for (top) Run 1 and (bottom) Run 2 data samples. Besides the data points and the full PDF (solid black) the projections of the $ B ^0$ signal (dashed blue), the $ B ^0_ s \rightarrow D ^{*\pm} D ^\mp $ background (dotted green), the $ B ^0 \rightarrow D ^+_ s D ^{*-} $ background (dash-dotted turquoise), the $ B ^0 \rightarrow D ^{*+} D ^{*-} $ background (long-dash-dotted magenta), the $ B ^0_ s \rightarrow D ^{*+} D ^{*-} $ background (dash-three-dotted red) and the combinatorial background (long-dashed green) are shown. |
Fig1a.pdf [98 KiB] HiDef png [353 KiB] Thumbnail [319 KiB] *.C file |
|
|
Fig1b.pdf [95 KiB] HiDef png [314 KiB] Thumbnail [272 KiB] *.C file |
|
|
|
Fig1c.pdf [97 KiB] HiDef png [325 KiB] Thumbnail [281 KiB] *.C file |
|
|
|
Fig1d.pdf [97 KiB] HiDef png [302 KiB] Thumbnail [258 KiB] *.C file |
|
|
|
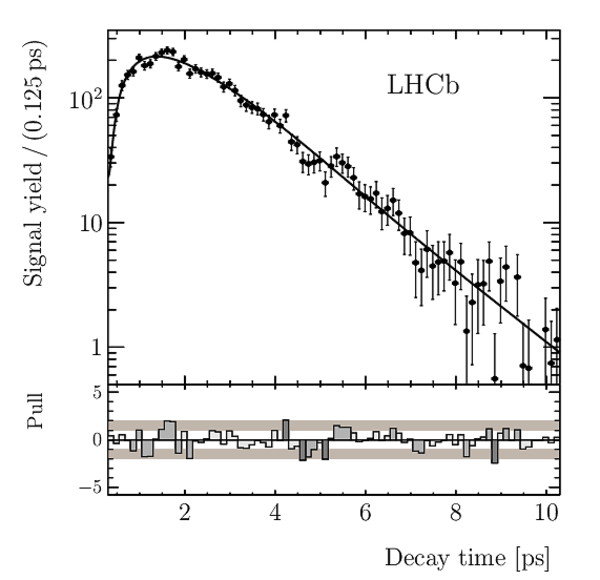
Decay-time distribution of the $ B ^0 \rightarrow D ^{*\pm} D ^\mp $ signal candidates, summed over all data samples, where the background contribution is subtracted by means of the sPlot technique. The projection of the PDF is represented by the full line. |
Fig2.pdf [56 KiB] HiDef png [183 KiB] Thumbnail [190 KiB] *.C file |
|
|
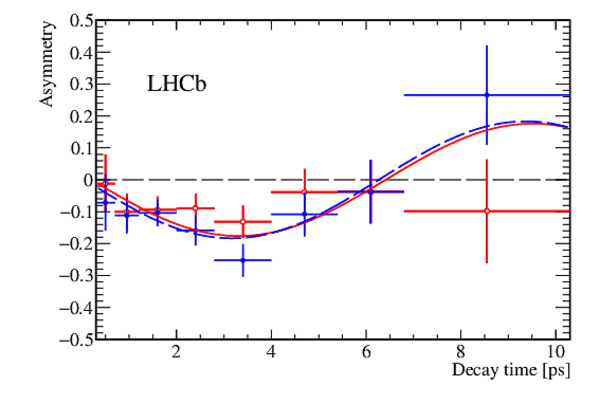
Asymmetry between $\overline{ B } {}^0$ and $ B ^0$ signal yields as a function of the decay time, for (blue full dot) $ D ^{*+}$ $ D ^-$ and (red empty dot) $ D ^{*-}$ $ D ^+$ signal candidates with a non null tagging decision. The background contribution is subtracted by means of the sPlot technique. The corresponding projections of the PDF are represented by the blue dashed (red continuous) line. The $ B ^0$ flavour is determined by the combination of all flavour-tagging algorithms. |
Fig3.pdf [16 KiB] HiDef png [135 KiB] Thumbnail [118 KiB] *.C file |
|
|
Animated gif made out of all figures. |
PAPER-2019-036.gif Thumbnail |

|
![HiDef png [353 KiB]](Directory_LHCb-PAPER-2019-036/hidef_Fig1a.png)
![HiDef png [314 KiB]](Directory_LHCb-PAPER-2019-036/hidef_Fig1b.png)
![HiDef png [325 KiB]](Directory_LHCb-PAPER-2019-036/hidef_Fig1c.png)
![HiDef png [302 KiB]](Directory_LHCb-PAPER-2019-036/hidef_Fig1d.png)
![HiDef png [183 KiB]](Directory_LHCb-PAPER-2019-036/hidef_Fig2.png)
![HiDef png [135 KiB]](Directory_LHCb-PAPER-2019-036/hidef_Fig3.png)
Tables and captions
|
Flavour-tagging parameters obtained as a weighted average of the values measured in the two control channels. The quoted uncertainties are statistical and systematic. |
Table_1.pdf [55 KiB] HiDef png [132 KiB] Thumbnail [52 KiB] tex code |

|
|
Tagging efficiency and tagging power for $ B ^0 \rightarrow D ^{*\pm} D ^\mp $ signal candidates in the four data samples, computed using the event-by-event predicted mistag $\eta$ and the calibration parameters obtained from control channels. The quoted uncertainties are statistical only. |
Table_2.pdf [63 KiB] HiDef png [77 KiB] Thumbnail [37 KiB] tex code |

|
|
Instrumental asymmetries of $ D ^\pm$ , $ D ^{*\pm}$ and their combination for $ B ^0 \rightarrow D ^{*\pm} D ^\mp $ decays obtained from prompt $ D $ meson decays. The quoted uncertainties are statistical, in the last column statistical and systematic. |
Table_3.pdf [81 KiB] HiDef png [31 KiB] Thumbnail [14 KiB] tex code |

|
|
Summary of the systematic uncertainties. The total systematic uncertainties are computed as quadratic sum of individual contributions. |
Table_4.pdf [96 KiB] HiDef png [129 KiB] Thumbnail [53 KiB] tex code |

|
![HiDef png [132 KiB]](Directory_LHCb-PAPER-2019-036/hidef_Table_1.png)
![HiDef png [77 KiB]](Directory_LHCb-PAPER-2019-036/hidef_Table_2.png)
![HiDef png [31 KiB]](Directory_LHCb-PAPER-2019-036/hidef_Table_3.png)
![HiDef png [129 KiB]](Directory_LHCb-PAPER-2019-036/hidef_Table_4.png)
Supplementary Material [file]
| Supplementary material full pdf |
Supple[..].pdf [189 KiB] |

|
Created on 19 April 2024.