cern.ch

Measurement of $CP$ observables in $B^\pm \to D K^\pm$ and $B^\pm \to D \pi^\pm$ with $D \to K_{\rm{S}}^0 K^\pm \pi^\mp$ decays

[to restricted-access page]

Information

Tools

Abstract

Measurements of $CP$ observables in $B^\pm \to D K^\pm$ and $B^\pm \to D \pi^\pm$ decays are presented, where $D$ represents a superposition of $D^0$ and $\bar{D}^0$ states. The $D$ meson is reconstructed in the three-body final state $K_{\rm{S}}^0K^\pm \pi^\mp$. The analysis uses samples of $B$ mesons produced in proton-proton collisions, corresponding to an integrated luminosity of 1.0, 2.0, and 6.0 fb$^{-1}$ collected with the LHCb detector at centre-of-mass energies of $\sqrt{s} = $ 7, 8, and 13 TeV, respectively. These measurements are the most precise to date, and provide important input for the determination of the CKM angle $\gamma$.

Figures and captions

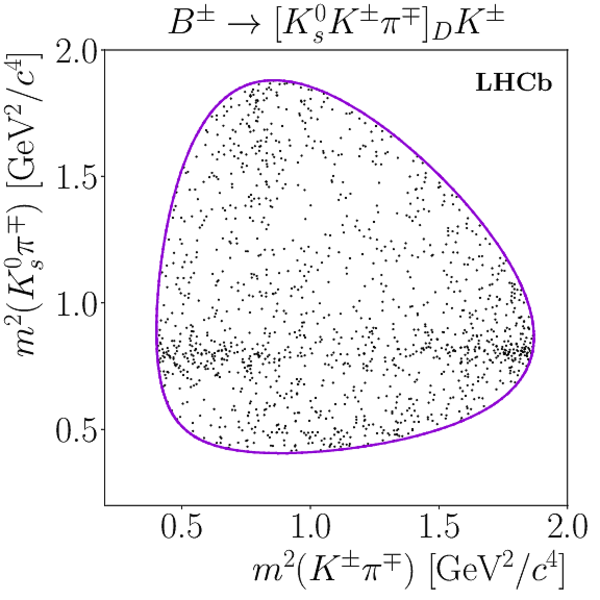
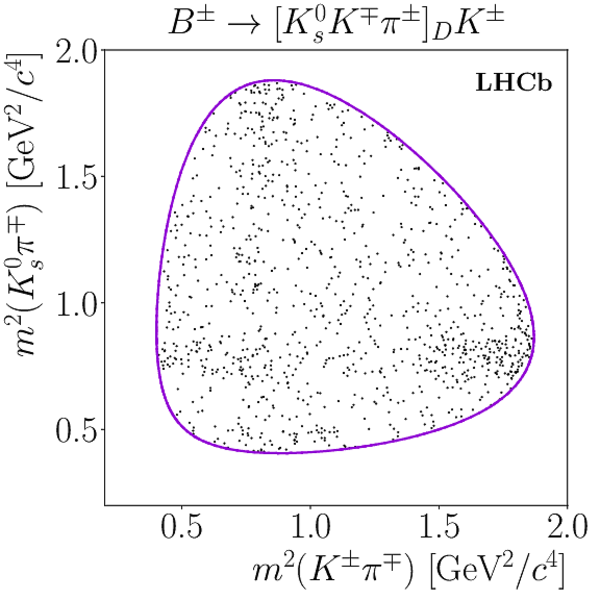
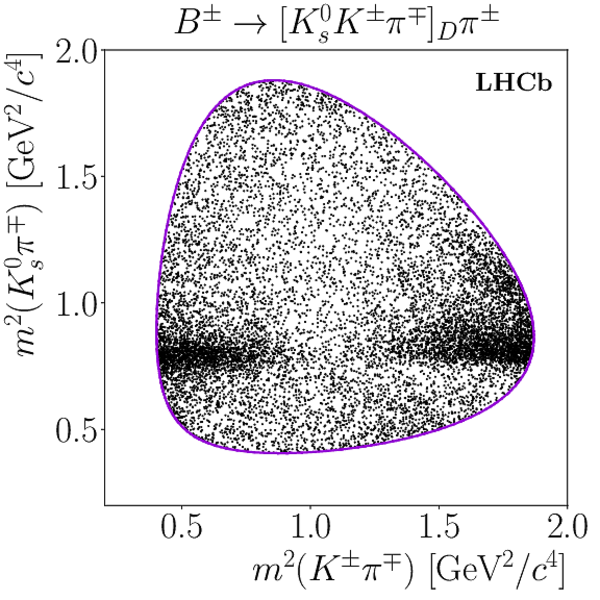
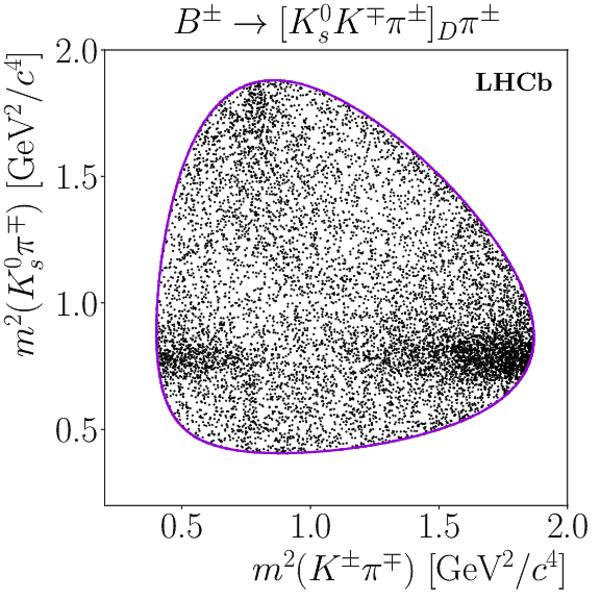
$D\rightarrow K ^0_{\mathrm{S}} K ^+ \pi ^- $ Dalitz plots from the SS (left) and OS (right) data samples, for $ B ^+ \rightarrow D K ^+ $ (top) and $ B ^+ \rightarrow D \pi ^+ $ (bottom). Both long and downstream $ K ^0_{\mathrm{S}} $ decays are included. The purple lines indicate the kinematic boundary.

1a.pdf [153 KiB]
HiDef png [334 KiB]
Thumbnail [296 KiB]
*.C file
1a.pdf
1b.pdf [148 KiB]
HiDef png [310 KiB]
Thumbnail [270 KiB]
*.C file
1b.pdf
1c.pdf [325 KiB]
HiDef png [801 KiB]
Thumbnail [648 KiB]
*.C file
1c.pdf
1d.pdf [279 KiB]
HiDef png [761 KiB]
Thumbnail [630 KiB]
*.C file
1d.pdf

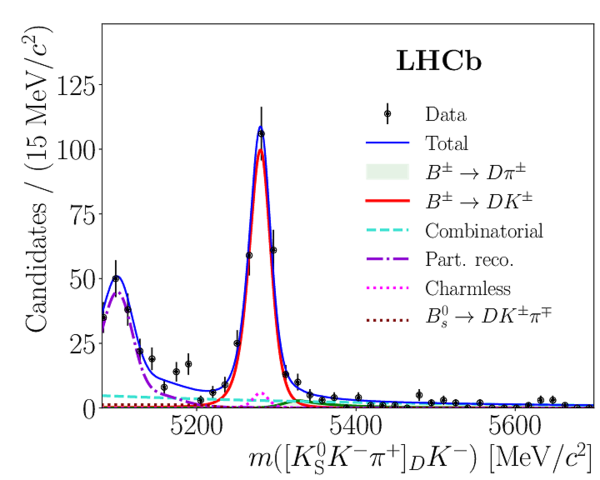
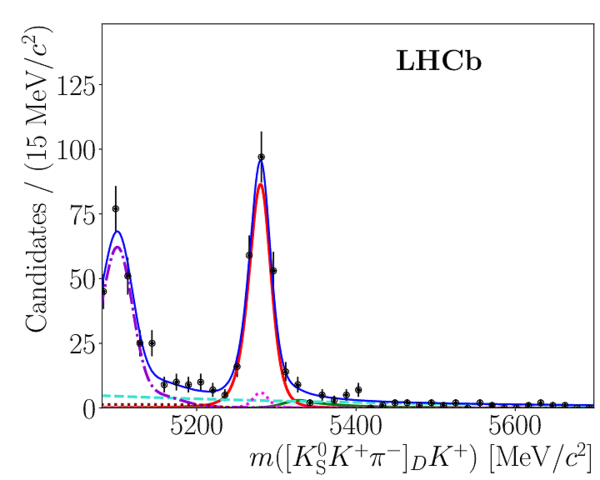
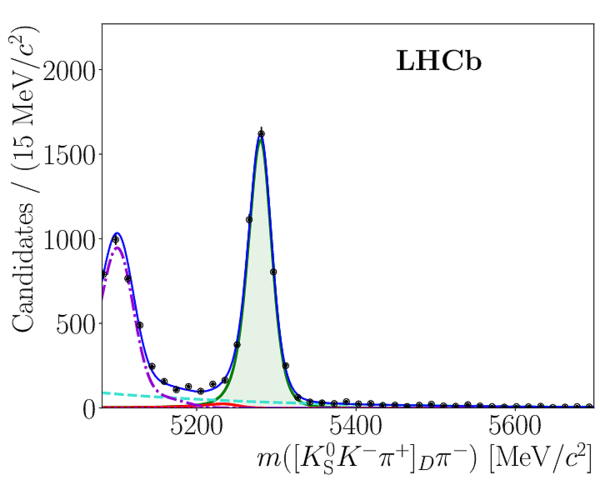
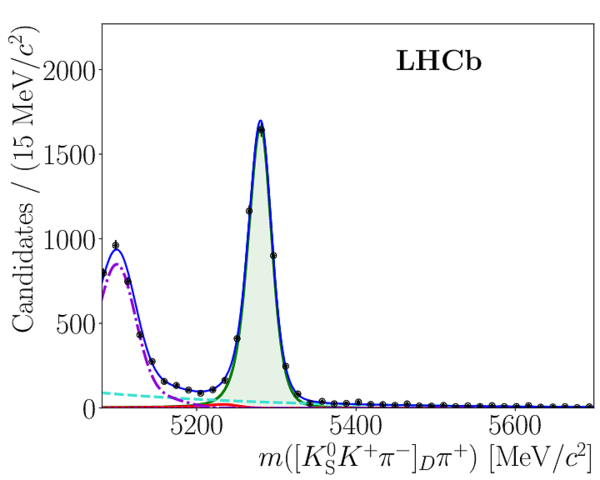
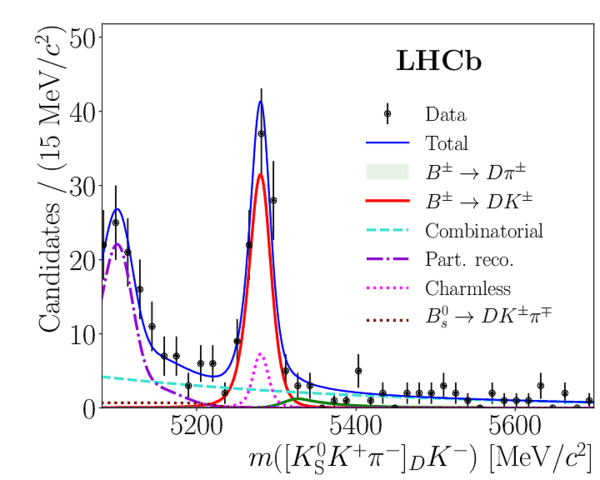
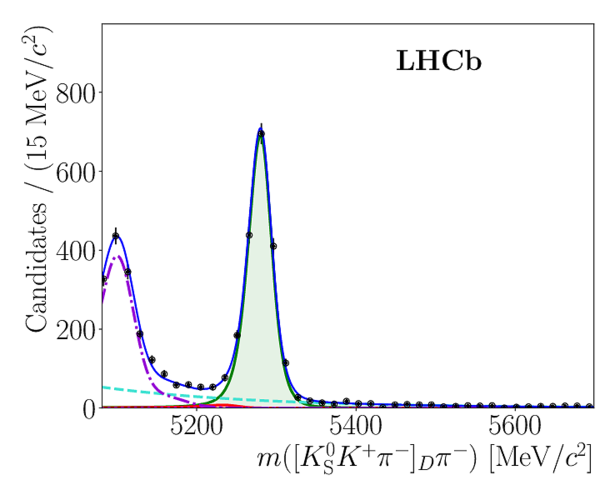
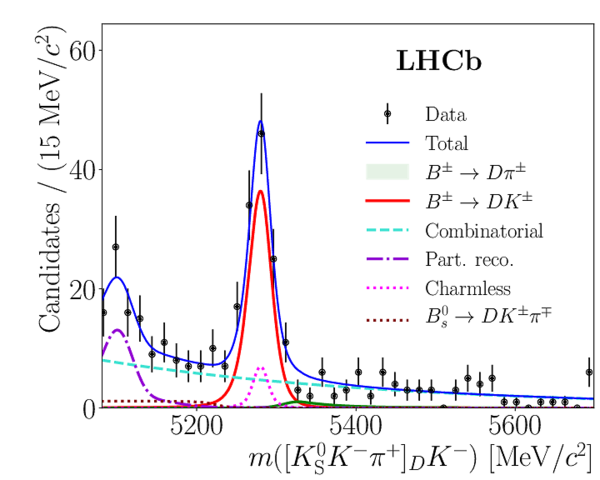
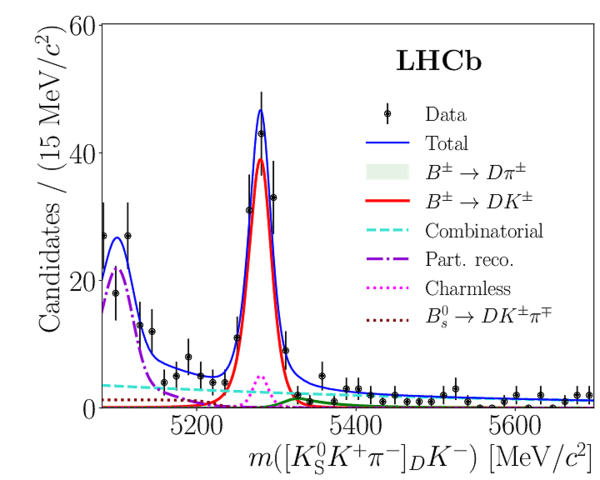
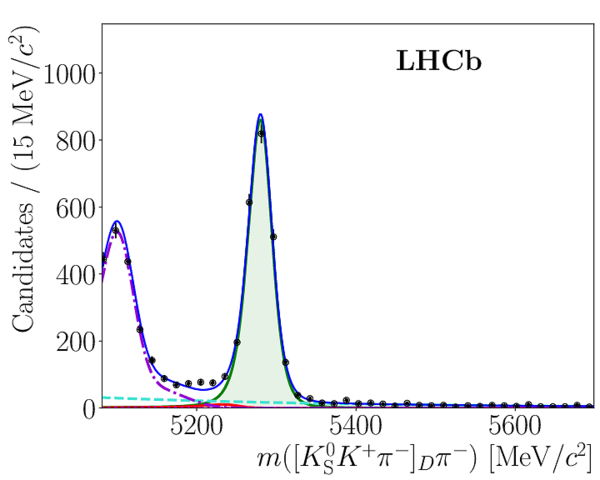
Invariant mass of SS $ B ^\pm \rightarrow [ K ^0_{\mathrm{S}} K ^\pm \pi ^\mp ]_D h^{\pm}$ candidates within the $ K ^{*+}$ region; candidates containing both long and downstream $K_s^0$ mesons are shown.

2a.pdf [144 KiB]
HiDef png [291 KiB]
Thumbnail [195 KiB]
*.C file
2a.pdf
2b.pdf [143 KiB]
HiDef png [242 KiB]
Thumbnail [149 KiB]
*.C file
2b.pdf
2c.pdf [143 KiB]
HiDef png [242 KiB]
Thumbnail [148 KiB]
*.C file
2c.pdf
2d.pdf [143 KiB]
HiDef png [240 KiB]
Thumbnail [148 KiB]
*.C file
2d.pdf

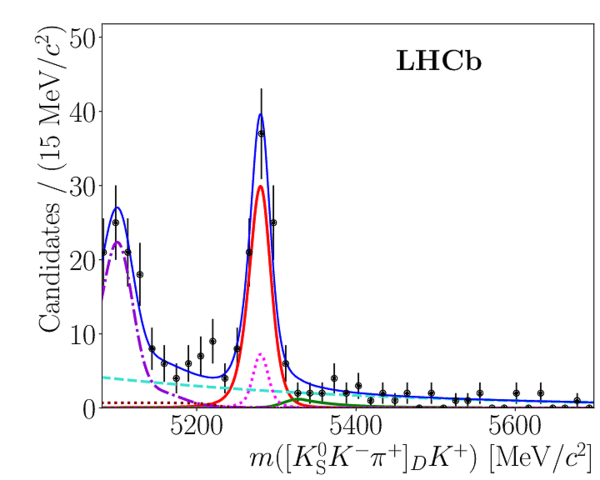
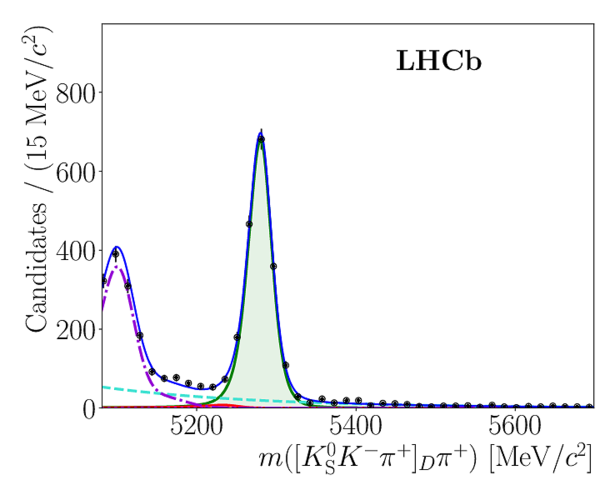
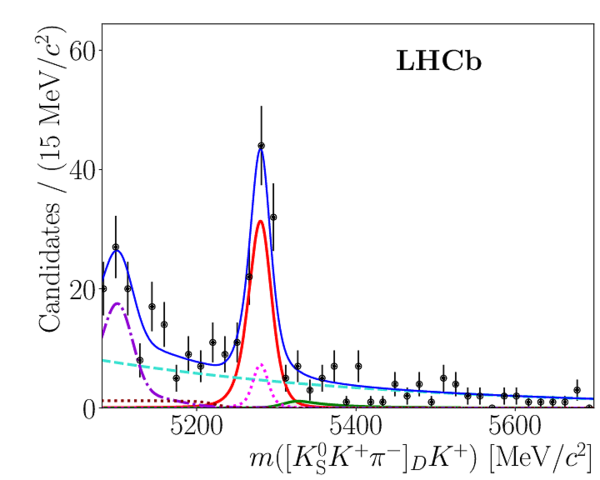
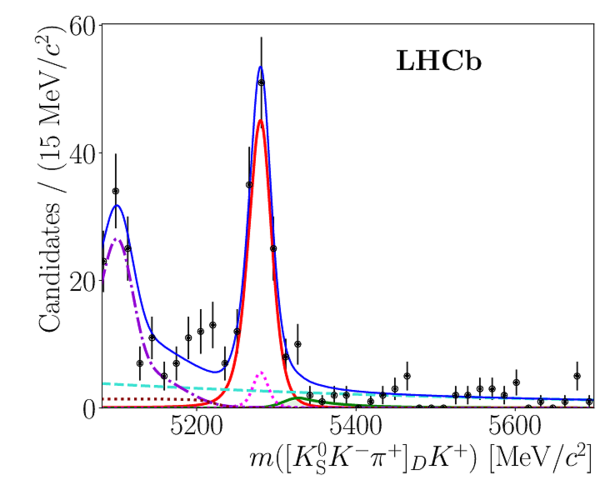
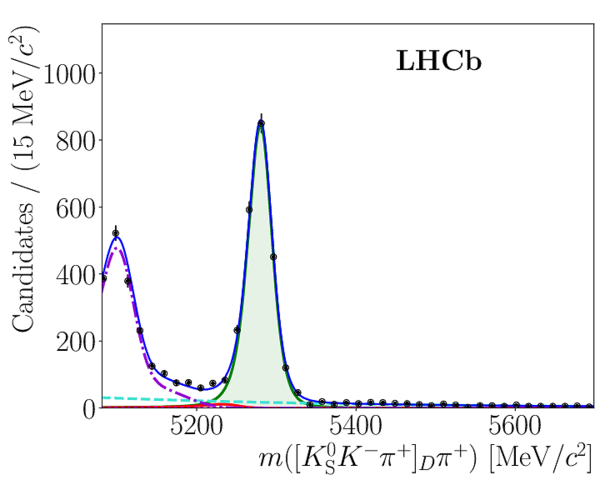
Invariant mass of OS $ B ^\pm \rightarrow [ K ^0_{\mathrm{S}} K ^\mp \pi ^\pm ]_D h^{\pm}$ candidates within the $ K ^{*+}$ region. The fit components are detailed in the legend of Fig. 2.

3a.pdf [145 KiB]
HiDef png [325 KiB]
Thumbnail [218 KiB]
*.C file
3a.pdf
3b.pdf [144 KiB]
HiDef png [275 KiB]
Thumbnail [169 KiB]
*.C file
3b.pdf
3c.pdf [143 KiB]
HiDef png [244 KiB]
Thumbnail [148 KiB]
*.C file
3c.pdf
3d.pdf [143 KiB]
HiDef png [239 KiB]
Thumbnail [148 KiB]
*.C file
3d.pdf

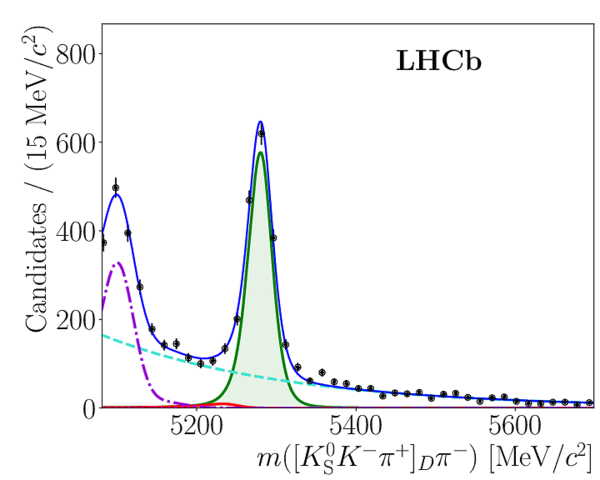
Invariant mass of SS $ B ^\pm \rightarrow [ K ^0_{\mathrm{S}} K ^\pm \pi ^\mp ]_D h^{\pm}$ candidates in the non- $ K ^{*+}$ region. The fit components are detailed in the legend of Fig. 2.

4a.pdf [144 KiB]
HiDef png [304 KiB]
Thumbnail [210 KiB]
*.C file
4a.pdf
4b.pdf [144 KiB]
HiDef png [254 KiB]
Thumbnail [164 KiB]
*.C file
4b.pdf
4c.pdf [144 KiB]
HiDef png [270 KiB]
Thumbnail [165 KiB]
*.C file
4c.pdf
4d.pdf [144 KiB]
HiDef png [272 KiB]
Thumbnail [166 KiB]
*.C file
4d.pdf

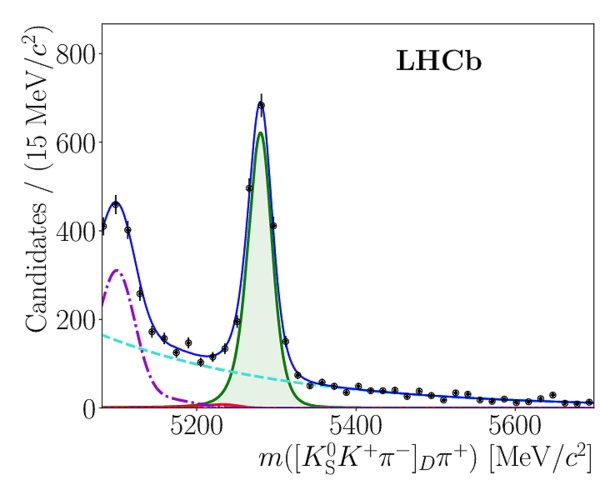
Invariant mass of OS $ B ^\pm \rightarrow [ K ^0_{\mathrm{S}} K ^\mp \pi ^\pm ]_D h^{\pm}$ candidates in the non- $ K ^{*+}$ region. The fit components are detailed in the legend of Fig. 2.

5a.pdf [144 KiB]
HiDef png [313 KiB]
Thumbnail [210 KiB]
*.C file
5a.pdf
5b.pdf [144 KiB]
HiDef png [274 KiB]
Thumbnail [167 KiB]
*.C file
5b.pdf
5c.pdf [143 KiB]
HiDef png [253 KiB]
Thumbnail [153 KiB]
*.C file
5c.pdf
5d.pdf [143 KiB]
HiDef png [247 KiB]
Thumbnail [153 KiB]
*.C file
5d.pdf

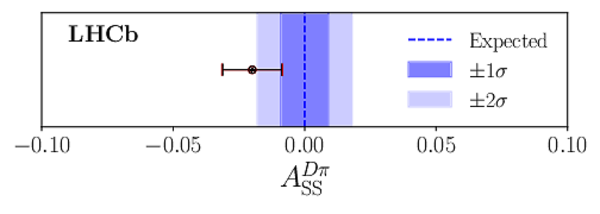
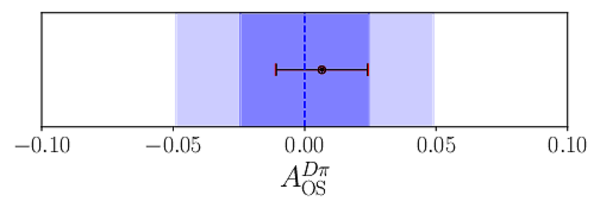
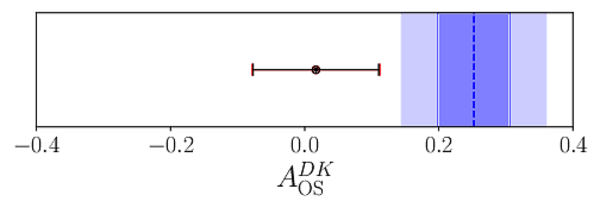
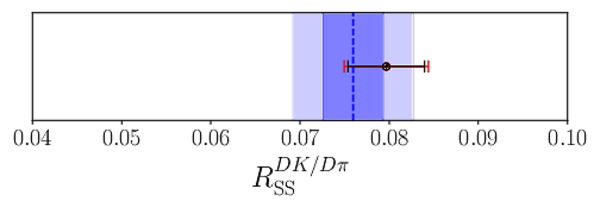
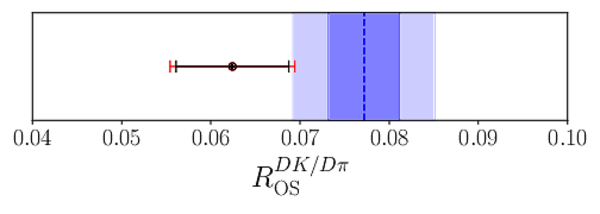
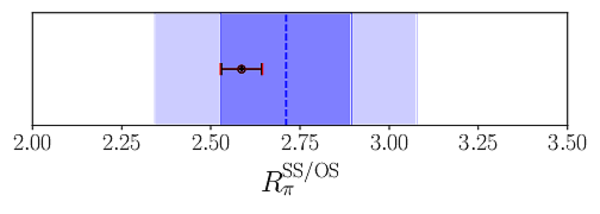
Comparison with SM expectations for results within the $ K ^{*+}$ region, using current world-average parameter values. The dashed blue line indicates the expected SM value, and the shaded dark (light) blue regions indicate the 68% (95%) confidence-level intervals. The results are shown as black points with black (red) error bars indicating the statistical (total) uncertainty.

6a.pdf [126 KiB]
HiDef png [53 KiB]
Thumbnail [51 KiB]
*.C file
6a.pdf
6b.pdf [96 KiB]
HiDef png [38 KiB]
Thumbnail [33 KiB]
*.C file
6b.pdf
6c.pdf [96 KiB]
HiDef png [37 KiB]
Thumbnail [30 KiB]
*.C file
6c.pdf
6d.pdf [96 KiB]
HiDef png [36 KiB]
Thumbnail [29 KiB]
*.C file
6d.pdf
6e.pdf [66 KiB]
HiDef png [48 KiB]
Thumbnail [43 KiB]
*.C file
6e.pdf
6f.pdf [66 KiB]
HiDef png [47 KiB]
Thumbnail [43 KiB]
*.C file
6f.pdf
6g.pdf [66 KiB]
HiDef png [50 KiB]
Thumbnail [43 KiB]
*.C file
6g.pdf

Animated gif made out of all figures.

PAPER-2019-044.gif
Thumbnail
thumbnail_PAPER-2019-044.gif

Tables and captions

Signal yields summed over charge, as measured in each Dalitz region.

Table_1.pdf [73 KiB]
HiDef png [70 KiB]
Thumbnail [33 KiB]
tex code
Table_1.pdf

Table_2.pdf [75 KiB]
HiDef png [50 KiB]
Thumbnail [19 KiB]
tex code
Table_2.pdf

Table_3.pdf [75 KiB]
HiDef png [51 KiB]
Thumbnail [19 KiB]
tex code
Table_3.pdf

Table_4.pdf [70 KiB]
HiDef png [44 KiB]
Thumbnail [16 KiB]
tex code
Table_4.pdf

Table_5.pdf [70 KiB]
HiDef png [44 KiB]
Thumbnail [16 KiB]
tex code
Table_5.pdf

Table_6.pdf [70 KiB]
HiDef png [44 KiB]
Thumbnail [16 KiB]
tex code
Table_6.pdf

Table_7.pdf [70 KiB]
HiDef png [45 KiB]
Thumbnail [16 KiB]
tex code
Table_7.pdf

Created on 19 April 2024.