Information
LHCb-PAPER-2020-003
CERN-EP-2020-048
arXiv:2004.08163 [PDF]
(Submitted on 17 Apr 2020)
JHEP 07 (2020) 123
Inspire 1791633
Tools
Abstract
A precision measurement of the $B_{c}^{+}$ meson mass is performed using proton-proton collision data collected with the LHCb experiment at centre-of-mass energies of $7, 8$ and $13$ TeV, corresponding to a total integrated luminosity of $9.0 {\rm fb}^{-1}$. The $B_{c}^{+}$ mesons are reconstructed via the decays $B_{c}^{+} \rightarrow J\mskip -3mu/\mskip -2mu\psi\mskip 2mu \pi^+$, $B_{c}^{+} \rightarrow J\mskip -3mu/\mskip -2mu\psi\mskip 2mu \pi^+ \pi^- \pi^+$, $B_{c}^{+} \rightarrow J\mskip -3mu/\mskip -2mu\psi\mskip 2mu p \bar{p} \pi^+$, $B_{c}^{+} \rightarrow J\mskip -3mu/\mskip -2mu\psi\mskip 2mu D_{s}^{+}$, $B_{c}^{+} \rightarrow J\mskip -3mu/\mskip -2mu\psi\mskip 2mu D^{0} K^{+}$ and $B_{c}^{+} \rightarrow B_{s}^{0} \pi^{+}$. Combining the results of the individual decay channels, the $B_{c}^{+}$ mass is measured to be $6274.47 \pm 0.27 ({\rm stat}) \pm 0.17 ({\rm syst}) \mathrm{ Me V}/c^{2}$. This is the most precise measurement of the $B_{c}^{+}$ mass to date. The difference between the $B_{c}^{+}$ and $B_{s}^{0}$ meson masses is measured to be $907.75 \pm 0.37 ({\rm stat}) \pm 0.27 ({\rm syst}) \mathrm{ Me V}/c^{2}$.
Figures and captions
|
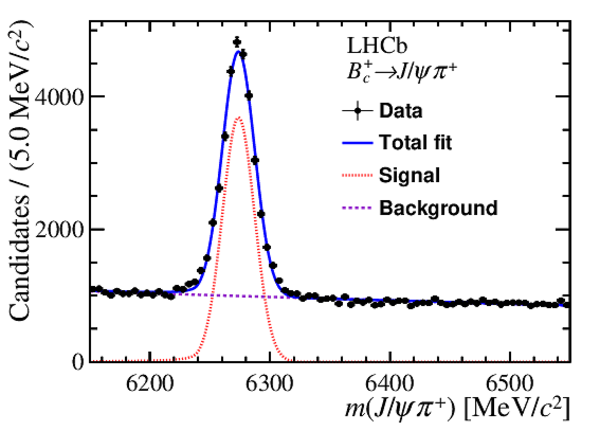
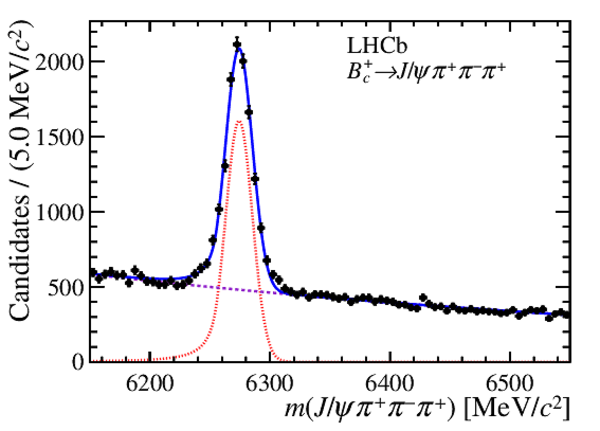
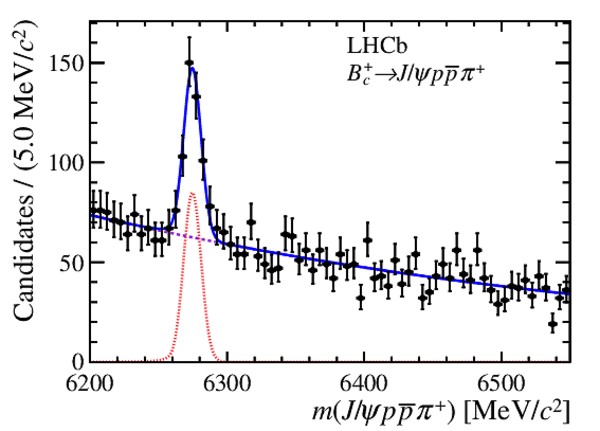
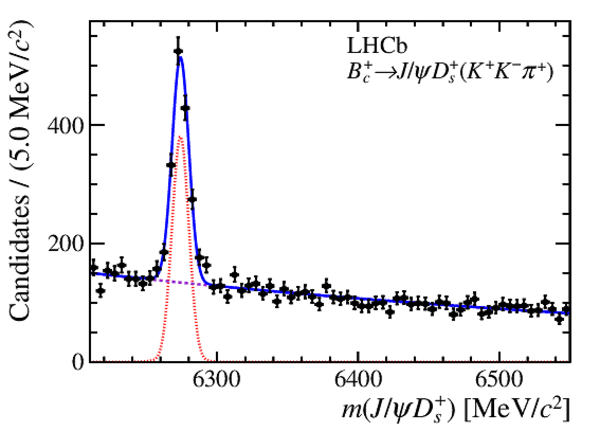
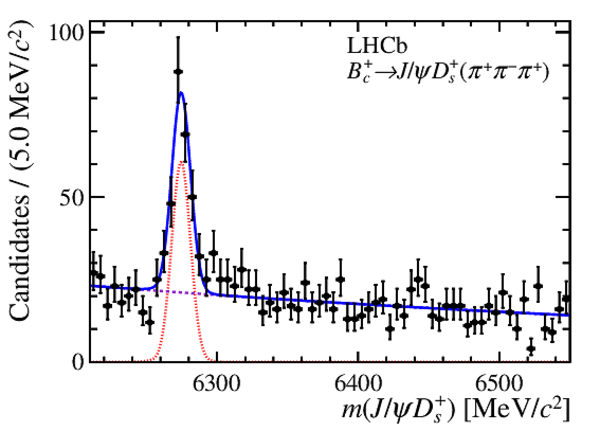
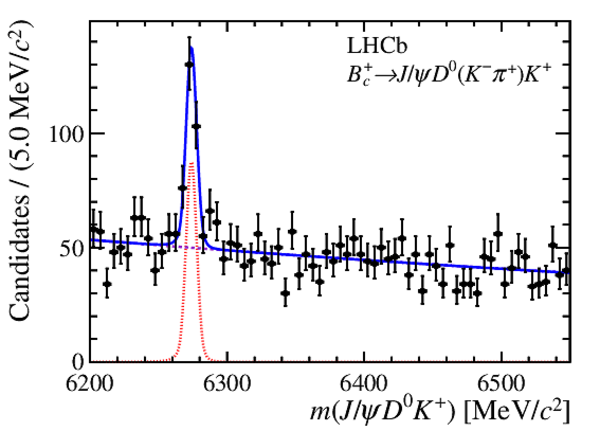
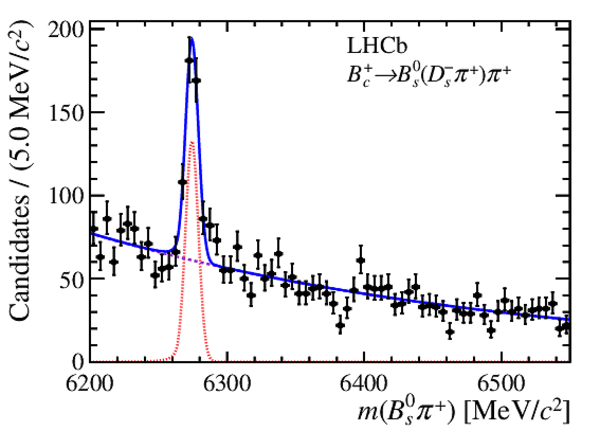
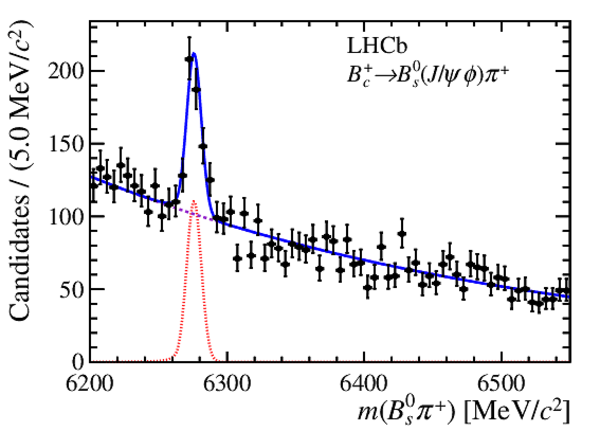
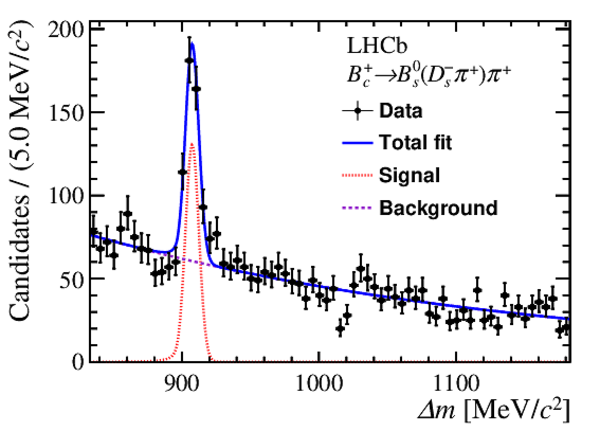
Distributions of invariant-mass $m$ for $B_{c}^{+}$ candidates selected in the studied decay channels, where data are shown as the points with error bars; the total fits are shown as solid blue curves; the signal component are red dotted curves; the background components purple dotted curves. |
Fig1a.pdf [30 KiB] HiDef png [232 KiB] Thumbnail [183 KiB] *.C file |
|
|
Fig1b.pdf [30 KiB] HiDef png [229 KiB] Thumbnail [182 KiB] *.C file |
|
|
|
Fig1c.pdf [28 KiB] HiDef png [238 KiB] Thumbnail [199 KiB] *.C file |
|
|
|
Fig1d.pdf [27 KiB] HiDef png [231 KiB] Thumbnail [172 KiB] *.C file |
|
|
|
Fig1e.pdf [27 KiB] HiDef png [235 KiB] Thumbnail [188 KiB] *.C file |
|
|
|
Fig1f.pdf [27 KiB] HiDef png [247 KiB] Thumbnail [201 KiB] *.C file |
|
|
|
Fig1g.pdf [28 KiB] HiDef png [248 KiB] Thumbnail [203 KiB] *.C file |
|
|
|
Fig1h.pdf [28 KiB] HiDef png [241 KiB] Thumbnail [203 KiB] *.C file |
|
|
|
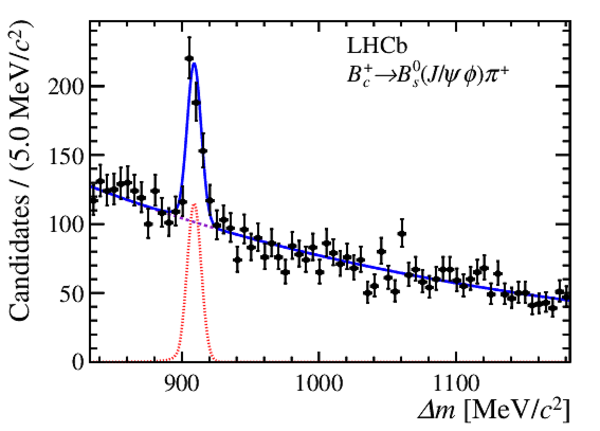
Distributions of mass difference $\Delta m$ for the $B_{c}^{+} \rightarrow B_{s}^{0} (D_{s}^{-} \pi^{+}) \pi^{+}$ and $B_{c}^{+} \rightarrow B_{s}^{0} (J\mskip -3mu/\mskip -2mu\psi\mskip 2mu \phi) \pi^{+}$ decay modes, where data are shown as the points with error bars; the total fits are shown as solid blue curves; the signal component are red dotted curves; the background components purple dotted curves. |
Fig2a.pdf [28 KiB] HiDef png [258 KiB] Thumbnail [216 KiB] *.C file |
|
|
Fig2b.pdf [28 KiB] HiDef png [229 KiB] Thumbnail [192 KiB] *.C file |
|
|
|
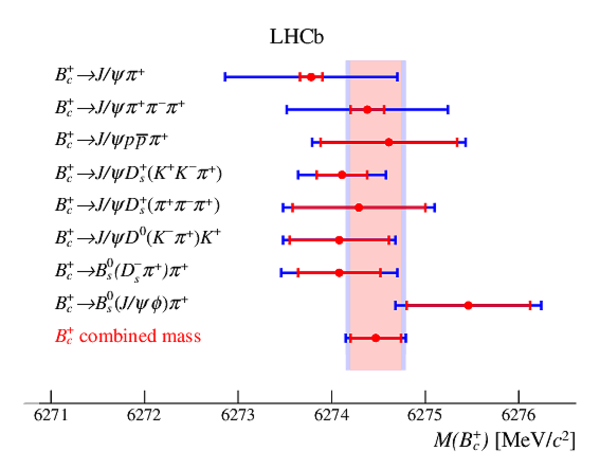
Individual $B_{c}^{+}$ mass measurements and their combination. The red (inner) cross-bars show the statistical uncertainties, and the blue (outer) cross-bars show the total uncertainties. |
Fig3.pdf [14 KiB] HiDef png [179 KiB] Thumbnail [145 KiB] *.C file |
|
|
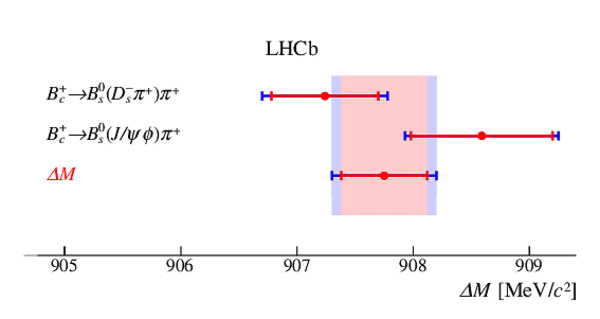
Individual mass difference measurements and their combination. The red (inner) cross-bars show the statistical uncertainties, and the blue (outer) cross-bars show the total uncertainties on the measurement. |
Fig4.pdf [13 KiB] HiDef png [76 KiB] Thumbnail [59 KiB] *.C file |
|
|
Animated gif made out of all figures. |
PAPER-2020-003.gif Thumbnail |

|
![HiDef png [232 KiB]](Directory_LHCb-PAPER-2020-003/hidef_Fig1a.png)
![HiDef png [229 KiB]](Directory_LHCb-PAPER-2020-003/hidef_Fig1b.png)
![HiDef png [238 KiB]](Directory_LHCb-PAPER-2020-003/hidef_Fig1c.png)
![HiDef png [231 KiB]](Directory_LHCb-PAPER-2020-003/hidef_Fig1d.png)
![HiDef png [235 KiB]](Directory_LHCb-PAPER-2020-003/hidef_Fig1e.png)
![HiDef png [247 KiB]](Directory_LHCb-PAPER-2020-003/hidef_Fig1f.png)
![HiDef png [248 KiB]](Directory_LHCb-PAPER-2020-003/hidef_Fig1g.png)
![HiDef png [241 KiB]](Directory_LHCb-PAPER-2020-003/hidef_Fig1h.png)
![HiDef png [258 KiB]](Directory_LHCb-PAPER-2020-003/hidef_Fig2a.png)
![HiDef png [229 KiB]](Directory_LHCb-PAPER-2020-003/hidef_Fig2b.png)
![HiDef png [179 KiB]](Directory_LHCb-PAPER-2020-003/hidef_Fig3.png)
![HiDef png [76 KiB]](Directory_LHCb-PAPER-2020-003/hidef_Fig4.png)
Tables and captions
|
Signal yields, mass values and mass resolutions as obtained from fits shown in Fig. 1, together with the mass corrected for the effects of final-state radiation and selection as described in the text. The uncertainties are statistical only. |
Table_1.pdf [71 KiB] HiDef png [108 KiB] Thumbnail [51 KiB] tex code |

|
|
Signal yields, mass difference $(\Delta M)$ and resolution as obtained from fits shown in Fig. 2, together with the values corrected for the effects of final-state radiation and selection as described in the text. The uncertainties are statistical only. |
Table_2.pdf [70 KiB] HiDef png [48 KiB] Thumbnail [23 KiB] tex code |

|
|
Summary of systematic uncertainties (in $\mathrm{ Me V}/c^{2}$) on the $B_{c}^{+}$ mass. |
Table_3.pdf [64 KiB] HiDef png [74 KiB] Thumbnail [33 KiB] tex code |

|
|
Summary of systematic uncertainties on the mass difference $\Delta M$ (in $\mathrm{ Me V}/c^{2}$) for the $B_{s}^{0} (D_s^- \pi^+) \pi^+$ and $B_{s}^{0} (J\mskip -3mu/\mskip -2mu\psi\mskip 2mu \phi) \pi^{+}$ decays. |
Table_4.pdf [63 KiB] HiDef png [37 KiB] Thumbnail [15 KiB] tex code |

|
|
Breakdown of systematic uncertainties (in $\mathrm{ Me V}/c^{2}$) in the combination of the $B_{c}^{+}$ mass and the mass difference $\Delta M$. The total uncertainty is the sum in quadrature of the uncertainty of different sources. |
Table_5.pdf [41 KiB] HiDef png [83 KiB] Thumbnail [38 KiB] tex code |

|
|
Weights of the decay modes in the combination of the $B_{c}^{+}$ mass and the mass difference $\Delta M$. |
Table_6.pdf [69 KiB] HiDef png [91 KiB] Thumbnail [43 KiB] tex code |

|
![HiDef png [108 KiB]](Directory_LHCb-PAPER-2020-003/hidef_Table_1.png)
![HiDef png [48 KiB]](Directory_LHCb-PAPER-2020-003/hidef_Table_2.png)
![HiDef png [74 KiB]](Directory_LHCb-PAPER-2020-003/hidef_Table_3.png)
![HiDef png [37 KiB]](Directory_LHCb-PAPER-2020-003/hidef_Table_4.png)
![HiDef png [83 KiB]](Directory_LHCb-PAPER-2020-003/hidef_Table_5.png)
![HiDef png [91 KiB]](Directory_LHCb-PAPER-2020-003/hidef_Table_6.png)
Created on 12 April 2024.