Measurement of the $\Lambda^0_b\rightarrow J/\psi\Lambda$ angular distribution and the $\Lambda^0_b$ polarisation in $pp$ collisions
[to restricted-access page]Information
LHCb-PAPER-2020-005
CERN-EP-2020-051
arXiv:2004.10563 [PDF]
ancillary file
(Submitted on 22 Apr 2020)
JHEP 06 (2020) 110
Inspire 1792130
Tools
Abstract
This paper presents an analysis of the $\Lambda^0_b\rightarrow J/\psi\Lambda$ angular distribution and the transverse production polarisation of $\Lambda^0_b$ baryons in proton-proton collisions at centre-of-mass energies of 7, 8 and 13 TeV. The measurements are performed using data corresponding to an integrated luminosity of 4.9 fb$^{-1}$, collected with the LHCb experiment. The polarisation is determined in a fiducial region of $\Lambda^0_b$ transverse momentum and pseudorapidity of $1 < p_{T} < 20$ GeV$/c$ and $2 < \eta < 5$, respectively. The data are consistent with $\Lambda^0_b$ baryons being produced unpolarised in this region. The parity-violating asymmetry parameter of the $\Lambda\rightarrow p\pi^-$ decay is also determined from the data and its value is found to be consistent with a recent measurement by the BES III collaboration.
Figures and captions
|
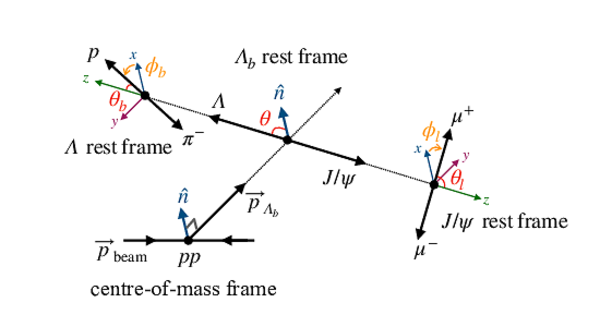
Definition of the five decay angles, $\theta$, $\theta_b$, $\phi_b$, $\theta_{l}$ and $\phi_l$ used to describe the kinematics of the $\Lambda ^0_ b \rightarrow { J \mskip -3mu/\mskip -2mu\psi \mskip 2mu} \Lambda $ decay. The angles are described in the text. |
Fig1.pdf [90 KiB] HiDef png [151 KiB] Thumbnail [110 KiB] *.C file |
|
|
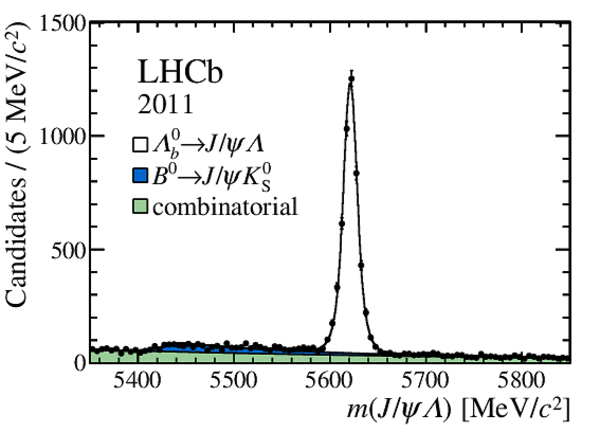
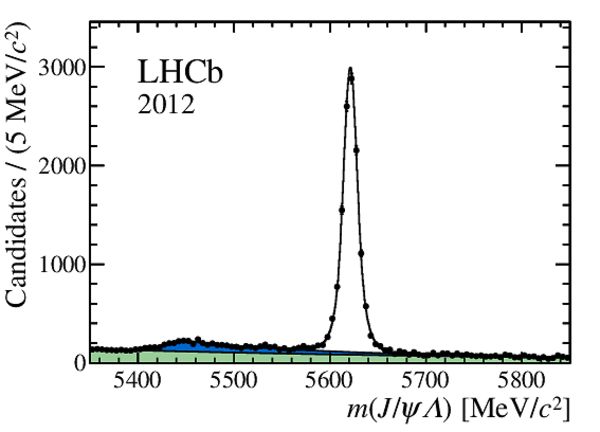
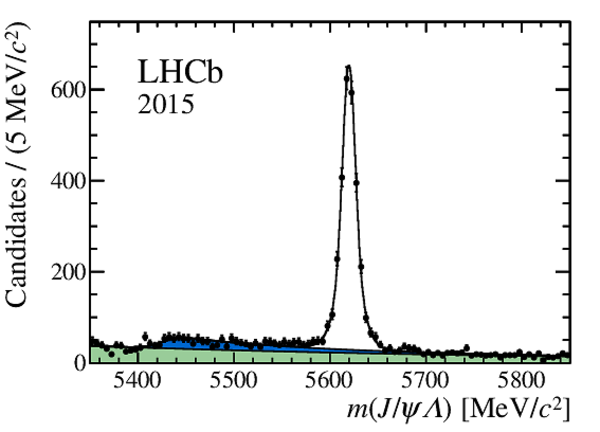
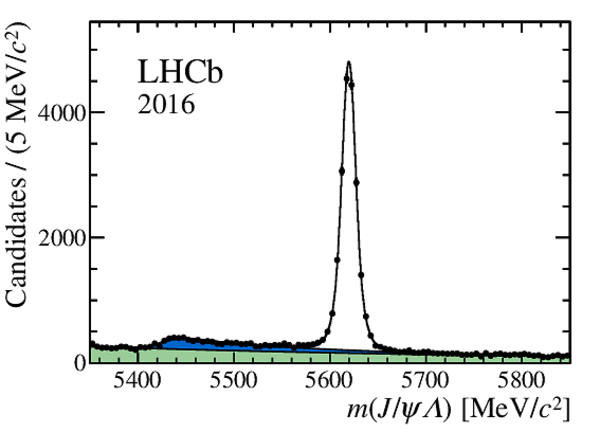
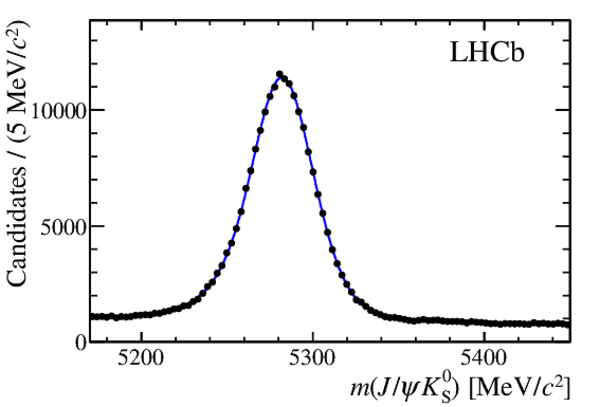
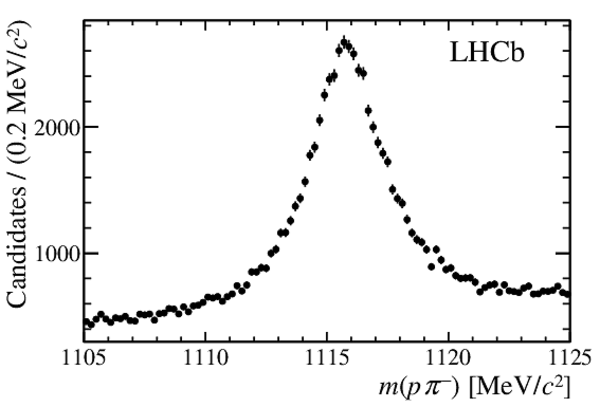
Mass distribution of selected $\Lambda ^0_ b \rightarrow { J \mskip -3mu/\mskip -2mu\psi \mskip 2mu} \Lambda $ candidates in (top-left) the 2011, (top-right) the 2012, (bottom-left) the 2015 and (bottom-right) the 2016 data sets. The long and downstream categories have been combined. The results of fits to the distributions are overlaid. |
Fig2a.pdf [55 KiB] HiDef png [199 KiB] Thumbnail [176 KiB] *.C file |
|
|
Fig2b.pdf [55 KiB] HiDef png [170 KiB] Thumbnail [149 KiB] *.C file |
|
|
|
Fig2c.pdf [56 KiB] HiDef png [178 KiB] Thumbnail [153 KiB] *.C file |
|
|
|
Fig2d.pdf [54 KiB] HiDef png [167 KiB] Thumbnail [143 KiB] *.C file |
|
|
|
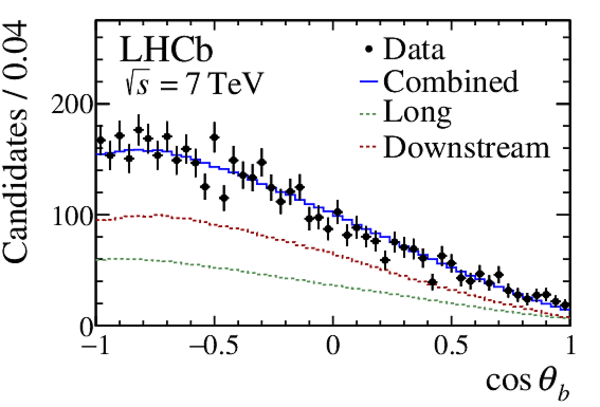
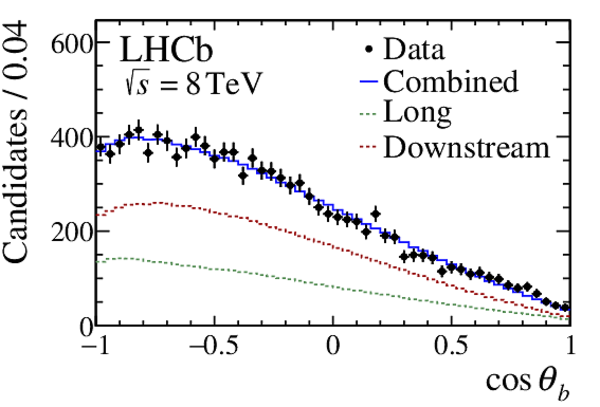
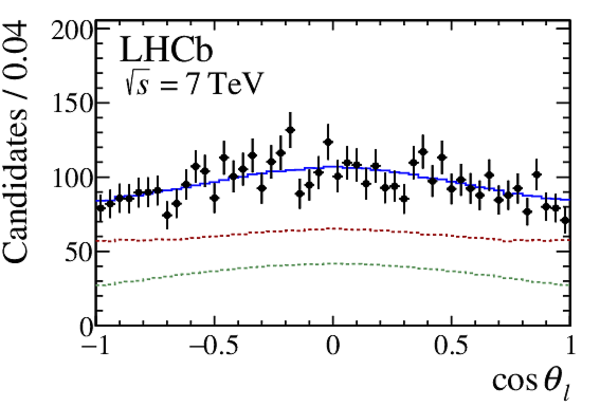
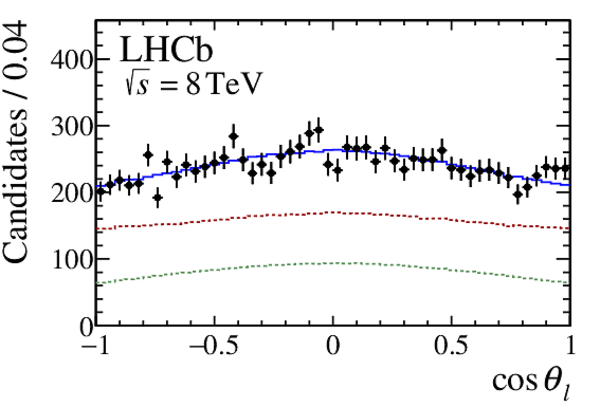
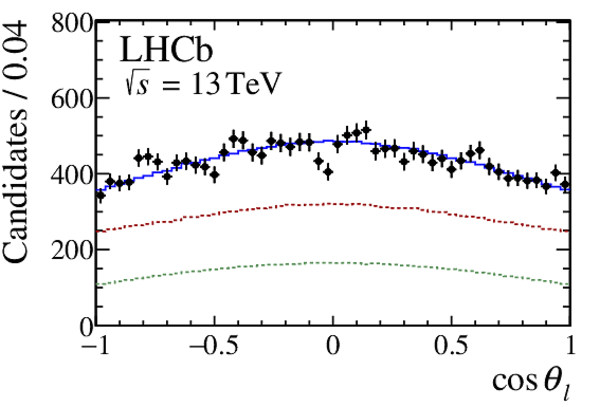
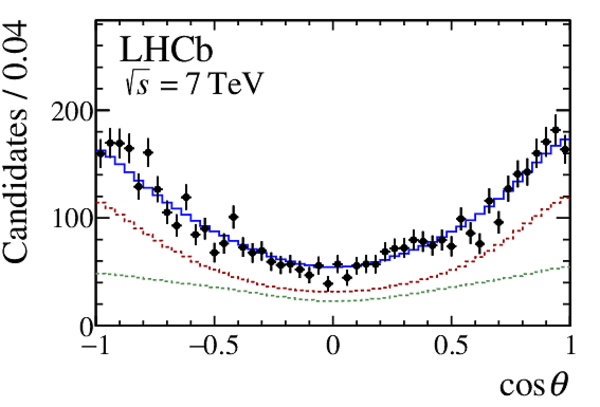
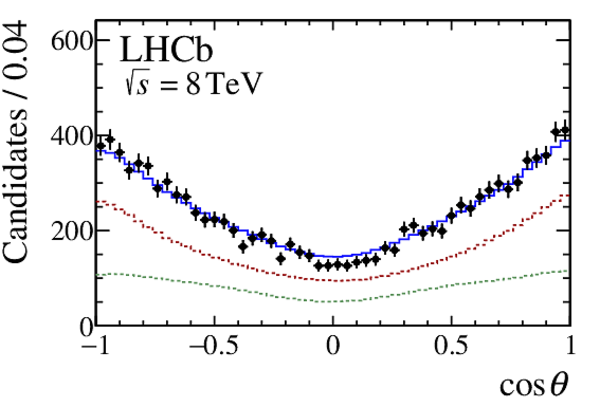
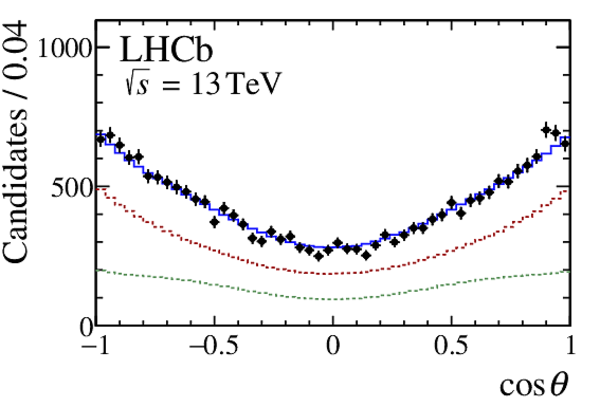
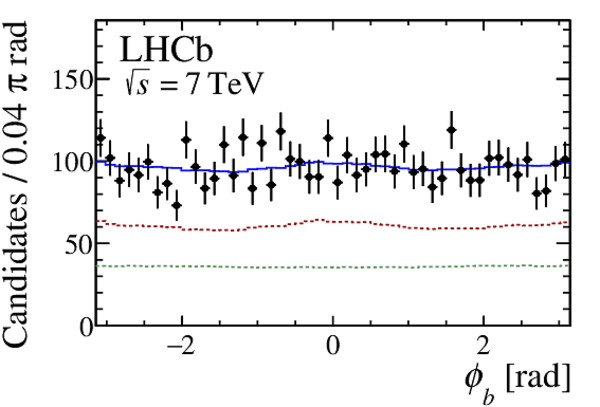
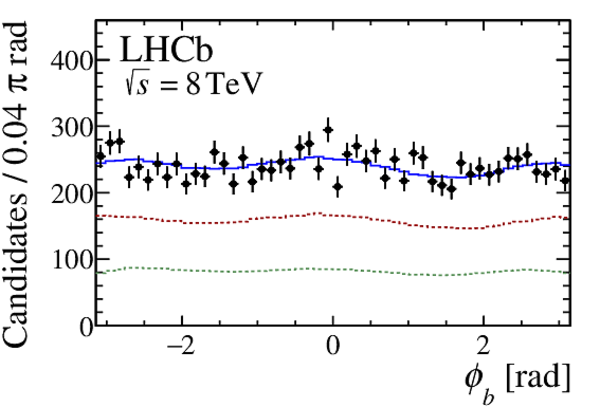
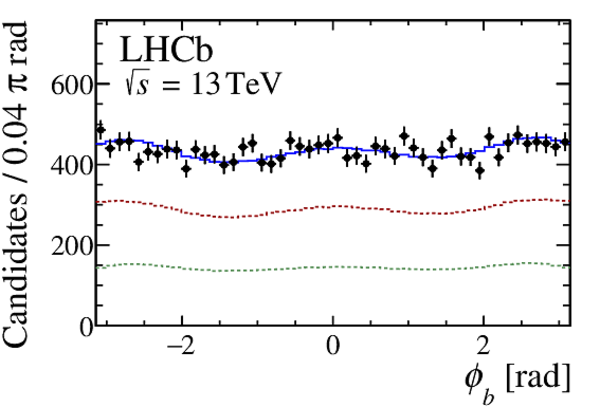
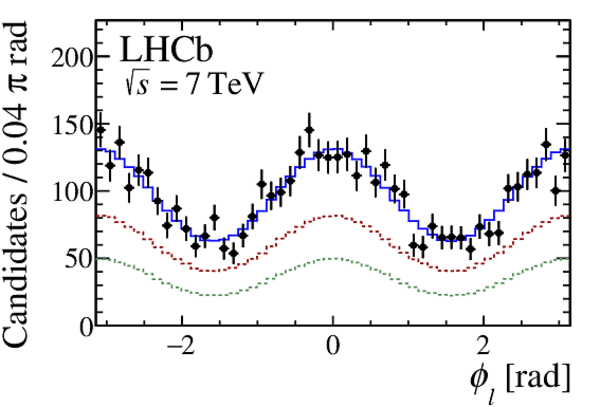
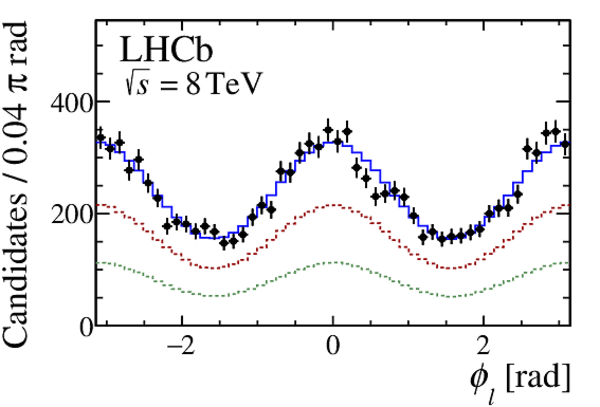
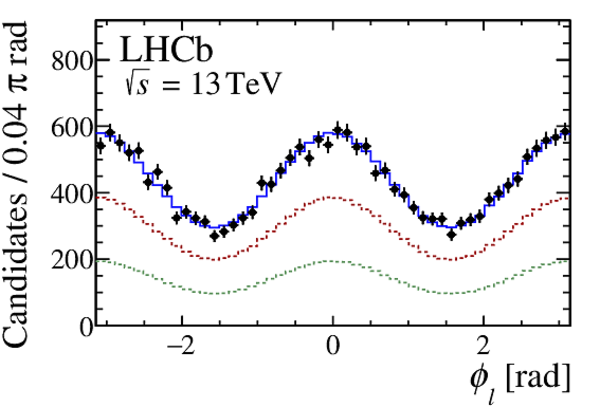
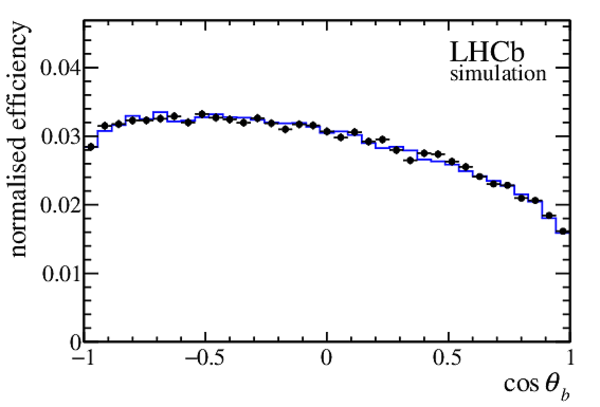
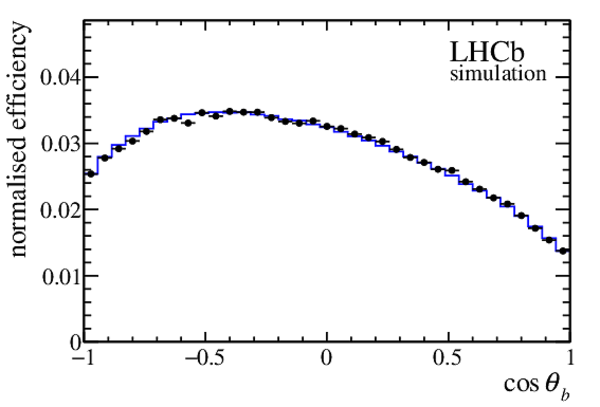
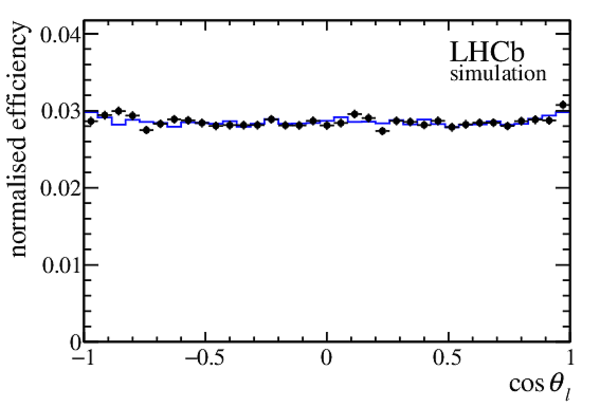
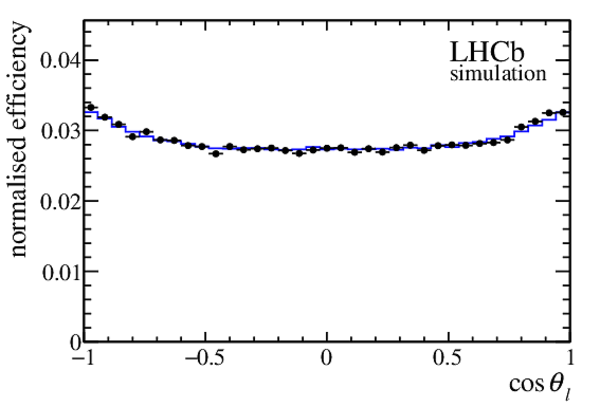
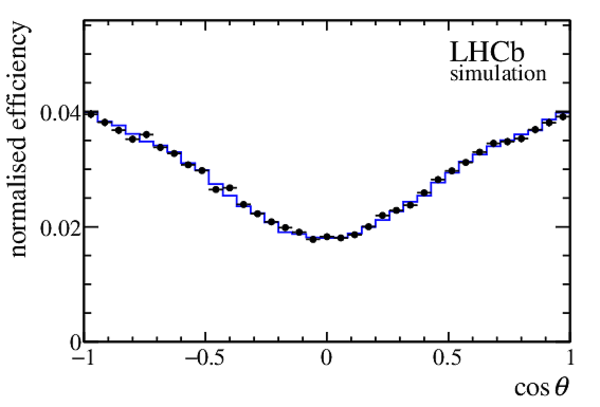
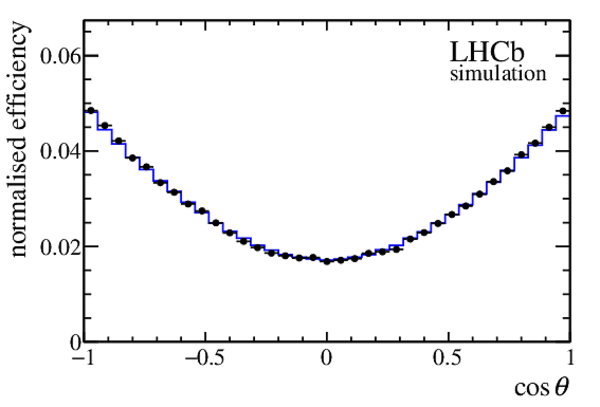
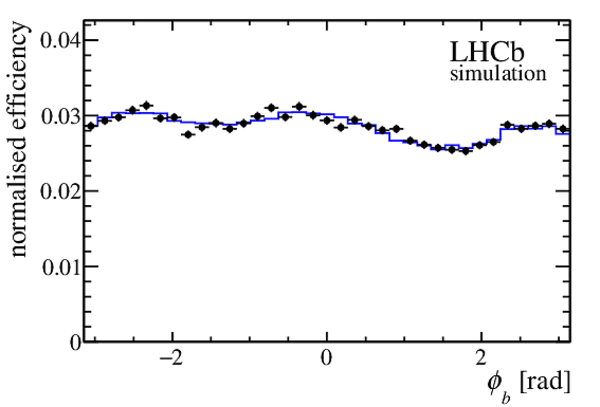
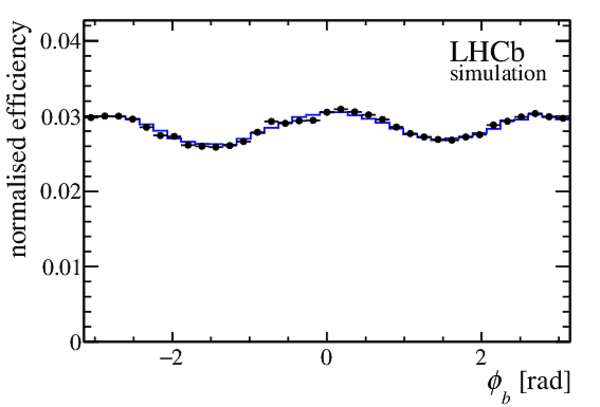
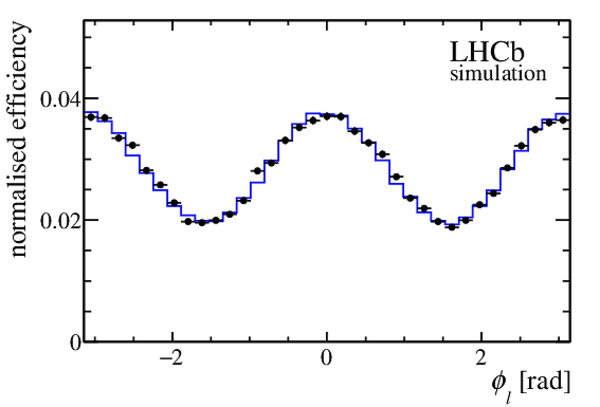
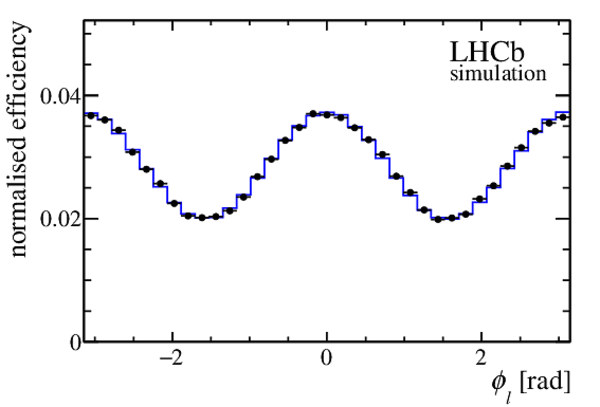
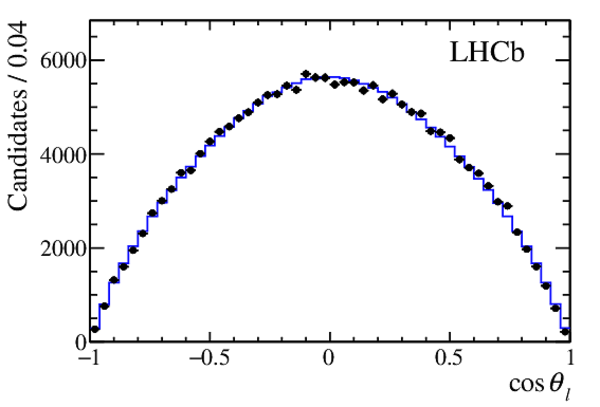
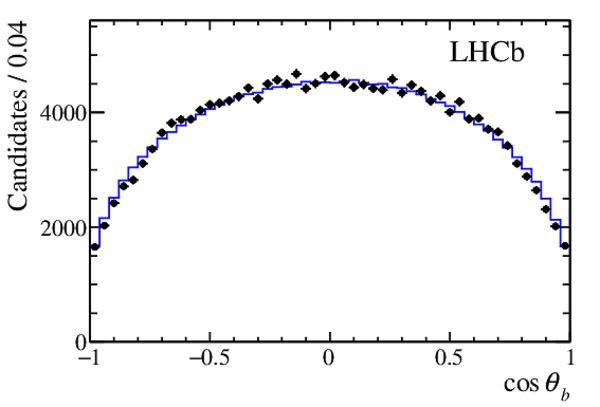
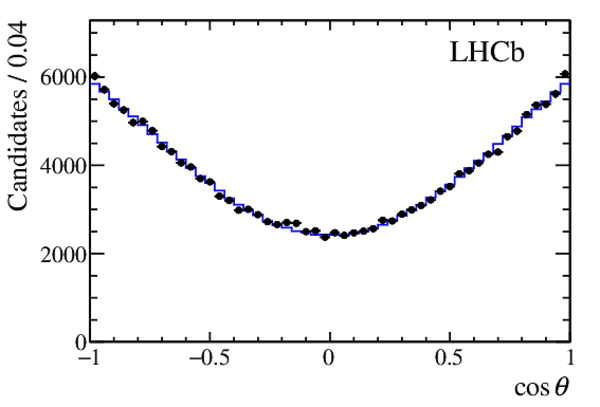
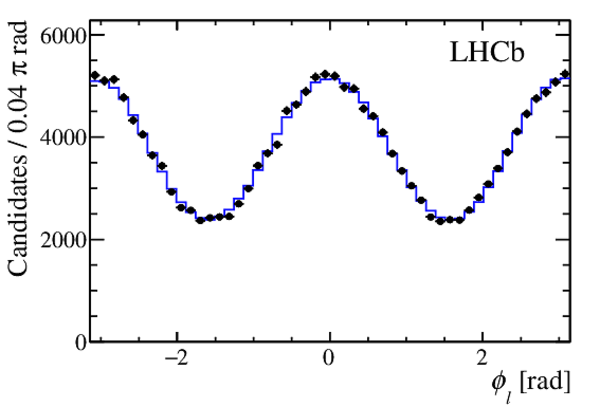
Angular distributions of $\cos\theta_b$, $\cos\theta_l$, $\cos\theta$, $\phi_b$ and $\phi_l$ for the background-subtracted candidates. The long and downstream categories for the different data-taking years have been combined. The result of the moment analysis, folded with the angular efficiency, is overlaid. The contribution from the long and downstream categories are indicated by the green and red lines, respectively. |
Fig3a.pdf [18 KiB] HiDef png [212 KiB] Thumbnail [195 KiB] *.C file |
|
|
Fig3b.pdf [18 KiB] HiDef png [216 KiB] Thumbnail [198 KiB] *.C file |
|
|
|
Fig3c.pdf [18 KiB] HiDef png [211 KiB] Thumbnail [191 KiB] *.C file |

|
|
|
Fig3d.pdf [18 KiB] HiDef png [181 KiB] Thumbnail [169 KiB] *.C file |
|
|
|
Fig3e.pdf [18 KiB] HiDef png [181 KiB] Thumbnail [169 KiB] *.C file |
|
|
|
Fig3f.pdf [18 KiB] HiDef png [181 KiB] Thumbnail [166 KiB] *.C file |
|
|
|
Fig3g.pdf [18 KiB] HiDef png [180 KiB] Thumbnail [164 KiB] *.C file |
|
|
|
Fig3h.pdf [18 KiB] HiDef png [183 KiB] Thumbnail [163 KiB] *.C file |
|
|
|
Fig3i.pdf [18 KiB] HiDef png [178 KiB] Thumbnail [155 KiB] *.C file |
|
|
|
Fig3j.pdf [18 KiB] HiDef png [175 KiB] Thumbnail [161 KiB] *.C file |
|
|
|
Fig3k.pdf [18 KiB] HiDef png [183 KiB] Thumbnail [170 KiB] *.C file |
|
|
|
Fig3l.pdf [18 KiB] HiDef png [179 KiB] Thumbnail [159 KiB] *.C file |
|
|
|
Fig3m.pdf [18 KiB] HiDef png [197 KiB] Thumbnail [181 KiB] *.C file |
|
|
|
Fig3n.pdf [18 KiB] HiDef png [187 KiB] Thumbnail [166 KiB] *.C file |
|
|
|
Fig3o.pdf [18 KiB] HiDef png [198 KiB] Thumbnail [175 KiB] *.C file |
|
|
|
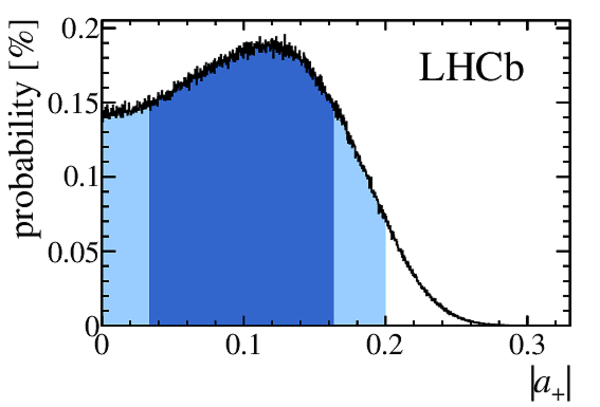
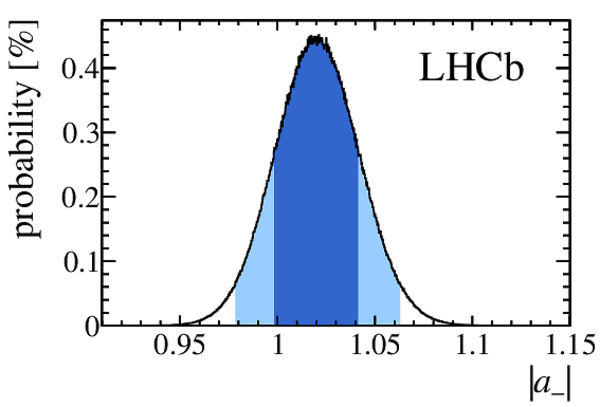
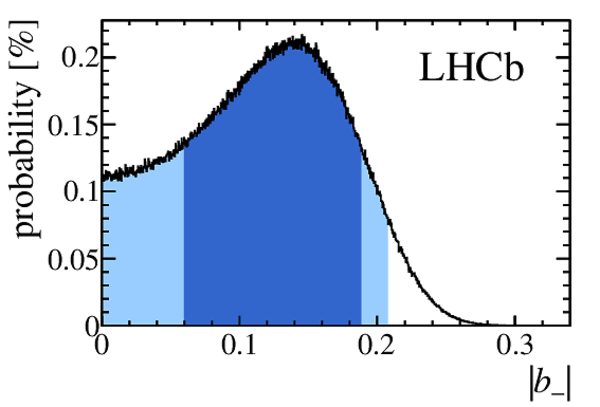
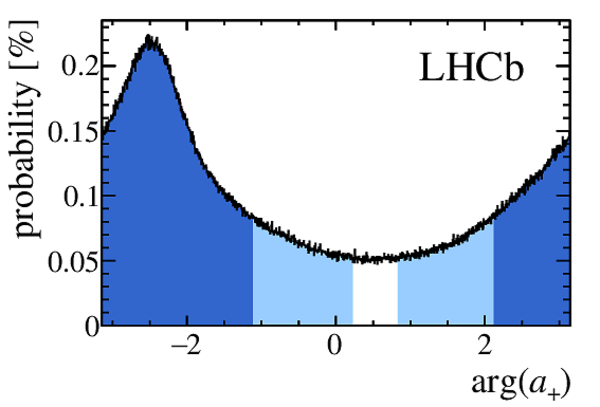
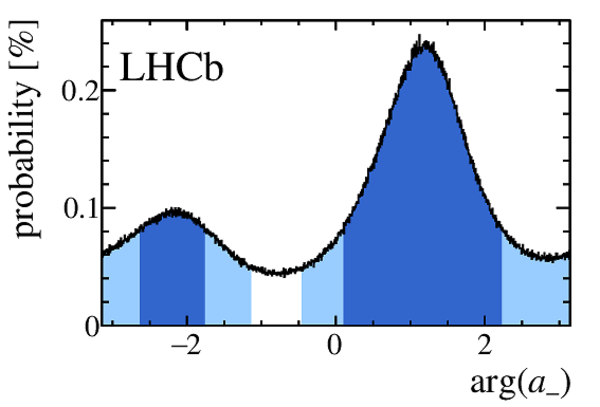
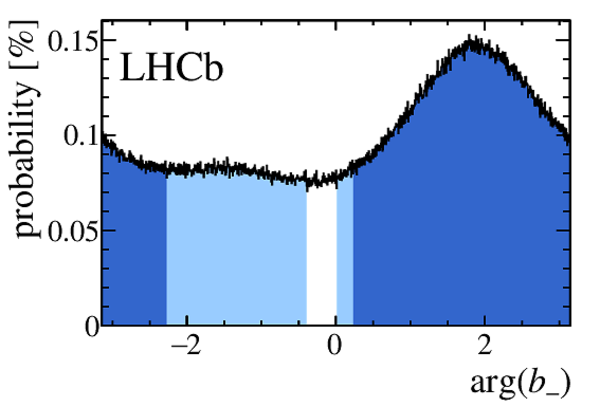
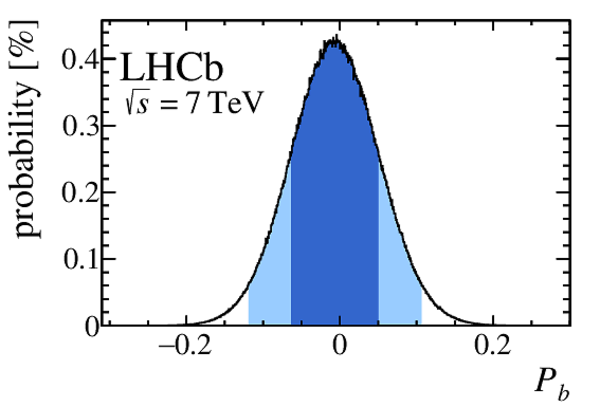
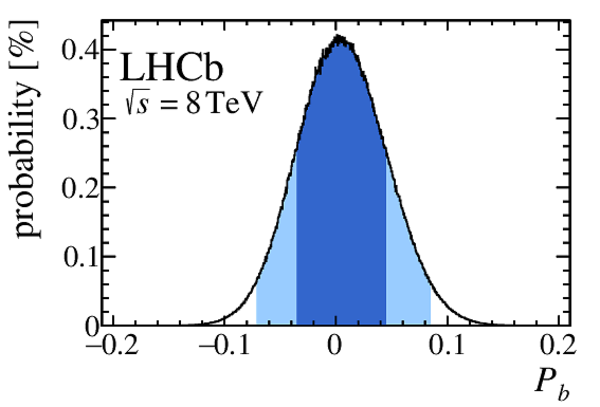
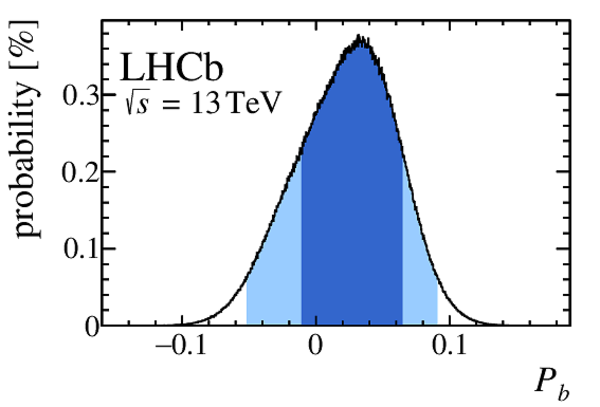
Posterior probability distributions of $|a_{\pm}|$, ${\rm arg}(a_{\pm})$, $|b_{-}|$, ${\rm arg}(b_{-})$ and the transverse production polarisation of the $\Lambda ^0_ b $ baryons, $P_{b}$, at centre-of-mass energies of 7, 8 and 13 $\text{ Te V}$ assuming uniform priors. The shaded regions indicate the 68% and 95% credibility intervals. |
Fig4a.pdf [34 KiB] HiDef png [133 KiB] Thumbnail [120 KiB] *.C file |
|
|
Fig4b.pdf [32 KiB] HiDef png [124 KiB] Thumbnail [115 KiB] *.C file |
|
|
|
Fig4c.pdf [34 KiB] HiDef png [132 KiB] Thumbnail [119 KiB] *.C file |
|
|
|
Fig4d.pdf [36 KiB] HiDef png [146 KiB] Thumbnail [130 KiB] *.C file |
|
|
|
Fig4e.pdf [35 KiB] HiDef png [130 KiB] Thumbnail [112 KiB] *.C file |
|
|
|
Fig4f.pdf [36 KiB] HiDef png [142 KiB] Thumbnail [123 KiB] *.C file |
|
|
|
Fig4g.pdf [32 KiB] HiDef png [125 KiB] Thumbnail [114 KiB] *.C file |
|
|
|
Fig4h.pdf [32 KiB] HiDef png [133 KiB] Thumbnail [122 KiB] *.C file |
|
|
|
Fig4i.pdf [32 KiB] HiDef png [123 KiB] Thumbnail [113 KiB] *.C file |
|
|
|
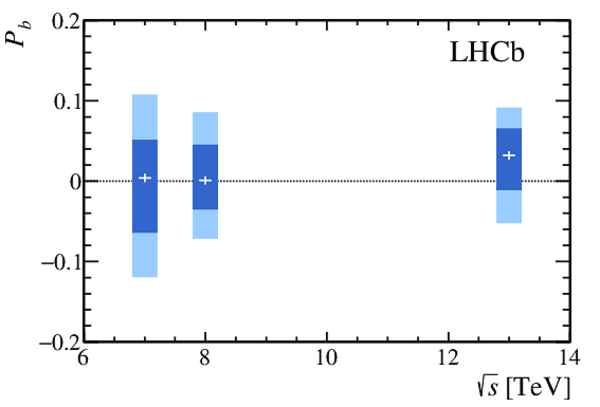
Measured transverse production polarisation of the $\Lambda ^0_ b $ baryons, $P_{b}$, as a function of the centre-of-mass energy, $\sqrt{s}$, of the data set. The points indicate the most probable value and the shaded regions the 68% and 95% credibility level intervals. |
Fig5.pdf [13 KiB] HiDef png [77 KiB] Thumbnail [72 KiB] *.C file |
|
|
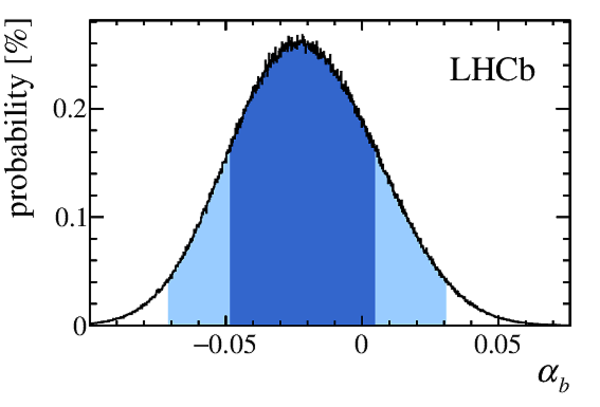
Posterior probability distribution of the parity-violating asymmetry parameter, $\alpha_b$. The shaded regions indicate the 68% and 95% credibility intervals. |
Fig6.pdf [34 KiB] HiDef png [121 KiB] Thumbnail [104 KiB] *.C file |
|
|
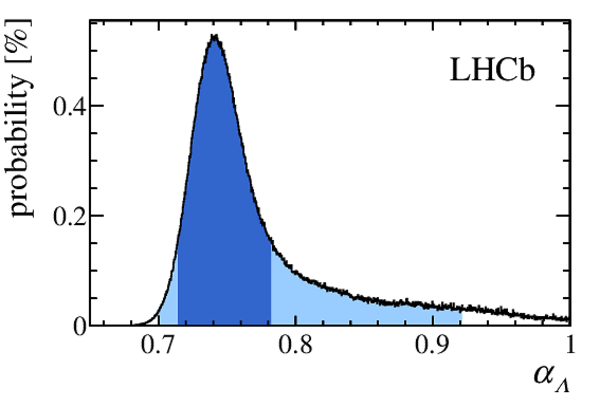
Posterior probability distribution for $\alpha_{\Lambda }$, assuming a uniform prior, with all external constraints removed. The shaded regions indicate the 68% and 95% credibility intervals. |
Fig7.pdf [33 KiB] HiDef png [119 KiB] Thumbnail [102 KiB] *.C file |
|
|
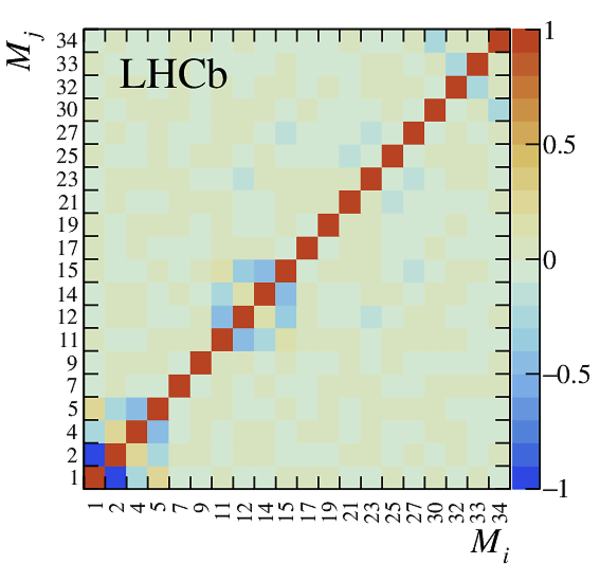
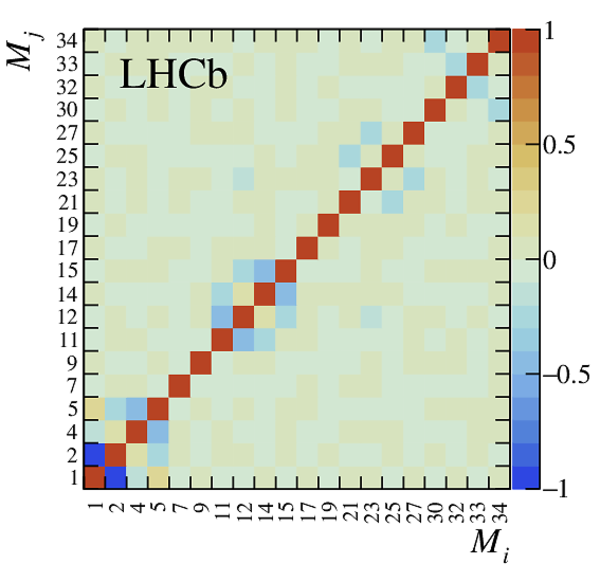
Statistical correlation between the moments determined at $\sqrt{s}$ of 7 $\text{ Te V}$ . |
Fig8.pdf [16 KiB] HiDef png [212 KiB] Thumbnail [188 KiB] *.C file |
|
|
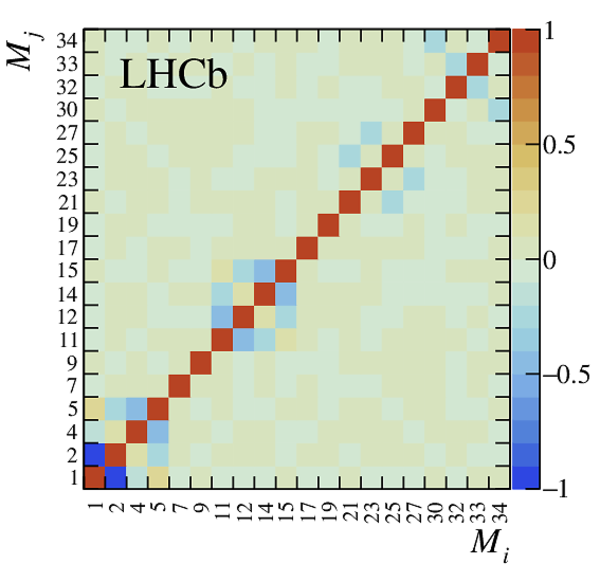
Statistical correlation between the moments determined at $\sqrt{s}$ of 8 $\text{ Te V}$ . |
Fig9.pdf [16 KiB] HiDef png [212 KiB] Thumbnail [188 KiB] *.C file |
|
|
Statistical correlation between the moments determined at $\sqrt{s}$ of 13 $\text{ Te V}$ . |
Fig10.pdf [16 KiB] HiDef png [210 KiB] Thumbnail [188 KiB] *.C file |
|
|
Animated gif made out of all figures. |
PAPER-2020-005.gif Thumbnail |

|
Tables and captions
|
Angular functions parameterising the $\Lambda ^0_ b \rightarrow { J \mskip -3mu/\mskip -2mu\psi \mskip 2mu} \Lambda $ angular distribution. The numbering scheme is the same as in Ref. [37]. |
Table_1.pdf [72 KiB] HiDef png [180 KiB] Thumbnail [82 KiB] tex code |

|
|
Signal yields in the long and downstream categories of the 2011, 2012, 2015 and 2016 data sets. |
Table_2.pdf [38 KiB] HiDef png [31 KiB] Thumbnail [14 KiB] tex code |

|
|
Values of the 20 moments, $M_{i}$, measured in the data collected at 7, 8 and 13 $\text{ Te V}$ centre-of-mass energies. The long and downstream categories have been combined. The first and second uncertainties are statistical and systematic, respectively. |
Table_3.pdf [52 KiB] HiDef png [243 KiB] Thumbnail [114 KiB] tex code |

|
|
Systematic uncertainties on the angular moments. The largest value amongst the moments is given for each source. The total systematic uncertainty varies from 0.002 to 0.010, depending on the moment considered. The sources are described in the text. |
Table_4.pdf [42 KiB] HiDef png [101 KiB] Thumbnail [45 KiB] tex code |

|
|
Estimates for the magnitude and phase of the decay amplitudes and the transverse production polarisation of the $\Lambda ^0_ b $ baryons, extracted using the Bayesian analysis. The most probable value (MPV) and the shortest 68% interval containing the most probable value are given. |
Table_5.pdf [69 KiB] HiDef png [101 KiB] Thumbnail [49 KiB] tex code |

|
|
Intervals at 95% credibility level on the amplitudes, the polarisation and $\alpha_{b}$ from the Bayesian analysis. The interval on $\alpha_{\Lambda }$, with the external constraint removed, is also provided. |
Table_6.pdf [69 KiB] HiDef png [139 KiB] Thumbnail [65 KiB] tex code |

|
Supplementary Material [file]


![HiDef png [151 KiB]](Directory_LHCb-PAPER-2020-005/hidef_Fig1.png)
![HiDef png [199 KiB]](Directory_LHCb-PAPER-2020-005/hidef_Fig2a.png)
![HiDef png [170 KiB]](Directory_LHCb-PAPER-2020-005/hidef_Fig2b.png)
![HiDef png [178 KiB]](Directory_LHCb-PAPER-2020-005/hidef_Fig2c.png)
![HiDef png [167 KiB]](Directory_LHCb-PAPER-2020-005/hidef_Fig2d.png)
![HiDef png [212 KiB]](Directory_LHCb-PAPER-2020-005/hidef_Fig3a.png)
![HiDef png [216 KiB]](Directory_LHCb-PAPER-2020-005/hidef_Fig3b.png)
![HiDef png [211 KiB]](Directory_LHCb-PAPER-2020-005/hidef_Fig3c.png)
![HiDef png [181 KiB]](Directory_LHCb-PAPER-2020-005/hidef_Fig3d.png)
![HiDef png [181 KiB]](Directory_LHCb-PAPER-2020-005/hidef_Fig3e.png)
![HiDef png [181 KiB]](Directory_LHCb-PAPER-2020-005/hidef_Fig3f.png)
![HiDef png [180 KiB]](Directory_LHCb-PAPER-2020-005/hidef_Fig3g.png)
![HiDef png [183 KiB]](Directory_LHCb-PAPER-2020-005/hidef_Fig3h.png)
![HiDef png [178 KiB]](Directory_LHCb-PAPER-2020-005/hidef_Fig3i.png)
![HiDef png [175 KiB]](Directory_LHCb-PAPER-2020-005/hidef_Fig3j.png)
![HiDef png [183 KiB]](Directory_LHCb-PAPER-2020-005/hidef_Fig3k.png)
![HiDef png [179 KiB]](Directory_LHCb-PAPER-2020-005/hidef_Fig3l.png)
![HiDef png [197 KiB]](Directory_LHCb-PAPER-2020-005/hidef_Fig3m.png)
![HiDef png [187 KiB]](Directory_LHCb-PAPER-2020-005/hidef_Fig3n.png)
![HiDef png [198 KiB]](Directory_LHCb-PAPER-2020-005/hidef_Fig3o.png)
![HiDef png [133 KiB]](Directory_LHCb-PAPER-2020-005/hidef_Fig4a.png)
![HiDef png [124 KiB]](Directory_LHCb-PAPER-2020-005/hidef_Fig4b.png)
![HiDef png [132 KiB]](Directory_LHCb-PAPER-2020-005/hidef_Fig4c.png)
![HiDef png [146 KiB]](Directory_LHCb-PAPER-2020-005/hidef_Fig4d.png)
![HiDef png [130 KiB]](Directory_LHCb-PAPER-2020-005/hidef_Fig4e.png)
![HiDef png [142 KiB]](Directory_LHCb-PAPER-2020-005/hidef_Fig4f.png)
![HiDef png [125 KiB]](Directory_LHCb-PAPER-2020-005/hidef_Fig4g.png)
![HiDef png [133 KiB]](Directory_LHCb-PAPER-2020-005/hidef_Fig4h.png)
![HiDef png [123 KiB]](Directory_LHCb-PAPER-2020-005/hidef_Fig4i.png)
![HiDef png [77 KiB]](Directory_LHCb-PAPER-2020-005/hidef_Fig5.png)
![HiDef png [121 KiB]](Directory_LHCb-PAPER-2020-005/hidef_Fig6.png)
![HiDef png [119 KiB]](Directory_LHCb-PAPER-2020-005/hidef_Fig7.png)
![HiDef png [212 KiB]](Directory_LHCb-PAPER-2020-005/hidef_Fig8.png)
![HiDef png [212 KiB]](Directory_LHCb-PAPER-2020-005/hidef_Fig9.png)
![HiDef png [210 KiB]](Directory_LHCb-PAPER-2020-005/hidef_Fig10.png)
![HiDef png [180 KiB]](Directory_LHCb-PAPER-2020-005/hidef_Table_1.png)
![HiDef png [31 KiB]](Directory_LHCb-PAPER-2020-005/hidef_Table_2.png)
![HiDef png [243 KiB]](Directory_LHCb-PAPER-2020-005/hidef_Table_3.png)
![HiDef png [101 KiB]](Directory_LHCb-PAPER-2020-005/hidef_Table_4.png)
![HiDef png [101 KiB]](Directory_LHCb-PAPER-2020-005/hidef_Table_5.png)
![HiDef png [139 KiB]](Directory_LHCb-PAPER-2020-005/hidef_Table_6.png)
![HiDef png [115 KiB]](Directory_LHCb-PAPER-2020-005/supplementary/hidef_Fig1a-supp.png)
![HiDef png [115 KiB]](Directory_LHCb-PAPER-2020-005/supplementary/hidef_Fig1b-supp.png)
![HiDef png [113 KiB]](Directory_LHCb-PAPER-2020-005/supplementary/hidef_Fig1c-supp.png)
![HiDef png [111 KiB]](Directory_LHCb-PAPER-2020-005/supplementary/hidef_Fig1d-supp.png)
![HiDef png [107 KiB]](Directory_LHCb-PAPER-2020-005/supplementary/hidef_Fig1e-supp.png)
![HiDef png [110 KiB]](Directory_LHCb-PAPER-2020-005/supplementary/hidef_Fig1f-supp.png)
![HiDef png [110 KiB]](Directory_LHCb-PAPER-2020-005/supplementary/hidef_Fig1g-supp.png)
![HiDef png [107 KiB]](Directory_LHCb-PAPER-2020-005/supplementary/hidef_Fig1h-supp.png)
![HiDef png [104 KiB]](Directory_LHCb-PAPER-2020-005/supplementary/hidef_Fig1i-supp.png)
![HiDef png [103 KiB]](Directory_LHCb-PAPER-2020-005/supplementary/hidef_Fig1j-supp.png)
![HiDef png [132 KiB]](Directory_LHCb-PAPER-2020-005/supplementary/hidef_Fig2a-supp.png)
![HiDef png [115 KiB]](Directory_LHCb-PAPER-2020-005/supplementary/hidef_Fig2b-supp.png)
![HiDef png [109 KiB]](Directory_LHCb-PAPER-2020-005/supplementary/hidef_Fig2c-supp.png)
![HiDef png [112 KiB]](Directory_LHCb-PAPER-2020-005/supplementary/hidef_Fig2d-supp.png)
![HiDef png [116 KiB]](Directory_LHCb-PAPER-2020-005/supplementary/hidef_Fig2e-supp.png)
![HiDef png [119 KiB]](Directory_LHCb-PAPER-2020-005/supplementary/hidef_Fig2f-supp.png)
![HiDef png [95 KiB]](Directory_LHCb-PAPER-2020-005/supplementary/hidef_Fig3a-supp.png)
![HiDef png [96 KiB]](Directory_LHCb-PAPER-2020-005/supplementary/hidef_Fig3b-supp.png)
Created on 12 April 2024.