Measurement of the branching fractions for $B^+\to D^{*+}D^-K^+$, $B^+\to D^{*-}D^+K^+$, and $B^0\to D^{*-}D^0K^+$ decays
[to restricted-access page]Information
LHCb-PAPER-2020-006
CERN-EP-2020-056
arXiv:2005.10264 [PDF]
(Submitted on 20 May 2020)
JHEP 12 (2020) 139
Inspire 1797220
Tools
Abstract
A measurement of four branching-fraction ratios for three-body decays of $B$ mesons involving two open-charm hadrons in the final state is presented. Run 1 and Run 2 $pp$ collision data are used, recorded by the LHCb experiment at centre-of-mass energies $7$, $8$, and $13$ TeV and corresponding to an integrated luminosity of $9$ fb$^{-1}$. The measured branching-fraction ratios are \[ \begin{eqnarray} \frac{\mathcal{B} (B^+\to D^{*+}D^-K^+)}{\mathcal{B} (B^+\to \overline{ D}{}^0 D^0 K^+)} &=& 0.517 \pm 0.015 \pm 0.013 \pm 0.011 , \\ \frac{\mathcal{B} (B^+\to D^{*-}D^+K^+)}{\mathcal{B} (B^+\to \overline{ D}{}^0 D^0 K^+)} &=& 0.577 \pm 0.016 \pm 0.013 \pm 0.013 , \\ \frac{\mathcal{B} (B^0\to D^{*-}D^0K^+)}{\mathcal{B} (B^0\to D^- D^0 K^+)} &=& 1.754 \pm 0.028 \pm 0.016 \pm 0.035 , \\ \frac{\mathcal{B} (B^+\to D^{*+}D^-K^+)}{\mathcal{B} (B^+\to D^{*-}D^+K^+)} &=& 0.907 \pm 0.033 \pm 0.014 ,\end{eqnarray} \] where the first of the uncertainties is statistical, the second systematic, and the third is due to the uncertainties on the $D$-meson branching fractions. These are the most accurate measurements of these ratios to date.
Figures and captions
|
Top left: internal $ W $ -emission diagram for the decays $ B ^+ \rightarrow D ^{*-} D ^+ K ^+ $ and $ B ^+ \rightarrow D ^{*+} D ^- K ^+ $ . Top right: external $ W $ -emission diagram for the decays $ B ^0 \rightarrow D ^{*-} D ^0 K ^+ $ and $ B ^0 \rightarrow D ^- D ^0 K ^+ $ . Bottom row: (left) external and (right) internal $ W $ -emission diagrams contributing to the $ B ^+ \rightarrow \overline{ D }{} {}^0 D ^0 K ^+ $ decay. |
Fig1.pdf [2 MiB] HiDef png [59 KiB] Thumbnail [30 KiB] *.C file |

|
|
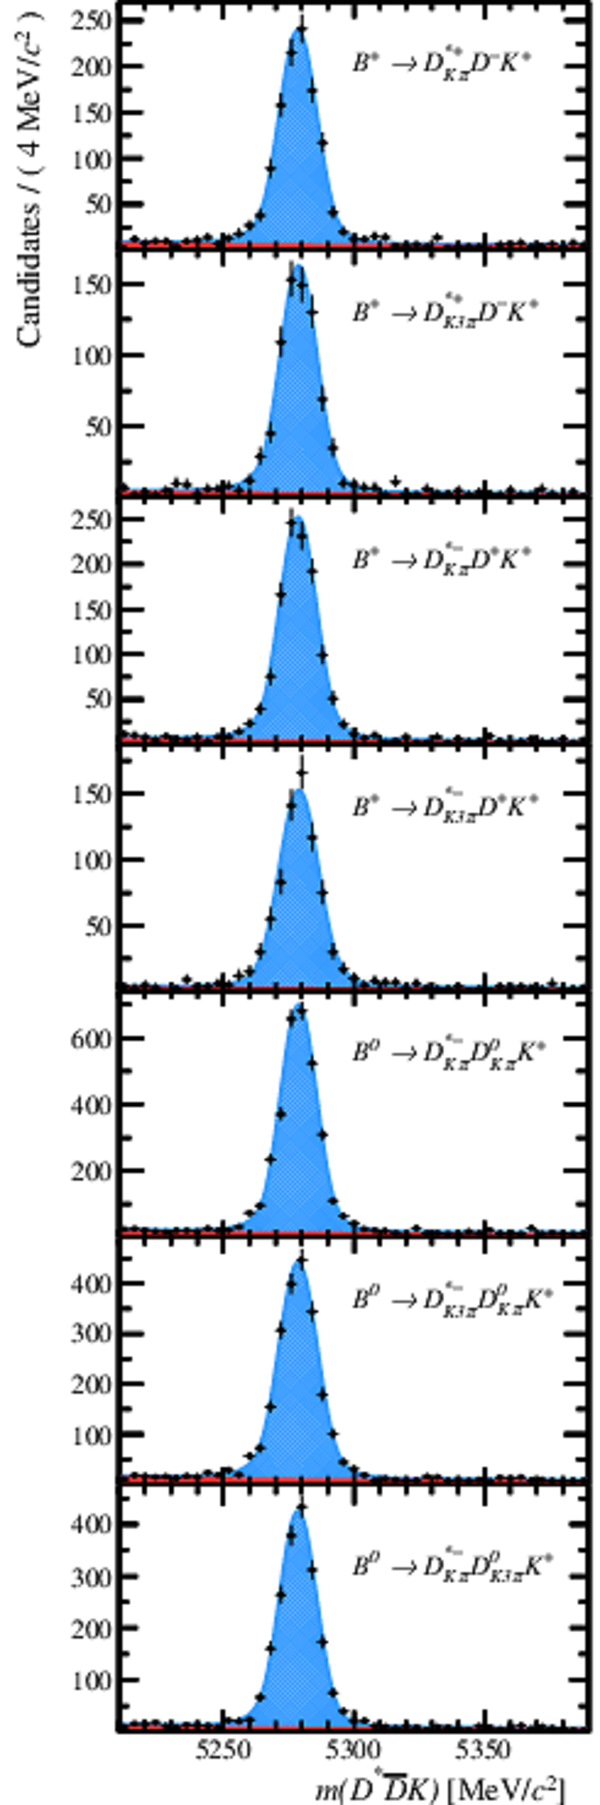
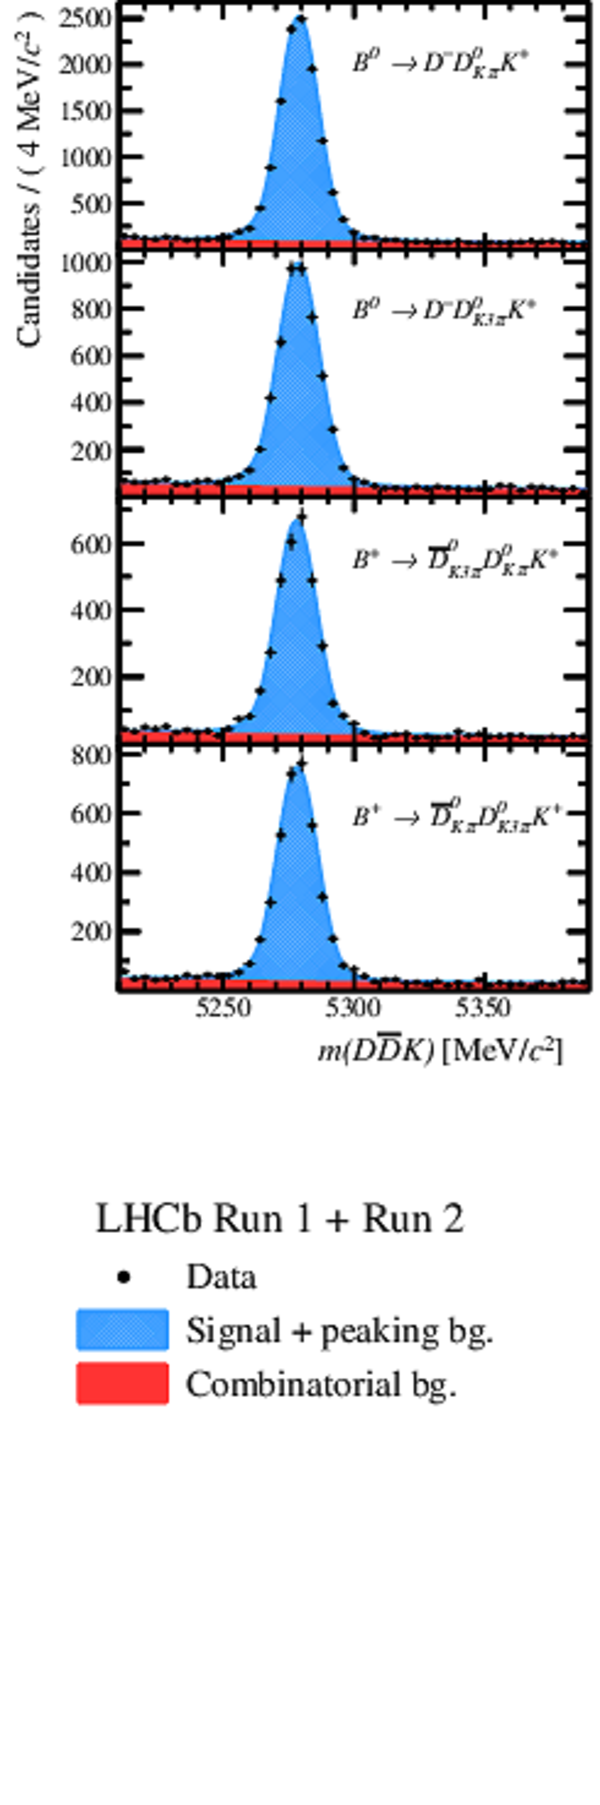
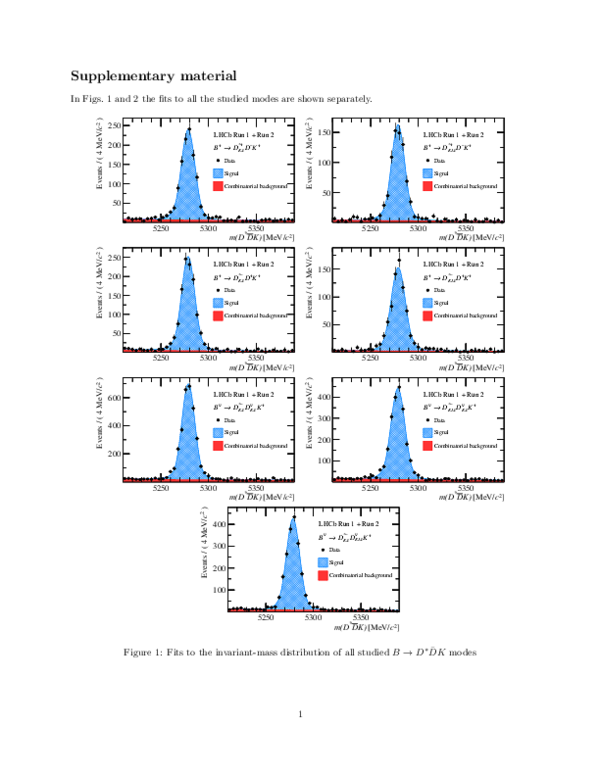
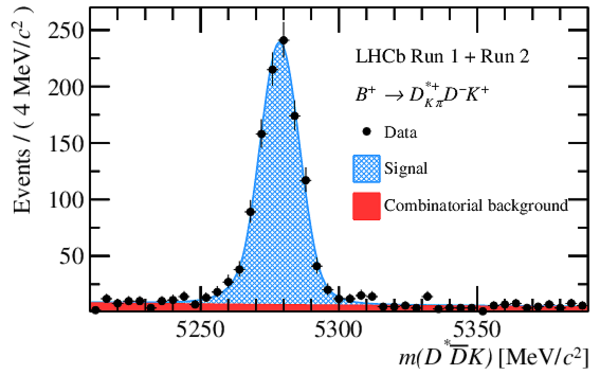
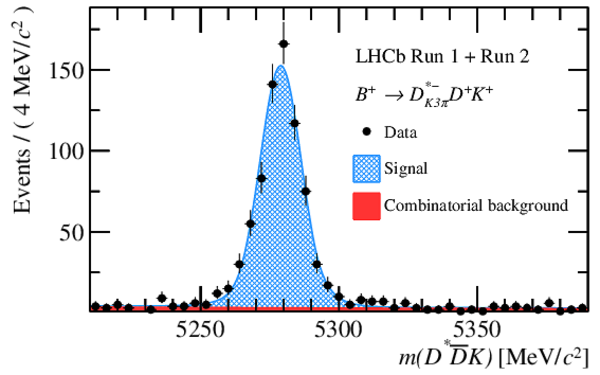
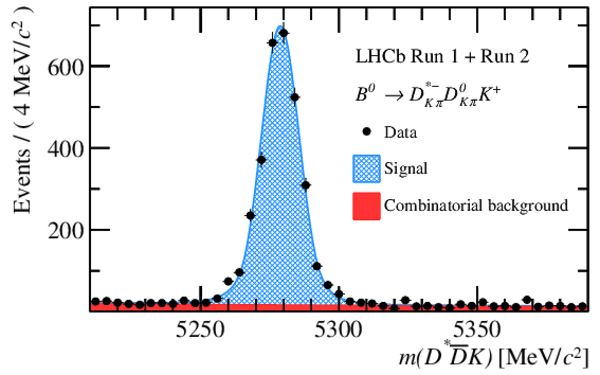
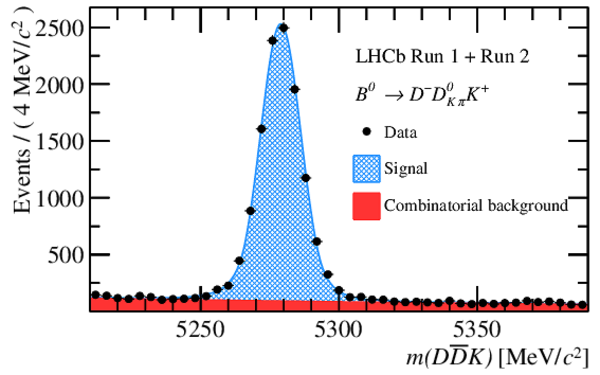
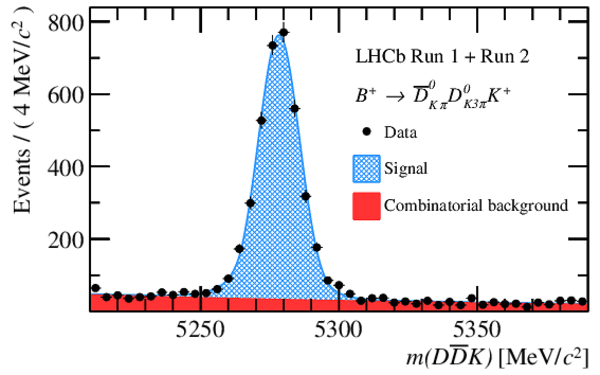
Fits to the invariant-mass distributions $m( D ^{(*)} \overline{ D }{} K )$ of (left) $ B \rightarrow D ^* \overline{ D }{} K $ and (right) $ B \rightarrow D \overline{ D }{} K $ for the combined Run 1 and Run 2 samples. The stacked components are (red) combinatorial background and (blue) signal shape. |
Fig2a.pdf [61 KiB] HiDef png [2 MiB] Thumbnail [1 MiB] *.C file |
|
|
Fig2b.pdf [42 KiB] HiDef png [1 MiB] Thumbnail [985 KiB] *.C file |
|
|
|
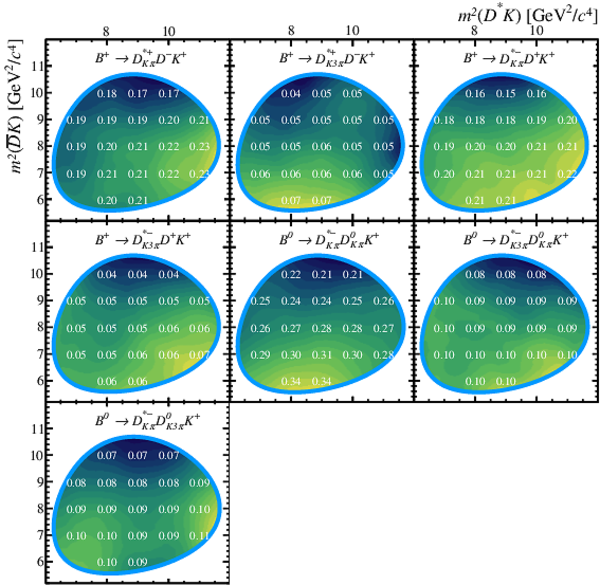
Selection and reconstruction efficiency, $\varepsilon^{\mathrm{sel}}$, as a function of position in the two-body squared invariant-mass plane for the seven $ B \rightarrow D ^* \overline{ D }{} K $ modes, obtained using Run 1 simulated samples. A KDE smoothing has been applied. The blue lines indicate the kinematic boundaries and the numbers indicate the value of the efficiency at several points in the phase space. |
Fig3.pdf [967 KiB] HiDef png [1 MiB] Thumbnail [739 KiB] *.C file |
|
|
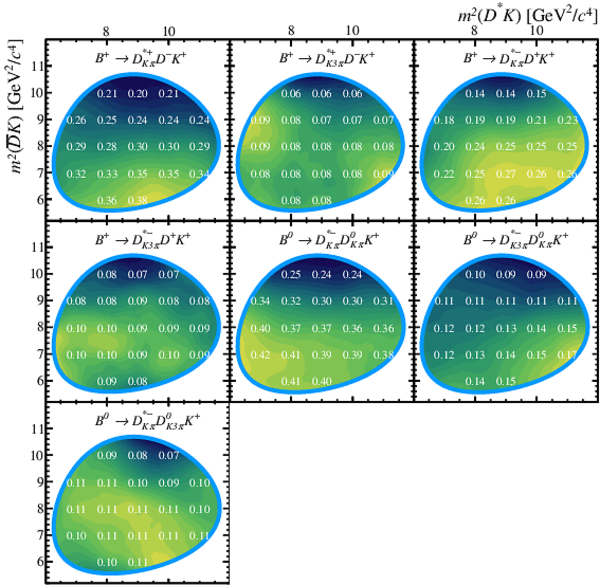
Selection and reconstruction efficiency, $\varepsilon^{\mathrm{sel}}$, as a function of position in the two-body squared invariant-mass plane for the seven $ B \rightarrow D ^* \overline{ D }{} K $ modes, obtained using Run 2 simulated samples. A KDE smoothing has been applied. The blue lines indicate the kinematic boundaries and the numbers indicate the values of the efficiency at several points in the phase space. |
Fig4.pdf [968 KiB] HiDef png [1 MiB] Thumbnail [747 KiB] *.C file |
|
|
Animated gif made out of all figures. |
PAPER-2020-006.gif Thumbnail |

|
Tables and captions
|
Decays under study. In the first column no assumption about the $ D $ final state is made. In the second column, however, the particular $ D $ decays are specified. |
Table_1.pdf [66 KiB] HiDef png [139 KiB] Thumbnail [65 KiB] tex code |

|
|
Table of all signal yields $N$ and efficiency and $ D $ -meson branching fraction corrected yields $ N^{\mathrm{corr}}$ with the residual peaking background subtracted. The values of corrected yields are rounded to the order of $10^6$. The uncertainties are statistical only. |
Table_2.pdf [69 KiB] HiDef png [139 KiB] Thumbnail [68 KiB] tex code |

|
|
Systematic uncertainties on $ N^{\mathrm{corr}}$ from the signal PDF parameters ($\sigma_{\mathrm{PDF}}$), the finite simulation samples ($\sigma_{\mathrm{MC}}$), the PID resampling ($\sigma_{\mathrm{PID}}$), the residual peaking background ($\sigma_{\mathrm{bkg}}$), and the total systematic uncertainty ($\sigma_{\mathrm{tot.}}$). All values are given as a percentage of the central value of $ N^{\mathrm{corr}}$ . |
Table_3.pdf [71 KiB] HiDef png [101 KiB] Thumbnail [47 KiB] tex code |

|
Supplementary Material [file]


![HiDef png [59 KiB]](Directory_LHCb-PAPER-2020-006/hidef_Fig1.png)
![HiDef png [2 MiB]](Directory_LHCb-PAPER-2020-006/hidef_Fig2a.png)
![HiDef png [1 MiB]](Directory_LHCb-PAPER-2020-006/hidef_Fig2b.png)
![HiDef png [1 MiB]](Directory_LHCb-PAPER-2020-006/hidef_Fig3.png)
![HiDef png [1 MiB]](Directory_LHCb-PAPER-2020-006/hidef_Fig4.png)
![HiDef png [139 KiB]](Directory_LHCb-PAPER-2020-006/hidef_Table_1.png)
![HiDef png [139 KiB]](Directory_LHCb-PAPER-2020-006/hidef_Table_2.png)
![HiDef png [101 KiB]](Directory_LHCb-PAPER-2020-006/hidef_Table_3.png)
![HiDef png [406 KiB]](Directory_LHCb-PAPER-2020-006/supplementary/hidef_Fig1a-supp.png)
![HiDef png [410 KiB]](Directory_LHCb-PAPER-2020-006/supplementary/hidef_Fig1b-supp.png)
![HiDef png [408 KiB]](Directory_LHCb-PAPER-2020-006/supplementary/hidef_Fig1c-supp.png)
![HiDef png [385 KiB]](Directory_LHCb-PAPER-2020-006/supplementary/hidef_Fig1d-supp.png)
![HiDef png [405 KiB]](Directory_LHCb-PAPER-2020-006/supplementary/hidef_Fig1e-supp.png)
![HiDef png [414 KiB]](Directory_LHCb-PAPER-2020-006/supplementary/hidef_Fig1f-supp.png)
![HiDef png [400 KiB]](Directory_LHCb-PAPER-2020-006/supplementary/hidef_Fig1g-supp.png)
![HiDef png [424 KiB]](Directory_LHCb-PAPER-2020-006/supplementary/hidef_Fig2a-supp.png)
![HiDef png [435 KiB]](Directory_LHCb-PAPER-2020-006/supplementary/hidef_Fig2b-supp.png)
![HiDef png [414 KiB]](Directory_LHCb-PAPER-2020-006/supplementary/hidef_Fig2c-supp.png)
![HiDef png [419 KiB]](Directory_LHCb-PAPER-2020-006/supplementary/hidef_Fig2d-supp.png)
Created on 26 April 2024.