Observation of enhanced double parton scattering in proton-lead collisions at $\sqrt{s_\mathrm{NN}}=8.16$ TeV
[to restricted-access page]Information
LHCb-PAPER-2020-010
CERN-EP-2020-119
arXiv:2007.06945 [PDF]
(Submitted on 14 Jul 2020)
Phys. Rev. Lett. 125 (2020) 212001
Inspire 1806797
Tools
Abstract
A study of prompt charm-hadron pair production in proton-lead collisions at $\sqrt{s_\mathrm{NN}}= 8.16$ TeV is performed using data corresponding to an integrated luminosity of about 30 nb${}^{-1}$, collected with the LHCb experiment. Production cross-sections for different pairs of charm hadrons are measured and kinematic correlations between the two charm hadrons are investigated. This is the first measurement of associated production of two charm hadrons in proton-lead collisions. The results confirm the predicted enhancement of double parton scattering production in proton-lead collisions compared to the single parton scattering production.
Figures and captions
|
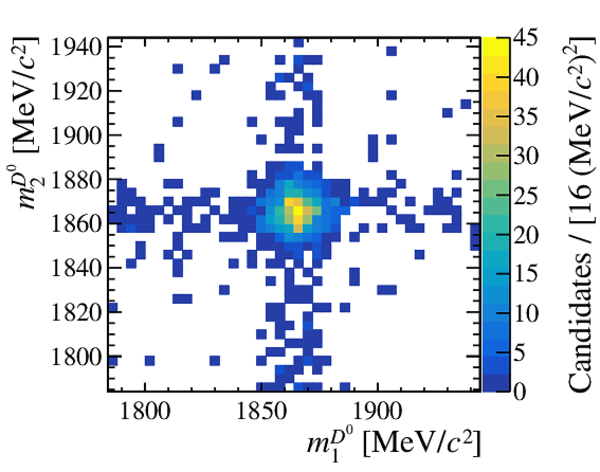
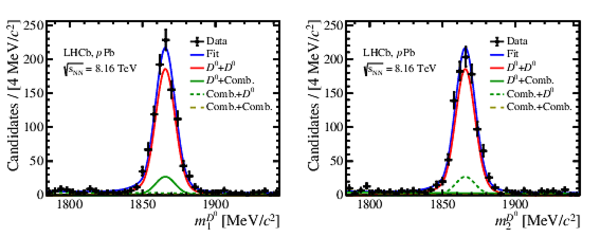
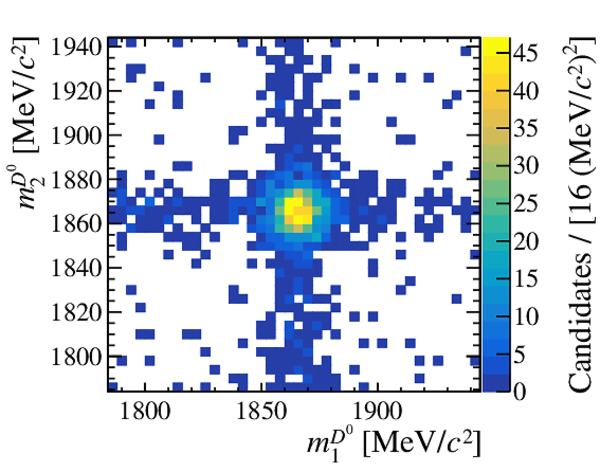
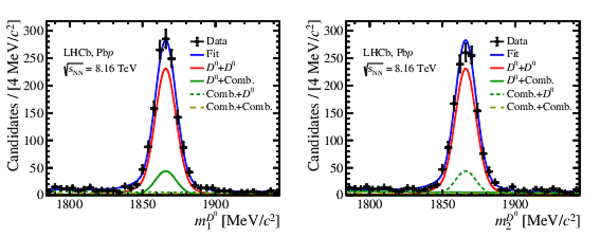
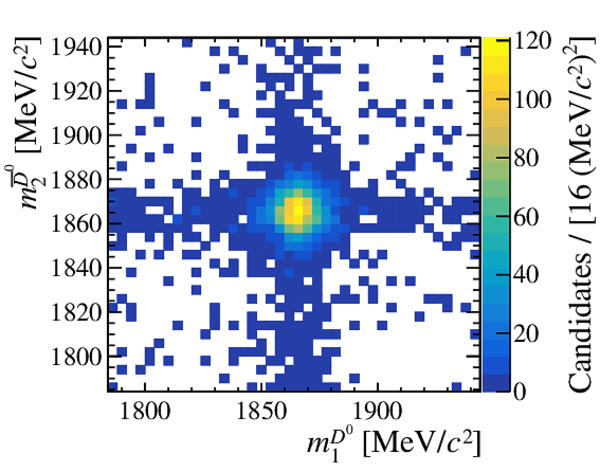
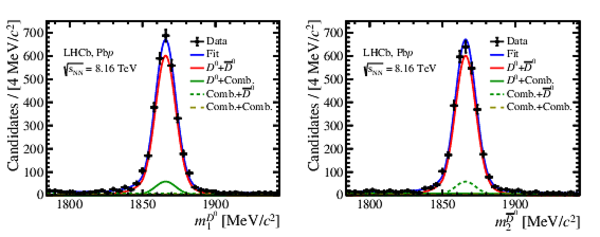
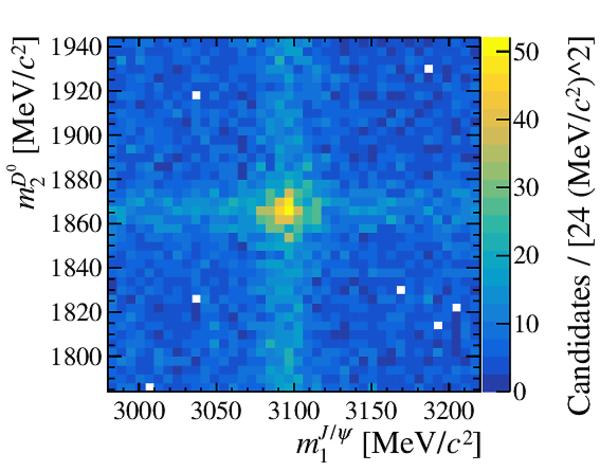
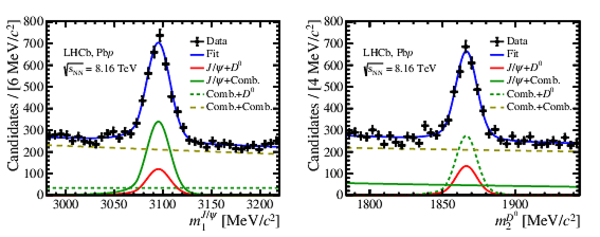
(Left) Two-dimensional invariant-mass distributions of $(m_1, m_2)$ for $ D ^0 D ^0 $ pairs and the projections on (middle) $m_1$ and (right) $m_2$ with the fit results superimposed. Shown in the projection plots are (points with bars) $ p\mathrm{Pb}$ data, (solid blue) the total fit and its four components. |
Fig1a.pdf [15 KiB] HiDef png [236 KiB] Thumbnail [259 KiB] *.C file |
|
|
Fig1b.pdf [31 KiB] HiDef png [227 KiB] Thumbnail [169 KiB] *.C file |
|
|
|
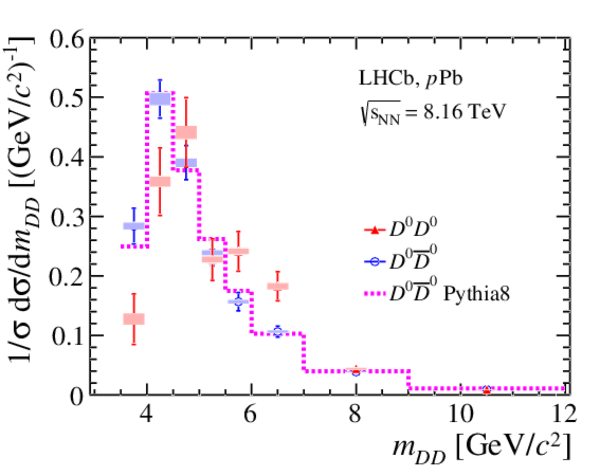
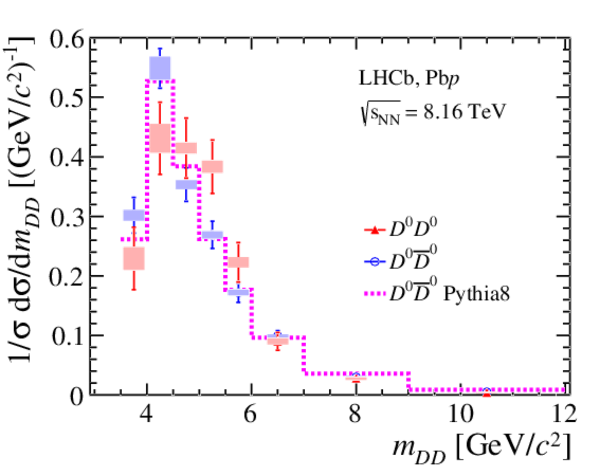
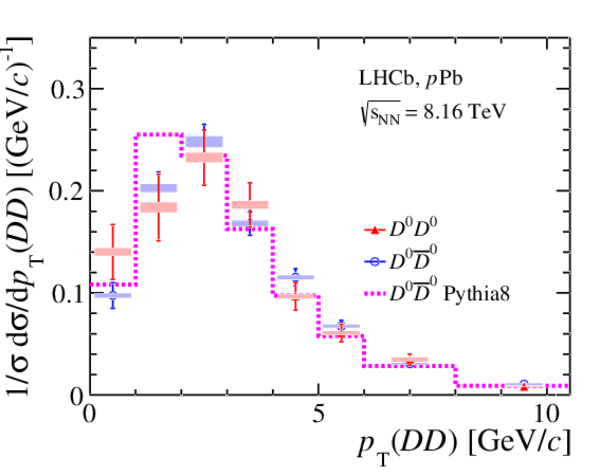
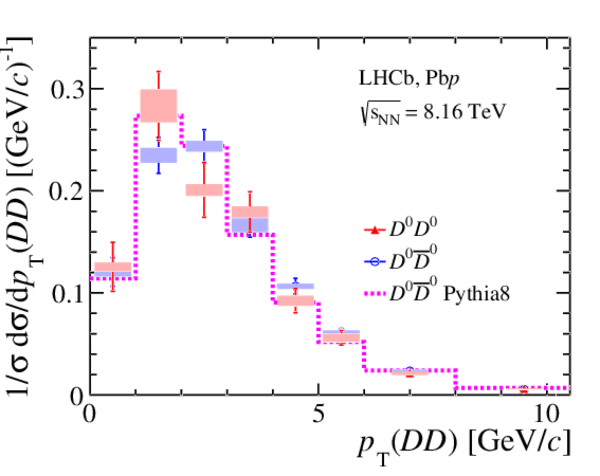
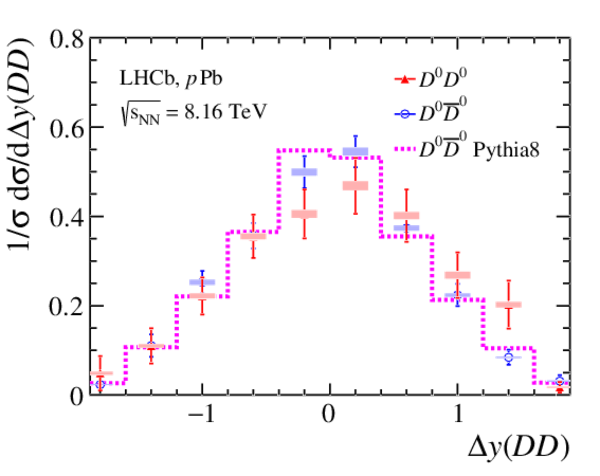
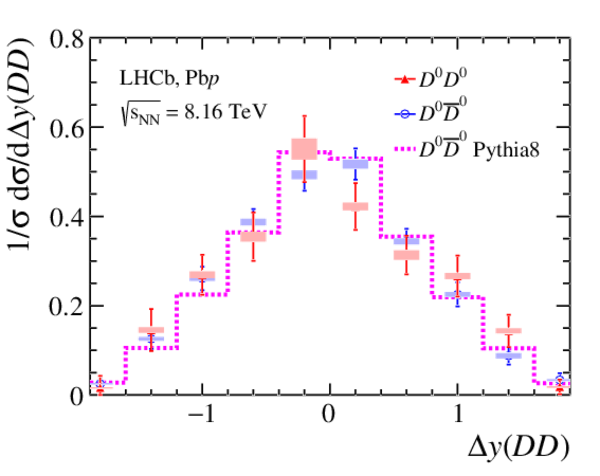
Two-charm hadron invariant-mass distribution of (red) $ D ^0 D ^0 $ and (blue) $ D ^0 \overline{ D } {}^0 $ pairs in (left) $ p\mathrm{Pb}$ , (right) $\mathrm{Pb}p$ data and (magenta dashed line) Pythia8 simulation. Vertical bars (filled box) are statistical (systematic) uncertainties. |
Fig2a.pdf [15 KiB] HiDef png [246 KiB] Thumbnail [190 KiB] *.C file |
|
|
Fig2b.pdf [15 KiB] HiDef png [242 KiB] Thumbnail [189 KiB] *.C file |
|
|
|
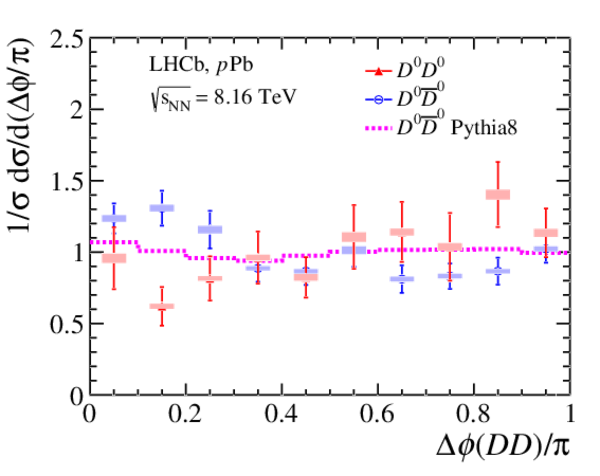
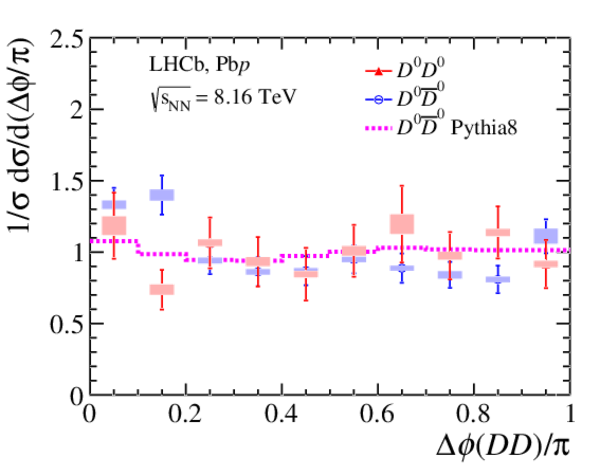
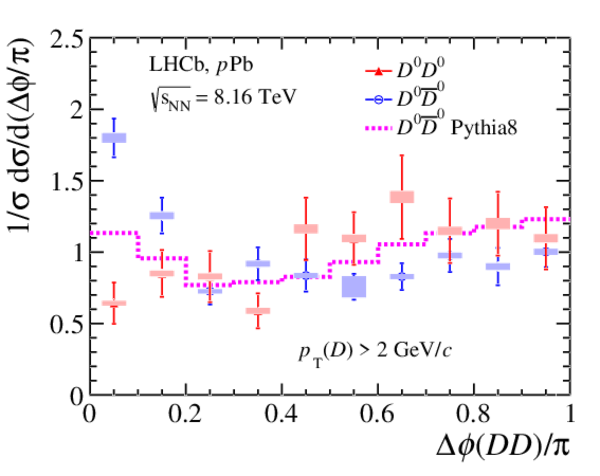
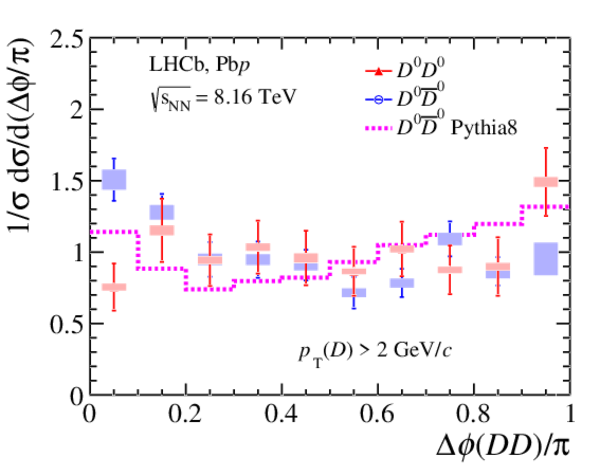
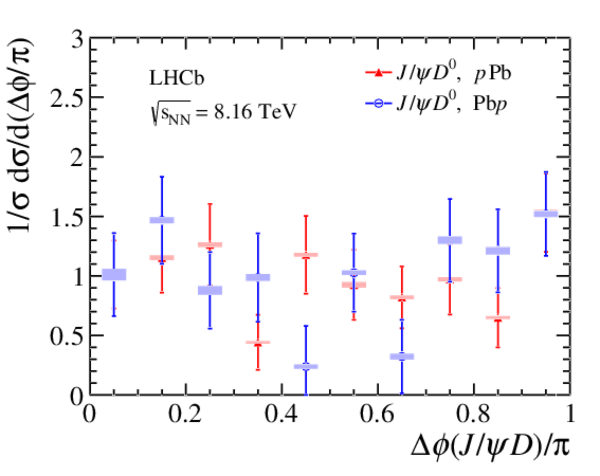
The $\Delta \phi$ distribution for (red) $ D ^0 D ^0 $ and (blue) $ D ^0 \overline{ D } {}^0 $ pairs in (left) $ p\mathrm{Pb}$ , (right) $\mathrm{Pb}p$ data and the (magenta dashed line) Pythia8 simulation, (bottom) with and (top) without the $ p_{\mathrm{T}} ( D ^0 )>2\text{ Ge V /}c $ requirement. Vertical bars (filled box) are statistical (systematic) uncertainties. |
Fig3a.pdf [15 KiB] HiDef png [219 KiB] Thumbnail [171 KiB] *.C file |
|
|
Fig3b.pdf [15 KiB] HiDef png [215 KiB] Thumbnail [169 KiB] *.C file |
|
|
|
Fig3c.pdf [15 KiB] HiDef png [236 KiB] Thumbnail [185 KiB] *.C file |
|
|
|
Fig3d.pdf [15 KiB] HiDef png [231 KiB] Thumbnail [186 KiB] *.C file |
|
|
|
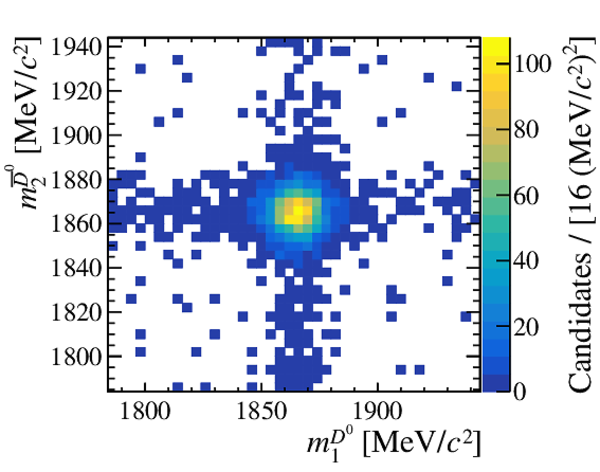
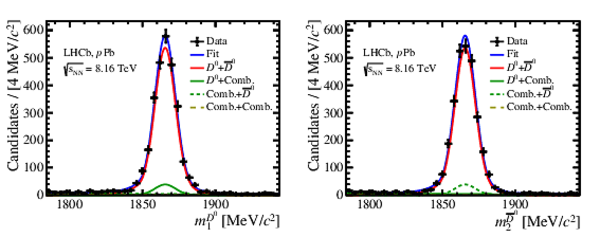
(Left) Two-dimensional invariant-mass distributions of $(m_1, m_2)$ for $ D ^0 D ^0 $ pairs and the projections on (middle) $m_1$ and (right) $m_2$ with the fit results superimposed. Shown in the projection plots are (points with error bars) $\mathrm{Pb}p$ data, (solid blue) the total fit and the four fit components. |
Fig4a.pdf [16 KiB] HiDef png [260 KiB] Thumbnail [292 KiB] *.C file |
|
|
Fig4b.pdf [32 KiB] HiDef png [249 KiB] Thumbnail [181 KiB] *.C file |
|
|
|
(Left) Two-dimensional invariant-mass distributions of $(m_1, m_2)$ for $ D ^0 \overline{ D } {}^0 $ pairs and the projections on (middle) $m_1$ and (right) $m_2$ with the fit results superimposed. Shown in the projection plots are (points with error bars) data data, (solid blue) the total fit and the four fit components. The plots in the top (bottom) row correspond to $ p\mathrm{Pb}$ ( $\mathrm{Pb}p$ ) data. |
Fig5a.pdf [16 KiB] HiDef png [240 KiB] Thumbnail [270 KiB] *.C file |
|
|
Fig5b.pdf [32 KiB] HiDef png [223 KiB] Thumbnail [172 KiB] *.C file |
|
|
|
Fig5c.pdf [16 KiB] HiDef png [264 KiB] Thumbnail [304 KiB] *.C file |
|
|
|
Fig5d.pdf [33 KiB] HiDef png [234 KiB] Thumbnail [177 KiB] *.C file |
|
|
|
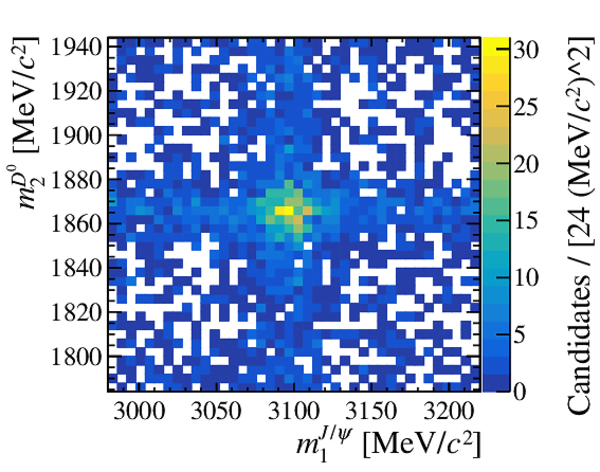
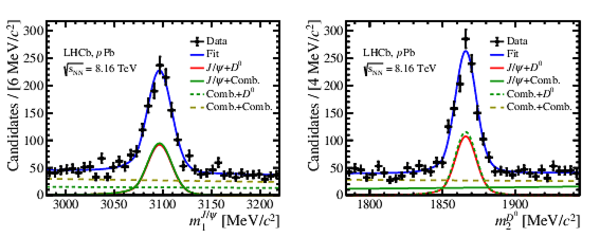
(Left) Two-dimensional invariant-mass distributions of $(m_1^ { J \mskip -3mu/\mskip -2mu\psi } , m_2^ D ^0 )$ for $ { J \mskip -3mu/\mskip -2mu\psi } D ^0 $ pairs and the projections on (middle) $m_1^ { J \mskip -3mu/\mskip -2mu\psi } $ and (right) $m_2^ D ^0 $ with the fit results superimposed. Shown in the projection plots are (points with error bars) data data, (solid blue) the total fit and the four fit components. The plots in the top (bottom) row correspond to $ p\mathrm{Pb}$ ( $\mathrm{Pb}p$ ) data. |
Fig6a.pdf [19 KiB] HiDef png [380 KiB] Thumbnail [424 KiB] *.C file |
|
|
Fig6b.pdf [33 KiB] HiDef png [269 KiB] Thumbnail [208 KiB] *.C file |
|
|
|
Fig6c.pdf [22 KiB] HiDef png [402 KiB] Thumbnail [397 KiB] *.C file |
|
|
|
Fig6d.pdf [33 KiB] HiDef png [287 KiB] Thumbnail [218 KiB] *.C file |
|
|
|
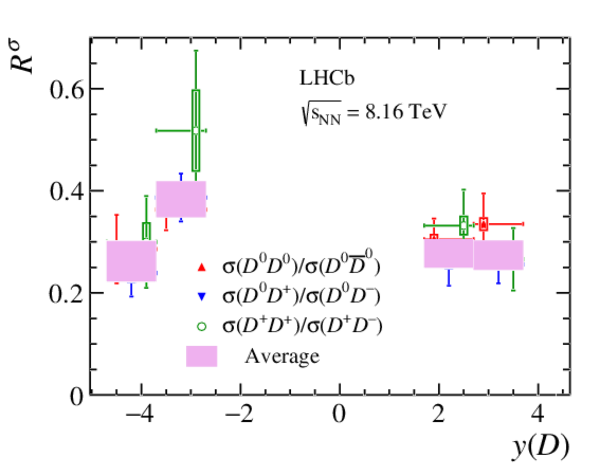
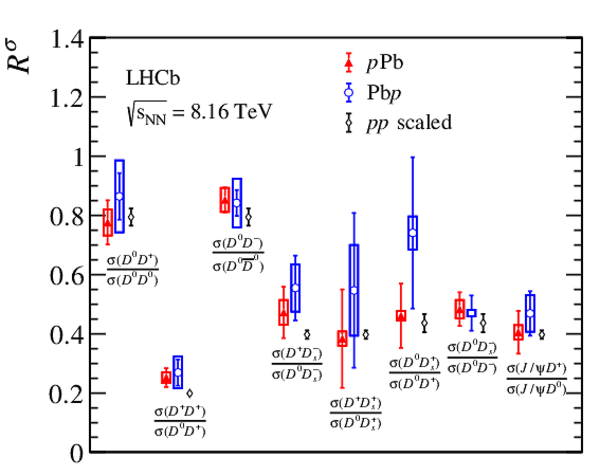
Ratios of differential cross-sections in bins of charm hadron rapidity under the $ p_{\mathrm{T}} ( D )>2\text{ Ge V /}c $ requirement. The average over all the pairs listed in Table 5 for each rapidity interval is also presented. The boxes (bars) correspond to systematic (statistical) uncertainties. Points are shifted horizontally to improve visibility. |
Fig7.pdf [15 KiB] HiDef png [190 KiB] Thumbnail [143 KiB] *.C file |
|
|
Animated gif made out of all figures. |
PAPER-2020-010.gif Thumbnail |

|
![HiDef png [236 KiB]](Directory_LHCb-PAPER-2020-010/hidef_Fig1a.png)
![HiDef png [227 KiB]](Directory_LHCb-PAPER-2020-010/hidef_Fig1b.png)
![HiDef png [246 KiB]](Directory_LHCb-PAPER-2020-010/hidef_Fig2a.png)
![HiDef png [242 KiB]](Directory_LHCb-PAPER-2020-010/hidef_Fig2b.png)
![HiDef png [219 KiB]](Directory_LHCb-PAPER-2020-010/hidef_Fig3a.png)
![HiDef png [215 KiB]](Directory_LHCb-PAPER-2020-010/hidef_Fig3b.png)
![HiDef png [236 KiB]](Directory_LHCb-PAPER-2020-010/hidef_Fig3c.png)
![HiDef png [231 KiB]](Directory_LHCb-PAPER-2020-010/hidef_Fig3d.png)
![HiDef png [260 KiB]](Directory_LHCb-PAPER-2020-010/hidef_Fig4a.png)
![HiDef png [249 KiB]](Directory_LHCb-PAPER-2020-010/hidef_Fig4b.png)
![HiDef png [240 KiB]](Directory_LHCb-PAPER-2020-010/hidef_Fig5a.png)
![HiDef png [223 KiB]](Directory_LHCb-PAPER-2020-010/hidef_Fig5b.png)
![HiDef png [264 KiB]](Directory_LHCb-PAPER-2020-010/hidef_Fig5c.png)
![HiDef png [234 KiB]](Directory_LHCb-PAPER-2020-010/hidef_Fig5d.png)
![HiDef png [380 KiB]](Directory_LHCb-PAPER-2020-010/hidef_Fig6a.png)
![HiDef png [269 KiB]](Directory_LHCb-PAPER-2020-010/hidef_Fig6b.png)
![HiDef png [402 KiB]](Directory_LHCb-PAPER-2020-010/hidef_Fig6c.png)
![HiDef png [287 KiB]](Directory_LHCb-PAPER-2020-010/hidef_Fig6d.png)
![HiDef png [190 KiB]](Directory_LHCb-PAPER-2020-010/hidef_Fig7.png)
Tables and captions
|
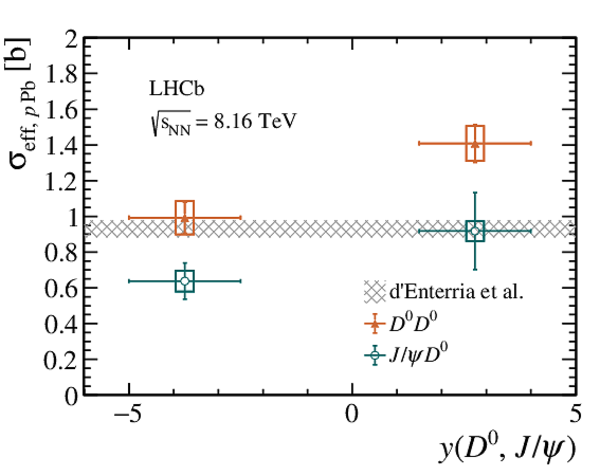
The effective cross-section $\sigma_{\mathrm{eff}, p\mathrm{Pb}}$ (in $\text{ b} $) measured using $ { J \mskip -3mu/\mskip -2mu\psi } D ^0 $ and $ D ^0 D ^0 $ pair production in $p$-Pb data and the extrapolated values from $pp$ data [80]. |
Table_1.pdf [60 KiB] HiDef png [35 KiB] Thumbnail [16 KiB] tex code |

|
|
Total cross-sections of charm pair production (in $\text{ mb}$ ) in $ p\mathrm{Pb}$ and $\mathrm{Pb}p$ data for the $ p_{\mathrm{T}} $ requirement on the charm hadron, $ p_{\mathrm{T}} >0\text{ Ge V /}c $ for $ { J \mskip -3mu/\mskip -2mu\psi } , D ^0 $ and $ p_{\mathrm{T}} >2\text{ Ge V /}c $ for $ D ^+ , D ^+_ s $. The rapidity range is for each charm hadron in the pair. The first uncertainty is statistical and the second is systematic. The prediction of SPS $ { J \mskip -3mu/\mskip -2mu\psi } D ^0 $ production calculated using the weighted EPPS16 nuclear PDF [92,93,94,95] is also listed for comparison, where the first uncertainty is from uncertainties of scales, feed-down contribution and model parameters, and the second due to nuclear PDF uncertainties. |
Table_2.pdf [70 KiB] HiDef png [123 KiB] Thumbnail [59 KiB] tex code |

|
|
Total production cross-sections (in $\text{ mb}$ ) of open charm pairs involving the $ D ^0 $ meson in $ p\mathrm{Pb}$ and $\mathrm{Pb}p$ data with the $ p_{\mathrm{T}} ( D ^0 )>2\text{ Ge V /}c $ requirement. The rapidity range is for each charm hadron in the pair. The first uncertainty is statistical and the second is systematic. Predictions for the $ D ^0 D ^0 $ and $ D ^0 \overline{ D } {}^0 $ cross-sections from Ref. [24] are given in the last two rows of the Table. |
Table_3.pdf [69 KiB] HiDef png [124 KiB] Thumbnail [65 KiB] tex code |

|
|
Total cross-sections (in $\text{ mb}$ ) in $ p\mathrm{Pb}$ and $\mathrm{Pb}p$ data for full rapidity acceptance without any $ p_{\mathrm{T}} (H_c)$ requirement. The first uncertainty is statistical and the second is systematic. |
Table_4.pdf [59 KiB] HiDef png [57 KiB] Thumbnail [29 KiB] tex code |

|
|
Ratios of differential cross-sections in bins of charm hadron rapidity for charm $ p_{\mathrm{T}} (H_c)>2\text{ Ge V /}c $. The average over all the pairs in each rapidity interval is also presented. |
Table_5.pdf [67 KiB] HiDef png [79 KiB] Thumbnail [34 KiB] tex code |

|
![HiDef png [35 KiB]](Directory_LHCb-PAPER-2020-010/hidef_Table_1.png)
![HiDef png [123 KiB]](Directory_LHCb-PAPER-2020-010/hidef_Table_2.png)
![HiDef png [124 KiB]](Directory_LHCb-PAPER-2020-010/hidef_Table_3.png)
![HiDef png [57 KiB]](Directory_LHCb-PAPER-2020-010/hidef_Table_4.png)
![HiDef png [79 KiB]](Directory_LHCb-PAPER-2020-010/hidef_Table_5.png)
Supplementary Material [file]
| Supplementary material full pdf |
supple[..].pdf [275 KiB] |
|
|
This ZIP file contains supplementary material for the publication LHCb-PAPER-2020-010. The files are: Supplementary.pdf : An overview of the extra figures *.pdf, *.png, *.eps : The figures in various formats |
FigS1a.pdf [15 KiB] HiDef png [158 KiB] Thumbnail [139 KiB] *C file |
|
|
FigS1b.pdf [15 KiB] HiDef png [165 KiB] Thumbnail [145 KiB] *C file |
|
|
|
FigS2.pdf [16 KiB] HiDef png [184 KiB] Thumbnail [162 KiB] *C file |
|
|
|
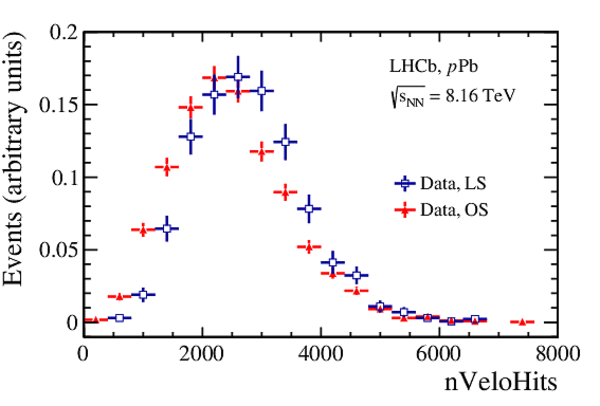
FigS3a.pdf [15 KiB] HiDef png [220 KiB] Thumbnail [170 KiB] *C file |
|
|
|
FigS3b.pdf [14 KiB] HiDef png [215 KiB] Thumbnail [169 KiB] *C file |
|
|
|
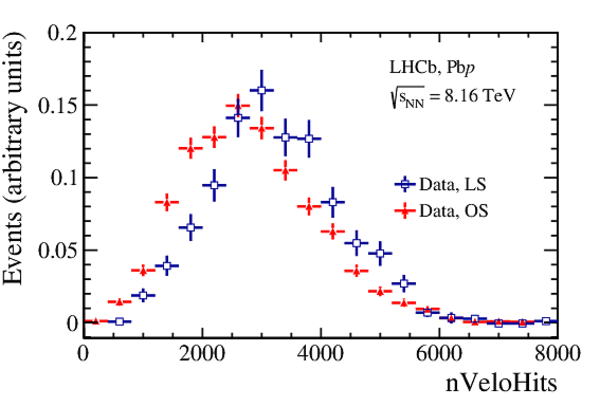
FigS4a.pdf [15 KiB] HiDef png [213 KiB] Thumbnail [164 KiB] *C file |
|
|
|
FigS4b.pdf [15 KiB] HiDef png [213 KiB] Thumbnail [163 KiB] *C file |
|
|
|
FigS5a.pdf [14 KiB] HiDef png [176 KiB] Thumbnail [133 KiB] *C file |
|
|
|
FigS5b.pdf [15 KiB] HiDef png [204 KiB] Thumbnail [159 KiB] *C file |
|
|
|
FigS6.pdf [15 KiB] HiDef png [201 KiB] Thumbnail [180 KiB] *C file |
|
![HiDef png [158 KiB]](Directory_LHCb-PAPER-2020-010/supplementary/hidef_FigS1a.png)
![HiDef png [165 KiB]](Directory_LHCb-PAPER-2020-010/supplementary/hidef_FigS1b.png)
![HiDef png [184 KiB]](Directory_LHCb-PAPER-2020-010/supplementary/hidef_FigS2.png)
![HiDef png [220 KiB]](Directory_LHCb-PAPER-2020-010/supplementary/hidef_FigS3a.png)
![HiDef png [215 KiB]](Directory_LHCb-PAPER-2020-010/supplementary/hidef_FigS3b.png)
![HiDef png [213 KiB]](Directory_LHCb-PAPER-2020-010/supplementary/hidef_FigS4a.png)
![HiDef png [213 KiB]](Directory_LHCb-PAPER-2020-010/supplementary/hidef_FigS4b.png)
![HiDef png [176 KiB]](Directory_LHCb-PAPER-2020-010/supplementary/hidef_FigS5a.png)
![HiDef png [204 KiB]](Directory_LHCb-PAPER-2020-010/supplementary/hidef_FigS5b.png)
![HiDef png [201 KiB]](Directory_LHCb-PAPER-2020-010/supplementary/hidef_FigS6.png)
Created on 20 April 2024.