Information
LHCb-PAPER-2020-012
CERN-EP-2020-124
arXiv:2007.11292 [PDF]
(Submitted on 22 Jul 2020)
Phys. Rev. D102 (2020) 112012
Inspire 1808401
Tools
Abstract
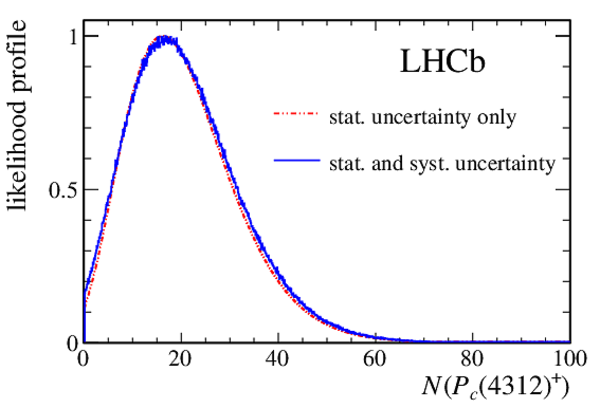
The decay $\Lambda_b^0 \to \eta_c(1S) p K^-$ is observed for the first time using a data sample of proton-proton collisions, corresponding to an integrated luminosity of 5.5 $fb^{-1}$, collected with the LHCb experiment at a center-of-mass energy of 13 TeV. The branching fraction of the decay is measured, using the $\Lambda_b^0 \to J/\psi p K^-$ decay as a normalization mode, to be $\mathcal{B}(\Lambda_b^0 \to \eta_c(1S) p K^-)=(1.06\pm0.16\pm0.06^{+0.22}_{-0.19})\times10^{-4}$, where the quoted uncertainties are statistical, systematic and due to external inputs, respectively. A study of the $\eta_c(1S) p$ mass spectrum is performed to search for the $P_c(4312)^+$ pentaquark state. No evidence is observed and an upper limit of \begin{equation*} \frac{\mathcal{B}(\Lambda_b^0 \to P_c(4312)^+ K^-)\times \mathcal{B}(P_c(4312)^+ \to \eta_c(1S) p)}{\mathcal{B}(\Lambda_b^0 \to \eta_c(1S) p K^-)} < 0.24 \end{equation*} is obtained at the 95 confidence level.
Figures and captions
|
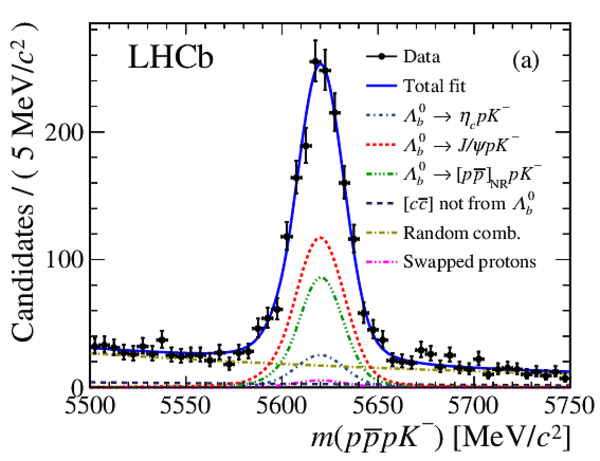
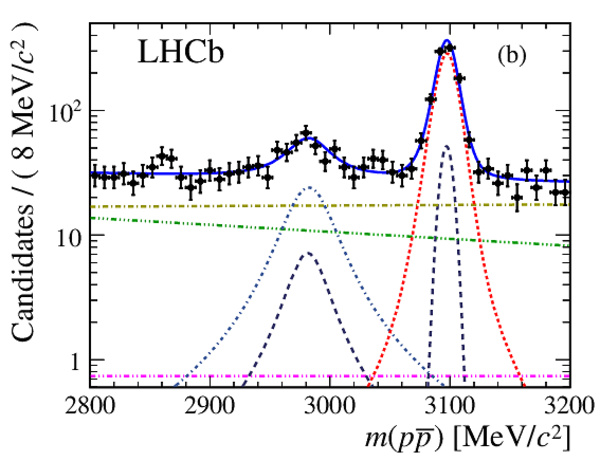
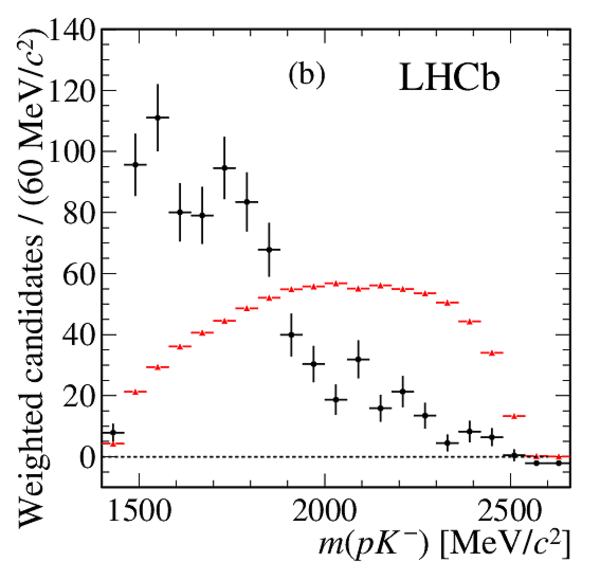
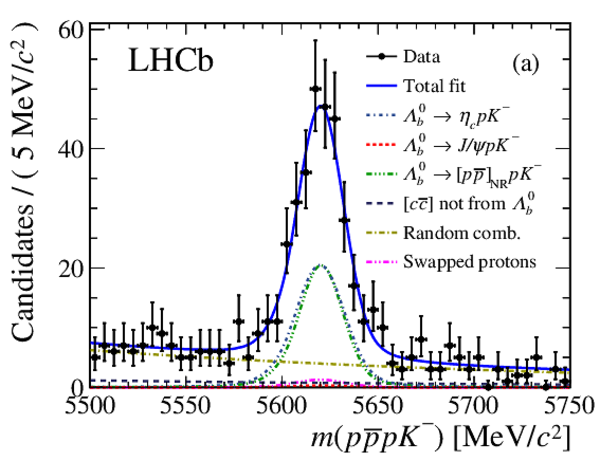
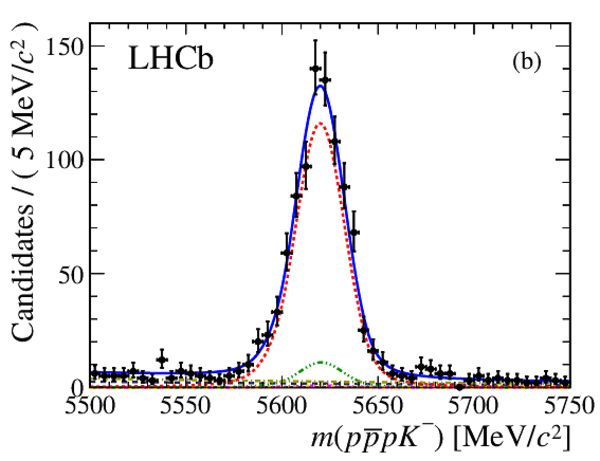
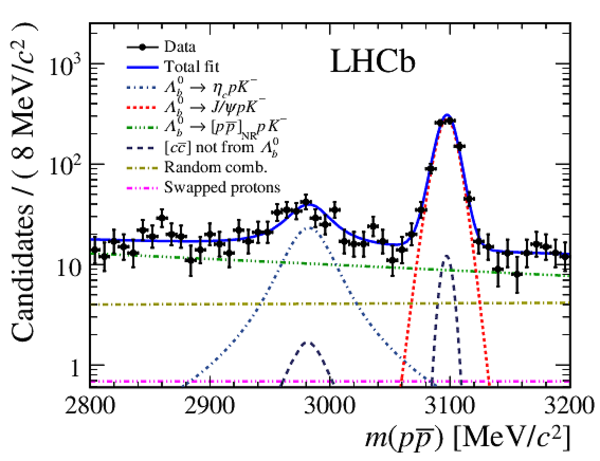
Distributions of (a) $m( p \overline p p K ^- )$ and (b) $m( p \overline p )$ of the selected candidates. The data are shown as black circles, while the blue solid line shows the fit result. Individual components are given in the legend. |
Fig1a.pdf [23 KiB] HiDef png [359 KiB] Thumbnail [272 KiB] *.C file |
|
|
Fig1b.pdf [22 KiB] HiDef png [325 KiB] Thumbnail [250 KiB] *.C file |
|
|
|
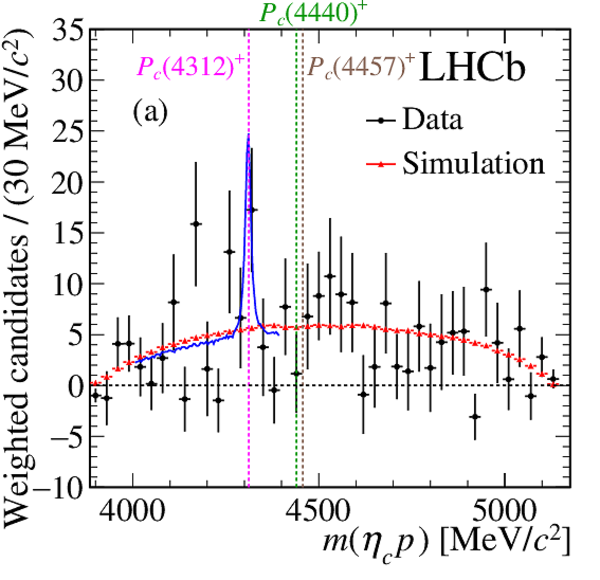
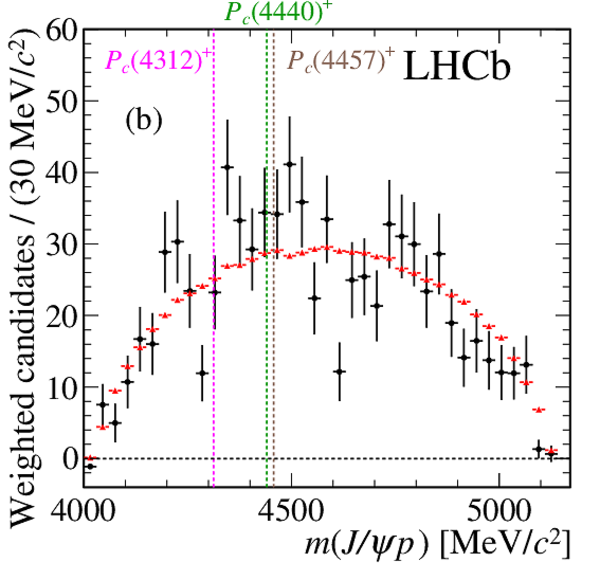
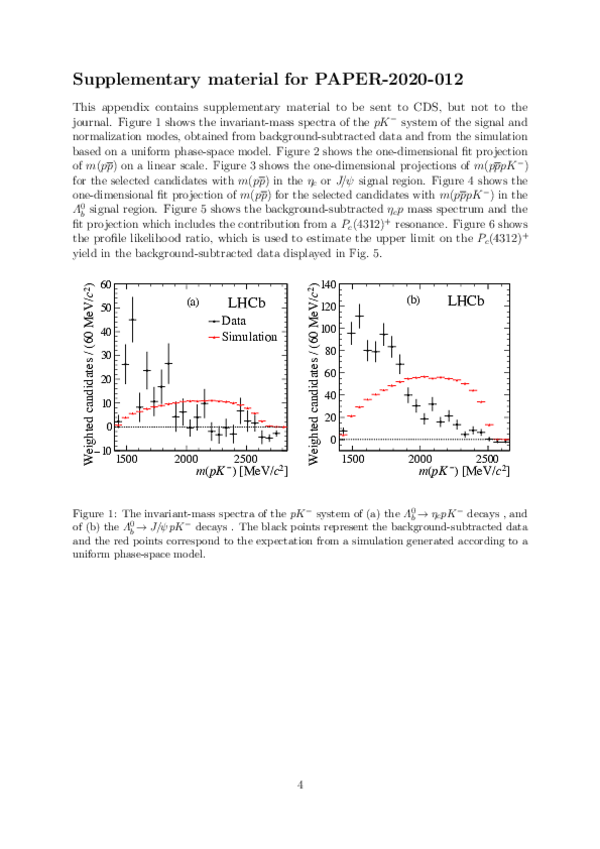
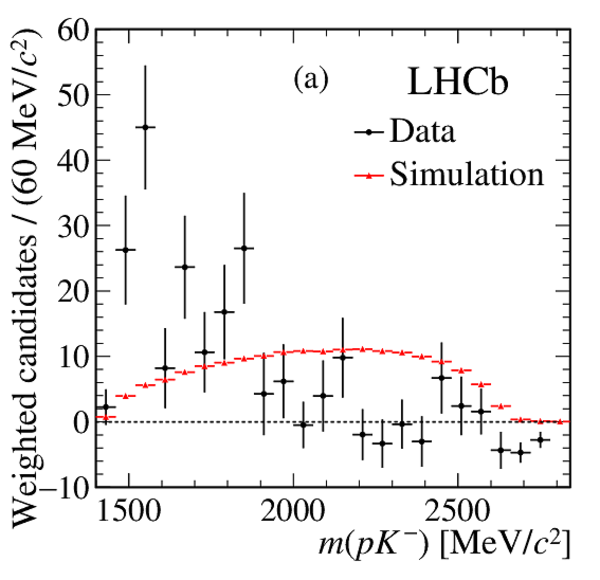
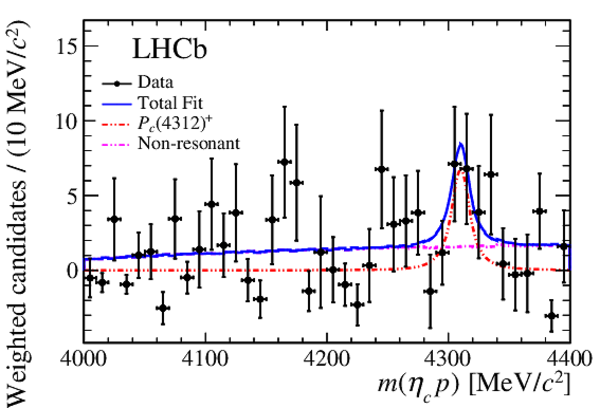
The invariant-mass spectra of (a) the $\eta _ c $ $ p $ system of the $\Lambda ^0_ b \rightarrow \eta _ c p K ^- $ decays and (b) the $ { J \mskip -3mu/\mskip -2mu\psi \mskip 2mu}$ $ p $ system of the $\Lambda ^0_ b \rightarrow { J \mskip -3mu/\mskip -2mu\psi \mskip 2mu} p K ^- $ decays. The black points represent the background-subtracted data and the red points correspond to the expectation from a simulation generated according to a uniform phase-space model. The blue solid line in (a) shows the fit projection of the $\eta _ c $ $ p $ mass spectrum including the contribution from a $P_c(4312)^+$ resonance in the mass range $[4000, 4400]\text{ Me V /}c^2 $. |
Fig2a.pdf [20 KiB] HiDef png [354 KiB] Thumbnail [291 KiB] *.C file |
|
|
Fig2b.pdf [18 KiB] HiDef png [302 KiB] Thumbnail [267 KiB] *.C file |
|
|
|
Animated gif made out of all figures. |
PAPER-2020-012.gif Thumbnail |

|
![HiDef png [359 KiB]](Directory_LHCb-PAPER-2020-012/hidef_Fig1a.png)
![HiDef png [325 KiB]](Directory_LHCb-PAPER-2020-012/hidef_Fig1b.png)
![HiDef png [354 KiB]](Directory_LHCb-PAPER-2020-012/hidef_Fig2a.png)
![HiDef png [302 KiB]](Directory_LHCb-PAPER-2020-012/hidef_Fig2b.png)
Tables and captions
|
Summary of the uncertainties on the branching fraction ratio $\mathcal{B} (\Lambda ^0_ b \rightarrow \eta _ c p K ^- )/\mathcal{B} (\Lambda ^0_ b \rightarrow { J \mskip -3mu/\mskip -2mu\psi \mskip 2mu} p K ^- )$. The total systematic uncertainty is obtained by summing the individual contributions in quadrature. |
Table_1.pdf [70 KiB] HiDef png [75 KiB] Thumbnail [33 KiB] tex code |

|
![HiDef png [75 KiB]](Directory_LHCb-PAPER-2020-012/hidef_Table_1.png)
Supplementary Material [file]
| Supplementary material full pdf |
Supple[..].pdf [451 KiB] |
|
|
This ZIP file contains supplemetary material for the publication LHCb-PAPER-2020-012. The files are: Supplementary.pdf : An overview of the extra figures supplementary.tex : Source latex file for Supplementary.pdf *.pdf, *.png, *.eps : The figures in variuous formats *.C : cpp files to create the figures. |
Fig1a-S.pdf [16 KiB] HiDef png [209 KiB] Thumbnail [220 KiB] *C file |
|
|
Fig1b-S.pdf [15 KiB] HiDef png [185 KiB] Thumbnail [196 KiB] *C file |
|
|
|
Fig2-S.pdf [23 KiB] HiDef png [387 KiB] Thumbnail [298 KiB] *C file |
|
|
|
Fig3a-S.pdf [23 KiB] HiDef png [364 KiB] Thumbnail [280 KiB] *C file |
|
|
|
Fig3b-S.pdf [22 KiB] HiDef png [282 KiB] Thumbnail [198 KiB] *C file |
|
|
|
Fig4-S.pdf [23 KiB] HiDef png [348 KiB] Thumbnail [282 KiB] *C file |
|
|
|
Fig5-S.pdf [21 KiB] HiDef png [220 KiB] Thumbnail [202 KiB] *C file |
|
|
|
Fig6-S.pdf [27 KiB] HiDef png [164 KiB] Thumbnail [132 KiB] *C file |
|
![HiDef png [209 KiB]](Directory_LHCb-PAPER-2020-012/supplementary/hidef_Fig1a-S.png)
![HiDef png [185 KiB]](Directory_LHCb-PAPER-2020-012/supplementary/hidef_Fig1b-S.png)
![HiDef png [387 KiB]](Directory_LHCb-PAPER-2020-012/supplementary/hidef_Fig2-S.png)
![HiDef png [364 KiB]](Directory_LHCb-PAPER-2020-012/supplementary/hidef_Fig3a-S.png)
![HiDef png [282 KiB]](Directory_LHCb-PAPER-2020-012/supplementary/hidef_Fig3b-S.png)
![HiDef png [348 KiB]](Directory_LHCb-PAPER-2020-012/supplementary/hidef_Fig4-S.png)
![HiDef png [220 KiB]](Directory_LHCb-PAPER-2020-012/supplementary/hidef_Fig5-S.png)
![HiDef png [164 KiB]](Directory_LHCb-PAPER-2020-012/supplementary/hidef_Fig6-S.png)
Created on 19 April 2024.