First observation of the decay $B^0 \rightarrow D^0 \overline{D}{}^0 K^+ \pi^-$
[to restricted-access page]Information
LHCb-PAPER-2020-015
CERN-EP-2020-112
arXiv:2007.04280 [PDF]
(Submitted on 08 Jul 2020)
Phys. Rev. D102 (2020) 051102
Inspire 1805775
Tools
Abstract
The first observation of the decay $B^0 \rightarrow D^0 \overline{D}{}^0 K^+ \pi^-$ is reported using proton-proton collision data corresponding to an integrated luminosity of 4.7 $\mathrm{fb}^{-1}$ collected by the LHCb experiment in 2011, 2012 and 2016. The measurement is performed in the full kinematically allowed range of the decay outside of the $D^{*-}$ region. The ratio of the branching fraction relative to that of the control channel $B^0 \rightarrow D^{*-} D^0 K^+$ is measured to be $\mathcal{R} = (14.2 \pm 1.1 \pm 1.0)\%$, where the first uncertainty is statistical and the second is systematic. The absolute branching fraction of $B^0 \rightarrow D^0 \overline{D}{}^0 K^+ \pi^-$ decays is thus determined to be $\mathcal{B}(B^0 \rightarrow D^0 \overline{D}{}^0 K^+ \pi^-) = (3.50 \pm 0.27 \pm 0.26 \pm 0.30) \times 10^{-4}$, where the third uncertainty is due to the branching fraction of the control channel. This decay mode is expected to provide insights to spectroscopy and the charm-loop contributions in rare semileptonic decays.
Figures and captions
|
Feynman diagrams of the external (left) and internal (right) W emission contributing to $ B ^0 \rightarrow D ^0 \overline{ D } {}^0 K ^+ \pi ^- $ decays. |
Fig1a.pdf [41 KiB] HiDef png [48 KiB] Thumbnail [22 KiB] *.C file |

|
|
Fig1b.pdf [33 KiB] HiDef png [33 KiB] Thumbnail [16 KiB] *.C file |

|
|
|
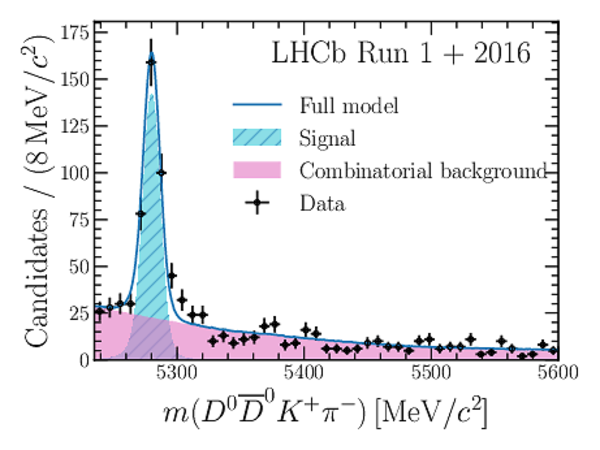
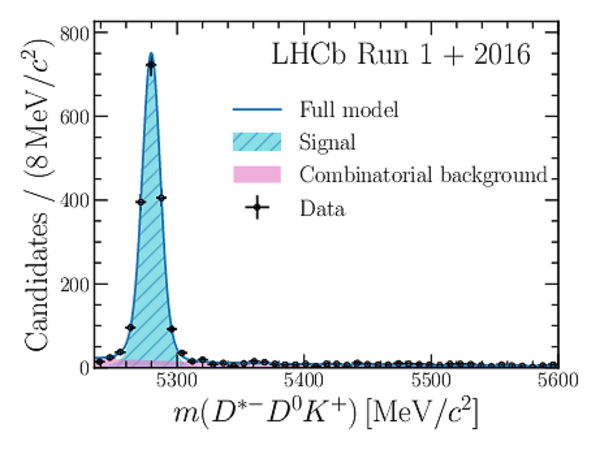
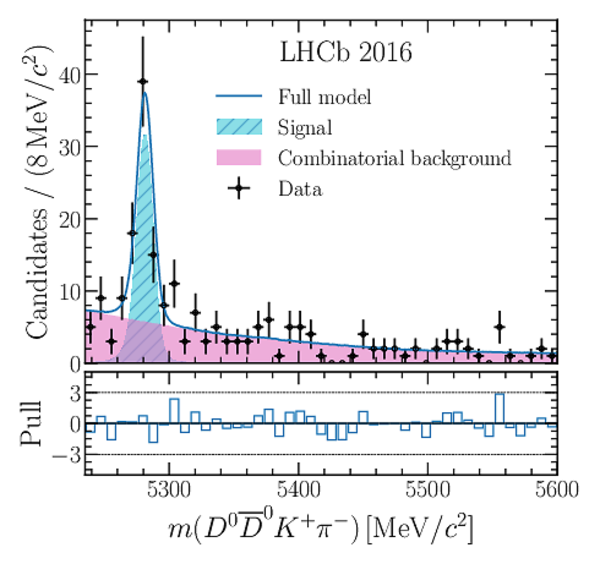
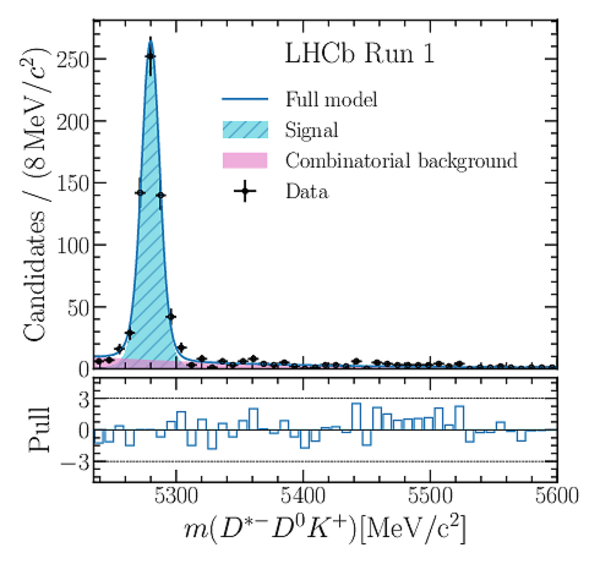
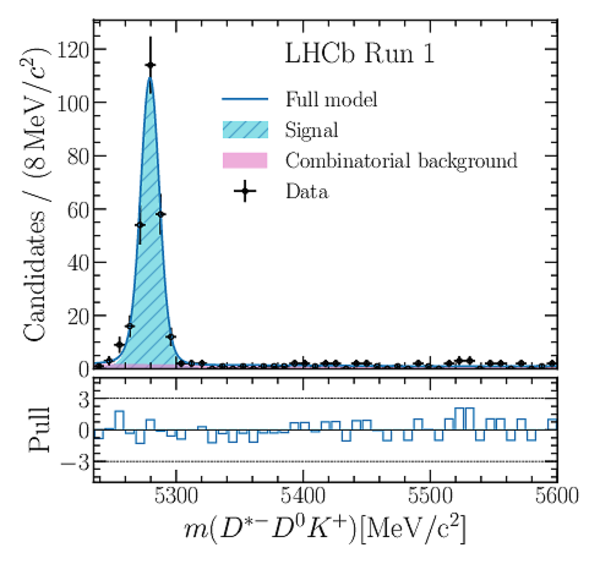
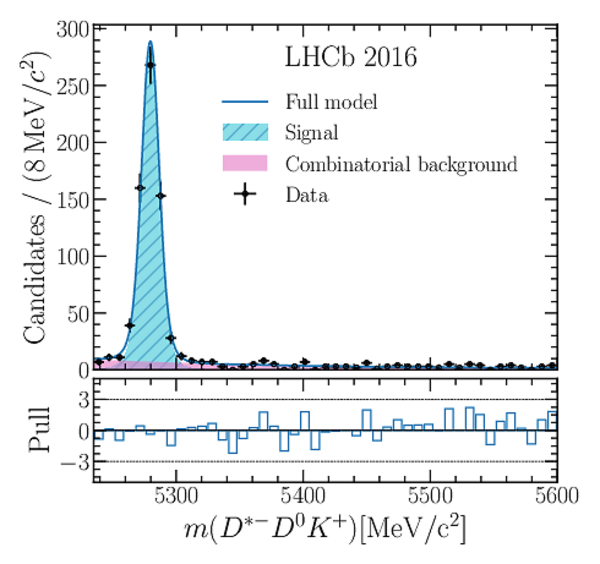
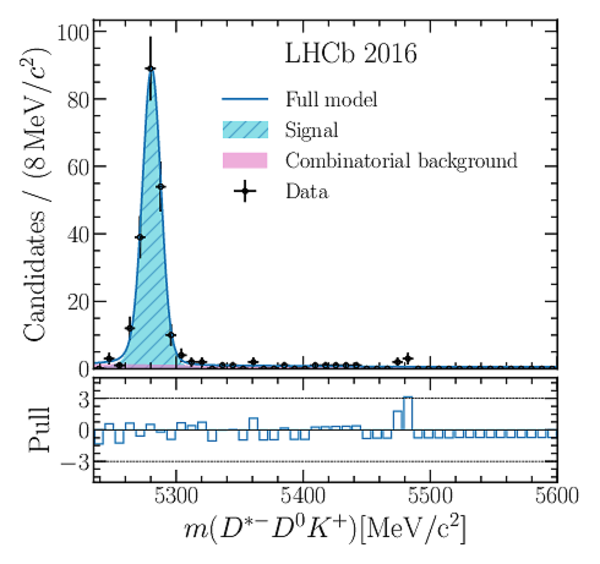
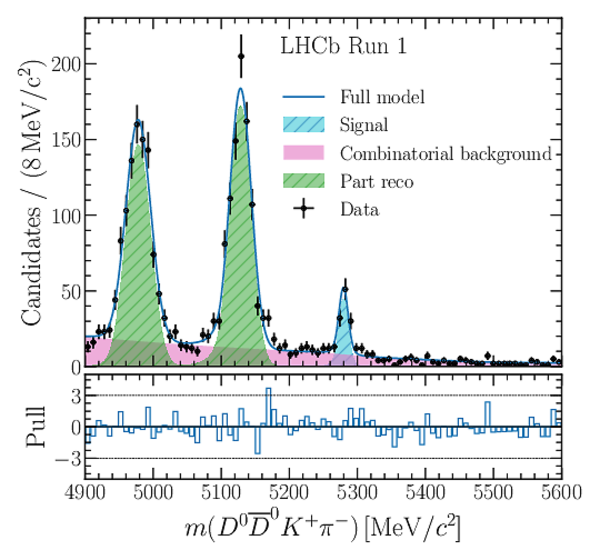
Invariant-mass distributions and fit projections for $ B ^0 $ candidates in (left) the signal and (right) control mode for all subsamples combined. The data are shown as black points with error bars and the fit components are as described in the legends. The small single-charm and charmless background is included in the signal component. |
Fig2a.pdf [144 KiB] HiDef png [343 KiB] Thumbnail [290 KiB] *.C file |
|
|
Fig2b.pdf [141 KiB] HiDef png [300 KiB] Thumbnail [239 KiB] *.C file |
|
|
|
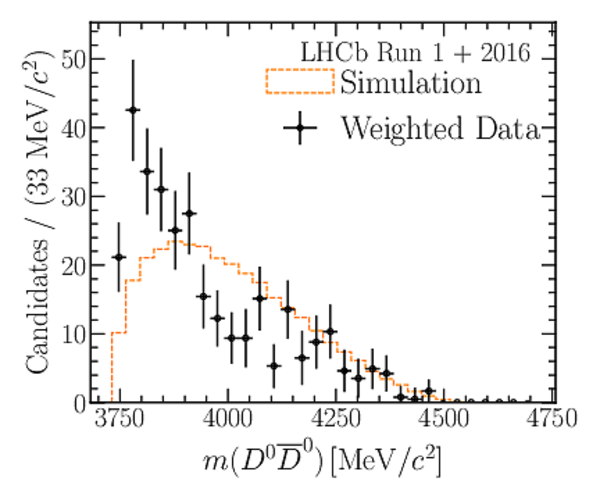
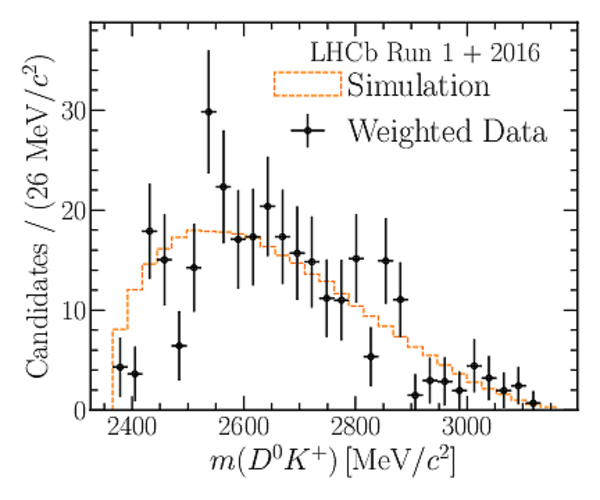
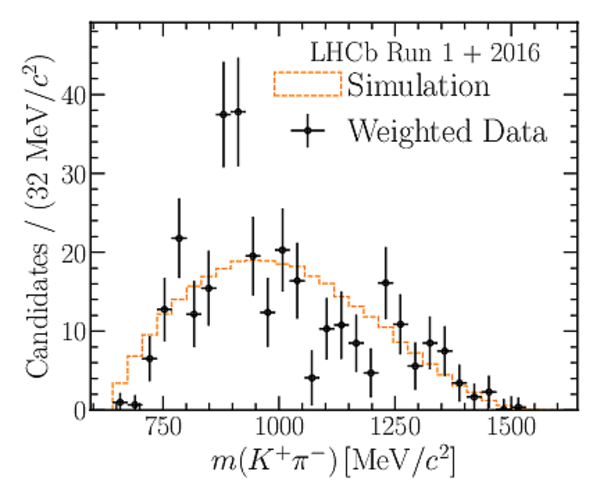
Projections of background-subtracted data (black points) in (left) $m( D ^0 \overline{ D } {}^0 )$, (centre) $m( D ^0 K ^+ )$ and (right) $m( K ^+ \pi ^- )$ with the phase-space only distribution (orange dashed line) superimposed for reference. The data contain a few single-charm and charmless background candidates. |
Fig3a.pdf [99 KiB] HiDef png [188 KiB] Thumbnail [229 KiB] *.C file |
|
|
Fig3b.pdf [99 KiB] HiDef png [190 KiB] Thumbnail [223 KiB] *.C file |
|
|
|
Fig3c.pdf [129 KiB] HiDef png [185 KiB] Thumbnail [220 KiB] *.C file |
|
|
|
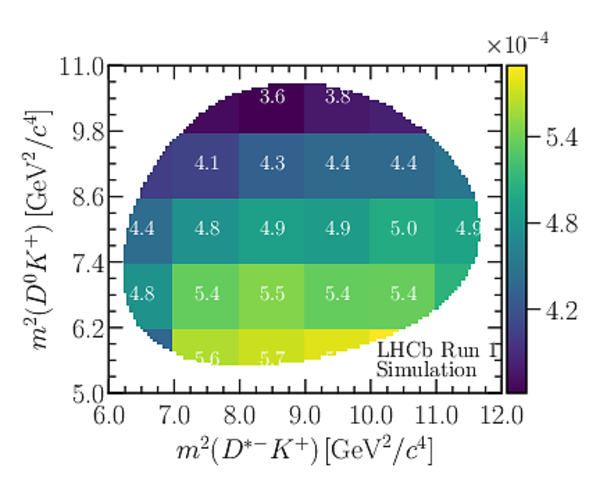
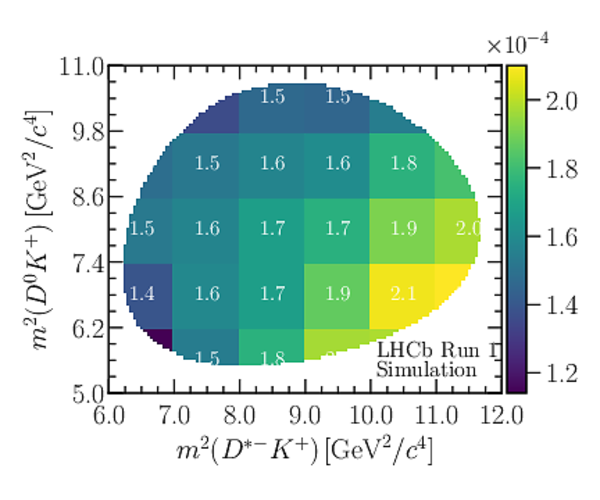
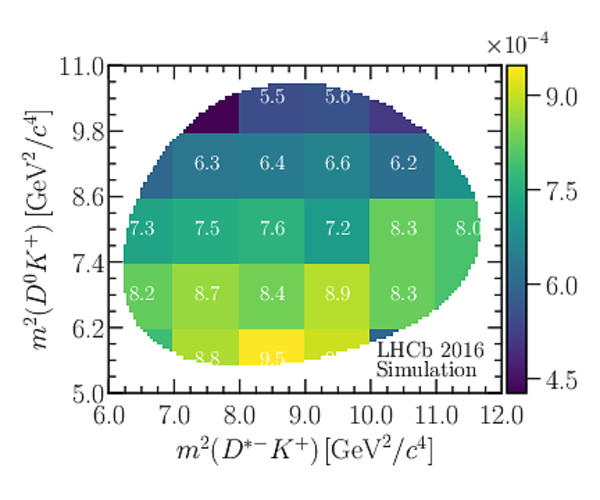
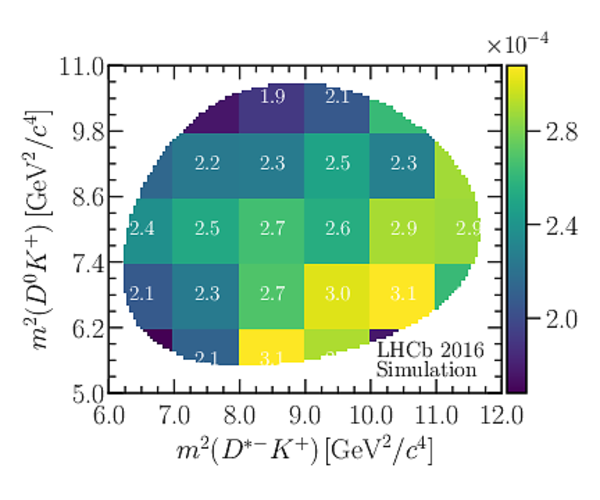
The efficiency $\varepsilon_{\rm{con}},$ as a function of position in the Dalitz plot of $ B ^0 \rightarrow D ^{*-} D ^0 K ^+ $ decays obtained from simulated samples. The top row shows Run 1 samples for (left) TOS and (right) TIS. The bottom row shows the same trigger categories for 2016 samples. |
FigS1a.pdf [132 KiB] HiDef png [270 KiB] Thumbnail [259 KiB] *.C file |
|
|
FigS1b.pdf [132 KiB] HiDef png [260 KiB] Thumbnail [258 KiB] *.C file |
|
|
|
FigS1c.pdf [132 KiB] HiDef png [293 KiB] Thumbnail [267 KiB] *.C file |
|
|
|
FigS1d.pdf [132 KiB] HiDef png [275 KiB] Thumbnail [261 KiB] *.C file |
|
|
|
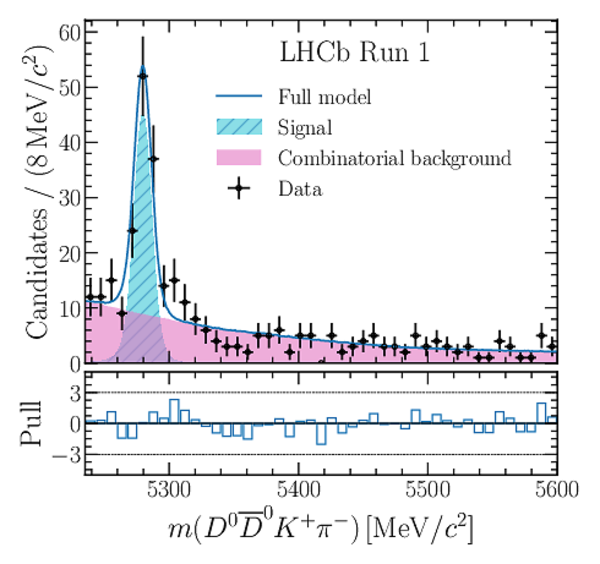
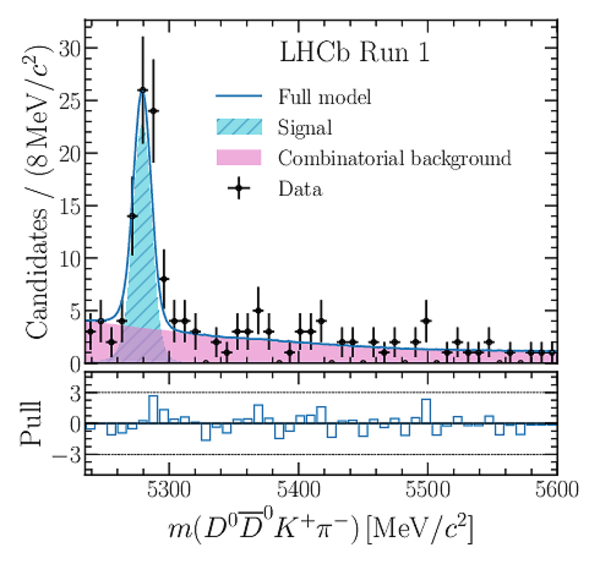
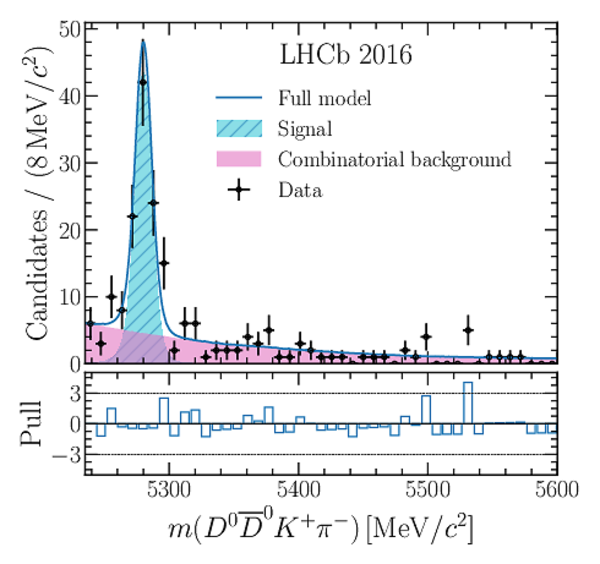
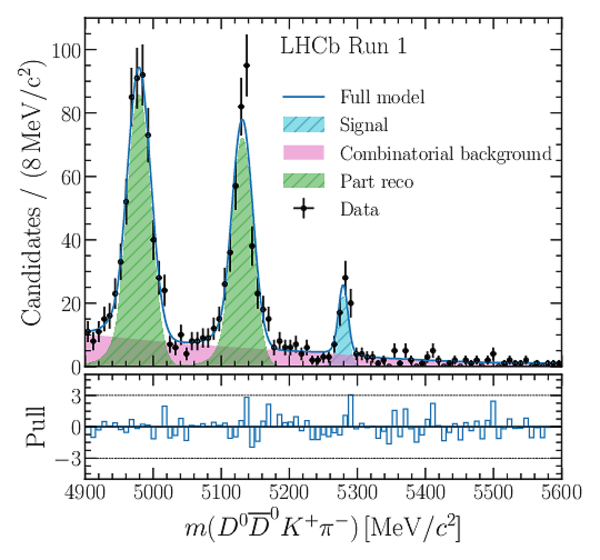
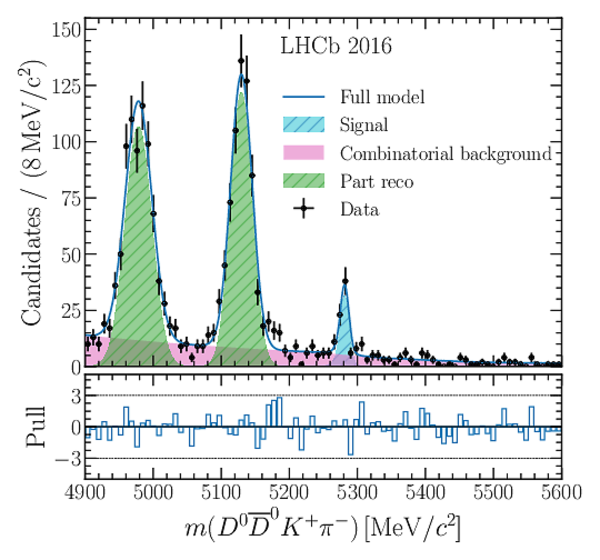
Invariant-mass distributions and fit projections for $ B ^0 \rightarrow D ^0 \overline{ D } {}^0 K ^+ \pi ^- $ candidates, shown separately for each run period, (top) Run 1 and (bottom) 2016, and trigger category, (left) TOS and (right) TIS. The data are shown as black points with error bars and the fit components are as described in the legends. Pull projections are shown beneath each distribution. The data contain a few single-charm and charmless background candidates. |
FigS2a.pdf [144 KiB] HiDef png [402 KiB] Thumbnail [344 KiB] *.C file |
|
|
FigS2b.pdf [144 KiB] HiDef png [388 KiB] Thumbnail [338 KiB] *.C file |
|
|
|
FigS2c.pdf [143 KiB] HiDef png [398 KiB] Thumbnail [323 KiB] *.C file |
|
|
|
FigS2d.pdf [145 KiB] HiDef png [384 KiB] Thumbnail [329 KiB] *.C file |
|
|
|
Invariant-mass distributions and fit projections for $ B ^0 \rightarrow D ^{*-} D ^0 K ^+ $ candidates, shown separately for each run period, (top) Run 1 and (bottom) 2016, and trigger category, (left) TOS and (right) TIS. The data are shown as black points with error bars and the fit components are as described in the legends. Pull projections are shown beneath each distribution. |
FigS3a.pdf [143 KiB] HiDef png [381 KiB] Thumbnail [307 KiB] *.C file |
|
|
FigS3b.pdf [142 KiB] HiDef png [366 KiB] Thumbnail [300 KiB] *.C file |
|
|
|
FigS3c.pdf [143 KiB] HiDef png [383 KiB] Thumbnail [307 KiB] *.C file |
|
|
|
FigS3d.pdf [143 KiB] HiDef png [358 KiB] Thumbnail [290 KiB] *.C file |
|
|
|
Invariant-mass distributions and fit projections for $ B ^0 \rightarrow D ^0 \overline{ D } {}^0 K ^+ \pi ^- $ candidates over an extended range, shown separately for each run period, (top) Run 1 and (bottom) 2016, and trigger category, (left) TOS and (right) TIS. The data are shown as black points with error bars and the fit components are as described in the legends, where the green shaded distribution describes partially reconstructed backgrounds. Pull projections are shown beneath each distribution. The data contain a few single-charm and charmless background candidates. |
FigS4a.pdf [153 KiB] HiDef png [475 KiB] Thumbnail [351 KiB] *.C file |
|
|
FigS4b.pdf [153 KiB] HiDef png [491 KiB] Thumbnail [359 KiB] *.C file |
|
|
|
FigS4c.pdf [152 KiB] HiDef png [484 KiB] Thumbnail [355 KiB] *.C file |

|
|
|
FigS4d.pdf [153 KiB] HiDef png [495 KiB] Thumbnail [368 KiB] *.C file |
|
|
|
Animated gif made out of all figures. |
PAPER-2020-015.gif Thumbnail |

|
![HiDef png [48 KiB]](Directory_LHCb-PAPER-2020-015/hidef_Fig1a.png)
![HiDef png [33 KiB]](Directory_LHCb-PAPER-2020-015/hidef_Fig1b.png)
![HiDef png [343 KiB]](Directory_LHCb-PAPER-2020-015/hidef_Fig2a.png)
![HiDef png [300 KiB]](Directory_LHCb-PAPER-2020-015/hidef_Fig2b.png)
![HiDef png [188 KiB]](Directory_LHCb-PAPER-2020-015/hidef_Fig3a.png)
![HiDef png [190 KiB]](Directory_LHCb-PAPER-2020-015/hidef_Fig3b.png)
![HiDef png [185 KiB]](Directory_LHCb-PAPER-2020-015/hidef_Fig3c.png)
![HiDef png [270 KiB]](Directory_LHCb-PAPER-2020-015/hidef_FigS1a.png)
![HiDef png [260 KiB]](Directory_LHCb-PAPER-2020-015/hidef_FigS1b.png)
![HiDef png [293 KiB]](Directory_LHCb-PAPER-2020-015/hidef_FigS1c.png)
![HiDef png [275 KiB]](Directory_LHCb-PAPER-2020-015/hidef_FigS1d.png)
![HiDef png [402 KiB]](Directory_LHCb-PAPER-2020-015/hidef_FigS2a.png)
![HiDef png [388 KiB]](Directory_LHCb-PAPER-2020-015/hidef_FigS2b.png)
![HiDef png [398 KiB]](Directory_LHCb-PAPER-2020-015/hidef_FigS2c.png)
![HiDef png [384 KiB]](Directory_LHCb-PAPER-2020-015/hidef_FigS2d.png)
![HiDef png [381 KiB]](Directory_LHCb-PAPER-2020-015/hidef_FigS3a.png)
![HiDef png [366 KiB]](Directory_LHCb-PAPER-2020-015/hidef_FigS3b.png)
![HiDef png [383 KiB]](Directory_LHCb-PAPER-2020-015/hidef_FigS3c.png)
![HiDef png [358 KiB]](Directory_LHCb-PAPER-2020-015/hidef_FigS3d.png)
![HiDef png [475 KiB]](Directory_LHCb-PAPER-2020-015/hidef_FigS4a.png)
![HiDef png [491 KiB]](Directory_LHCb-PAPER-2020-015/hidef_FigS4b.png)
![HiDef png [484 KiB]](Directory_LHCb-PAPER-2020-015/hidef_FigS4c.png)
![HiDef png [495 KiB]](Directory_LHCb-PAPER-2020-015/hidef_FigS4d.png)
Tables and captions
|
Systematic uncertainties expressed as a percentage of the branching fraction ratio $\mathcal{R}$. The statistical uncertainty is included for comparison. The single-charm and charmless backgrounds are considered together. |
Table_1.pdf [35 KiB] HiDef png [138 KiB] Thumbnail [60 KiB] tex code |

|
![HiDef png [138 KiB]](Directory_LHCb-PAPER-2020-015/hidef_Table_1.png)
Created on 19 April 2024.