Measurement of differential $b\bar{b}$- and $c\bar{c}$-dijet cross-sections in the forward region of $pp$ collisions at $\sqrt{s}=13 \mathrm{TeV}$
[to restricted-access page]Information
LHCb-PAPER-2020-018
CERN-EP-2020-174
arXiv:2010.09437 [PDF]
(Submitted on 19 Oct 2020)
JHEP 02 (2021) 023
Inspire 1823739
Tools
Abstract
The inclusive $b \bar{b}$- and $c \bar{c}$-dijet production cross-sections in the forward region of $pp$ collisions are measured using a data sample collected with the LHCb detector at a centre-of-mass energy of 13 TeV in 2016. The data sample corresponds to an integrated luminosity of 1.6 fb$^{-1}$. Differential cross-sections are measured as a function of the transverse momentum and of the pseudorapidity of the leading jet, of the rapidity difference between the jets, and of the dijet invariant mass. A fiducial region for the measurement is defined by requiring that the two jets originating from the two $b$ or $c$ quarks are emitted with transverse momentum greater than 20 GeV$/c$, pseudorapidity in the range $2.2 < \eta < 4.2$, and with a difference in the azimuthal angle between the two jets greater than 1.5. The integrated $b \bar{b}$-dijet cross-section is measured to be $53.0 \pm 9.7$ nb, and the total $c \bar{c}$-dijet cross-section is measured to be $73 \pm 16$ nb. The ratio between $c \bar{c}$- and $b \bar{b}$-dijet cross-sections is also measured and found to be $1.37 \pm 0.27$. The results are in agreement with theoretical predictions at next-to-leading order.
Figures and captions
|
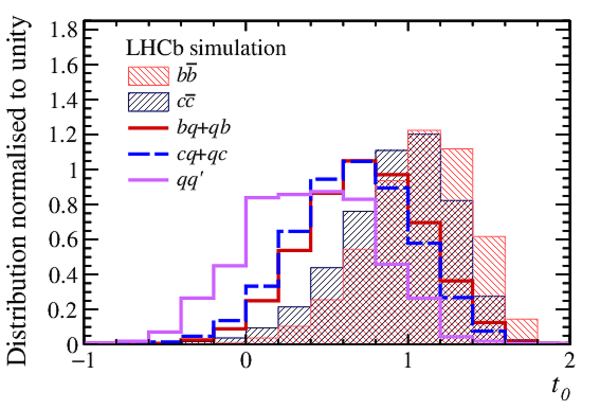
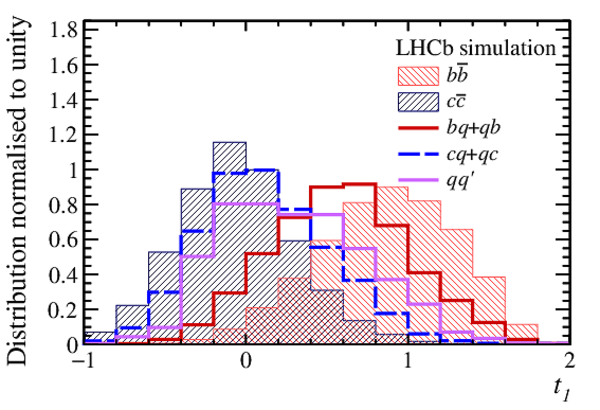
Fit templates for (left) $t_0$ and (right) $t_1$ projections for the same-flavour and different-flavour processes, summed over the $[ p_{\mathrm{T}} (j_0), p_{\mathrm{T}} (j_1)]$ bins, where $t_0$ and $t_1$ are the linear combinations of the tagging observables of both jets. The templates are normalised to unit area. To simplify the visualisation, the $qb$ and $bq$ samples ($qc$ and $cq$) are merged in the plot. |
Fig1a.pdf [14 KiB] HiDef png [477 KiB] Thumbnail [320 KiB] *.C file |
|
|
Fig1b.pdf [14 KiB] HiDef png [492 KiB] Thumbnail [355 KiB] *.C file |
|
|
|
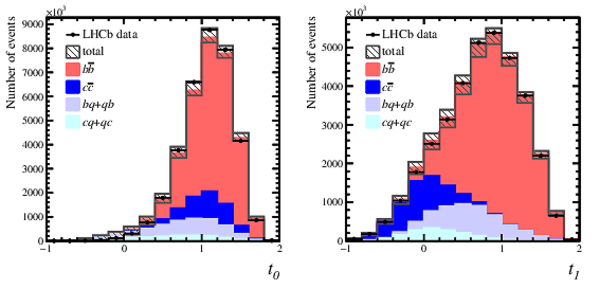
The observables $t_0$ and $t_1$ obtained by summing the fitted yields over the $\eta(j_0)$ and $[ p_{\mathrm{T}} (j_0), p_{\mathrm{T}} (j_1)]$ bins, where $t_0$ and $t_1$ are the linear combinations of the tagging observables of both jets. The fit is compared against the data (black points). The statistical uncertainty on data is small and not visible in the plot. The stacked histograms show the contribution from: (red) $b\bar{b}$, (blue) $c\bar{c}$, (lavender) $bq$ and $qb$, (light blue) $cq$ and $qc$. The $qq'$ component is not displayed since its yield is negligible. The dashed grey areas represent the total uncertainty (statistical and systematic) on the fit result. |
Fig2.pdf [21 KiB] HiDef png [202 KiB] Thumbnail [160 KiB] *.C file |
|
|
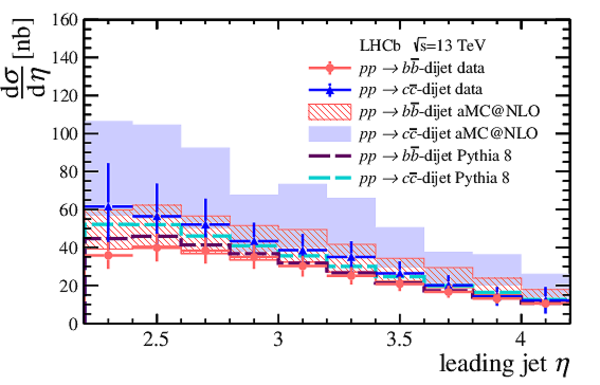
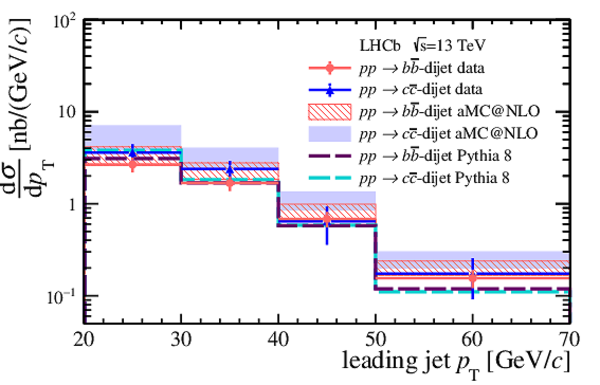
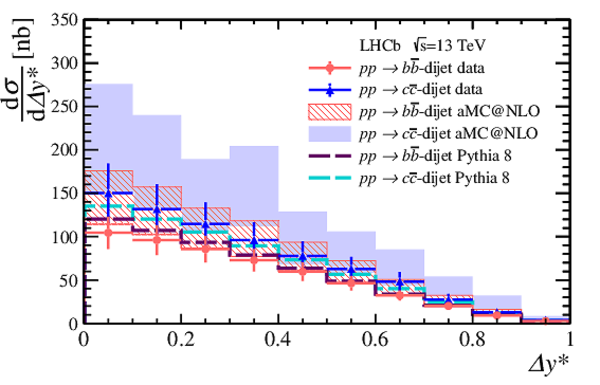
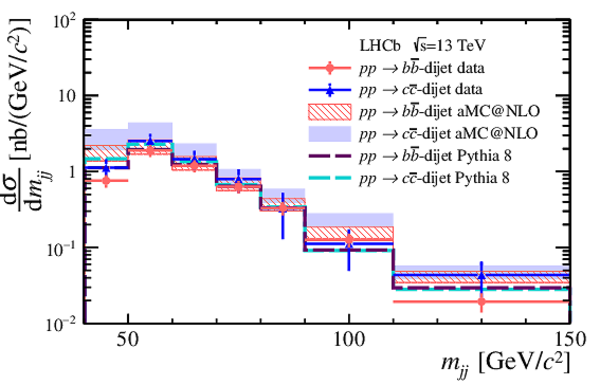
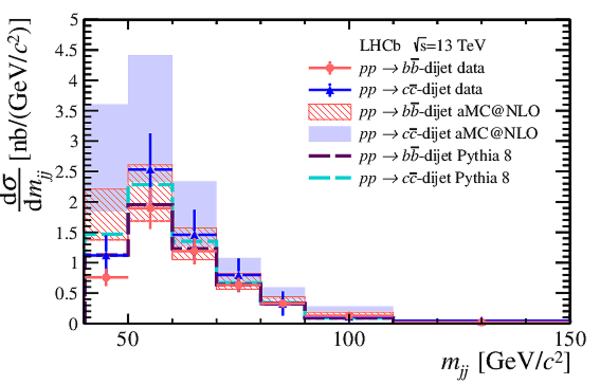
Differential $b\bar{b}$- and $c\bar{c}$-dijet cross-sections as a function of the (top left) leading jet $\eta$, (top right) the leading jet $p_{\mathrm{T}}$, (bottom left) $\Delta y^*$ and (bottom right) $m_{jj}$. The error bars represent the total uncertainties, that are almost fully correlated across the bins. The next-to-leading-order predictions obtained with Madgraph5 aMC@NLO + Pythia are shown. The prediction uncertainty is dominated by the renormalisation and factorisation scale uncertainty. The leading-order prediction obtained with Pythia is also shown. |
Fig3a.pdf [16 KiB] HiDef png [308 KiB] Thumbnail [243 KiB] *.C file |
|
|
Fig3b.pdf [15 KiB] HiDef png [255 KiB] Thumbnail [222 KiB] *.C file |
|
|
|
Fig3c.pdf [16 KiB] HiDef png [300 KiB] Thumbnail [235 KiB] *.C file |
|
|
|
Fig3d.pdf [15 KiB] HiDef png [243 KiB] Thumbnail [204 KiB] *.C file |
|
|
|
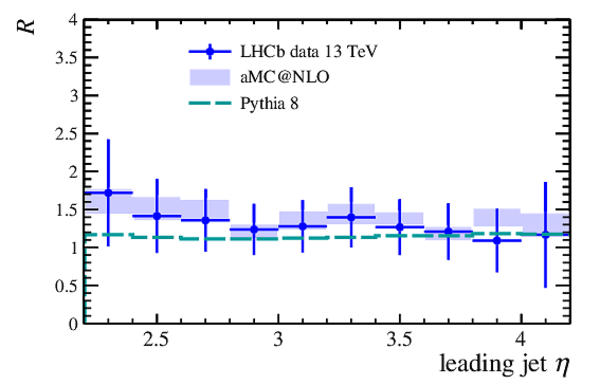
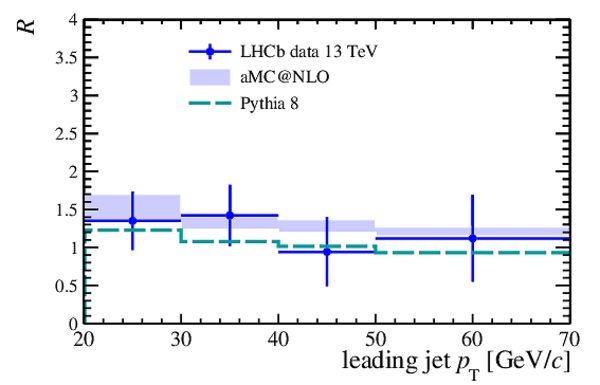
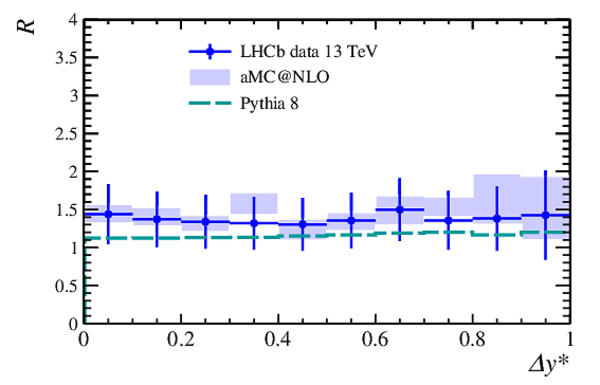
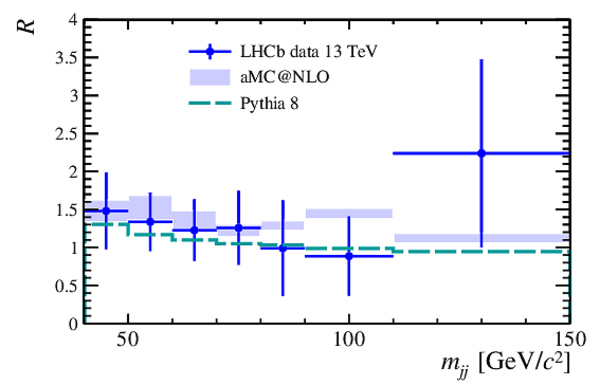
Measured $c\bar{c}$ to $b \bar{b}$ cross-section ratio as a function of (top left) the leading jet $\eta$, (top right) the leading jet $p_{\mathrm{T}}$, (bottom left) $\Delta y^*$ and (bottom right) $m_{jj}$. The error bars represent the total uncertainties, that are almost fully correlated across the bins. The next-to-leading-order predictions obtained with Madgraph5 aMC@NLO + Pythia are shown. The prediction uncertainty is dominated by the renormalisation and factorisation scale uncertainty. The leading-order prediction obtained with Pythia is also shown. |
Fig4a.pdf [15 KiB] HiDef png [117 KiB] Thumbnail [113 KiB] *.C file |
|
|
Fig4b.pdf [14 KiB] HiDef png [116 KiB] Thumbnail [115 KiB] *.C file |
|
|
|
Fig4c.pdf [15 KiB] HiDef png [117 KiB] Thumbnail [112 KiB] *.C file |
|
|
|
Fig4d.pdf [14 KiB] HiDef png [111 KiB] Thumbnail [105 KiB] *.C file |
|
|
|
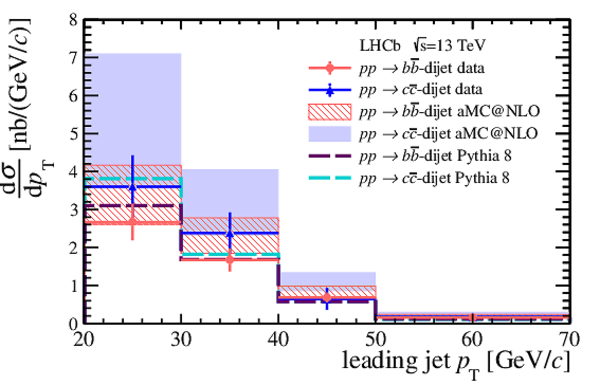
Measured differential $b\bar{b}$- and $c\bar{c}$-dihet cross-sections as a function of the (left) leading jet $p_{\mathrm{T}}$ and (right) $m_{jj}$ on a linear scale. The error bars represent the total uncertainties, that are almost fully correlated across the bins. The next-to-leading-order predictions obtained with Madgraph5 aMC@NLO + Pythia are shown. The prediction uncertainty is dominated by the renormalisation and factorisation scale uncertainty. The leading-order prediction obtained with Pythia is also shown. |
Fig5a.pdf [15 KiB] HiDef png [281 KiB] Thumbnail [238 KiB] *.C file |
|
|
Fig5b.pdf [16 KiB] HiDef png [257 KiB] Thumbnail [214 KiB] *.C file |
|
|
|
Animated gif made out of all figures. |
PAPER-2020-018.gif Thumbnail |

|
![HiDef png [477 KiB]](Directory_LHCb-PAPER-2020-018/hidef_Fig1a.png)
![HiDef png [492 KiB]](Directory_LHCb-PAPER-2020-018/hidef_Fig1b.png)
![HiDef png [202 KiB]](Directory_LHCb-PAPER-2020-018/hidef_Fig2.png)
![HiDef png [308 KiB]](Directory_LHCb-PAPER-2020-018/hidef_Fig3a.png)
![HiDef png [255 KiB]](Directory_LHCb-PAPER-2020-018/hidef_Fig3b.png)
![HiDef png [300 KiB]](Directory_LHCb-PAPER-2020-018/hidef_Fig3c.png)
![HiDef png [243 KiB]](Directory_LHCb-PAPER-2020-018/hidef_Fig3d.png)
![HiDef png [117 KiB]](Directory_LHCb-PAPER-2020-018/hidef_Fig4a.png)
![HiDef png [116 KiB]](Directory_LHCb-PAPER-2020-018/hidef_Fig4b.png)
![HiDef png [117 KiB]](Directory_LHCb-PAPER-2020-018/hidef_Fig4c.png)
![HiDef png [111 KiB]](Directory_LHCb-PAPER-2020-018/hidef_Fig4d.png)
![HiDef png [281 KiB]](Directory_LHCb-PAPER-2020-018/hidef_Fig5a.png)
![HiDef png [257 KiB]](Directory_LHCb-PAPER-2020-018/hidef_Fig5b.png)
Tables and captions
|
List of fiducial requirements on jet transverse momentum, pseudorapidity and the azimuthal angle between the jets. |
Table_1.pdf [50 KiB] HiDef png [134 KiB] Thumbnail [48 KiB] tex code |

|
|
Mean relative uncertainties in percent on the cross-sections calculated averaging over the leading jet pseudorapidity intervals for $b\bar{b}$ and $c\bar{c}$ events. For the total uncertainty individual contributions are added in quadrature. |
Table_2.pdf [43 KiB] HiDef png [142 KiB] Thumbnail [70 KiB] tex code |

|
|
The total $b \bar{b}$-dijet and $c \bar{c}$-dijet cross-sections and their ratio in the fiducial region, compared with the NLO predictions. The first uncertainty on the measurement is the combined statistical and systematic uncertainty and the second is the uncertainty from the luminosity. For the measurement of $R$ the luminosity uncertainty cancels in the ratio. The statistical uncertainty for the cross-section and $R$ measurements is also reported. For the predictions the first uncertainty corresponds to the scale uncertainty, the second to the PDF uncertainty. |
Table_3.pdf [69 KiB] HiDef png [41 KiB] Thumbnail [20 KiB] tex code |

|
|
Numerical results of $b\bar{b}$- and $c \bar{c}$-dijet cross-sections, $c\bar{c}/b\bar{b}$ dijet cross-section ratios and their total uncertainties as a function of the leading jet $\eta$. |
Table_4.pdf [59 KiB] HiDef png [136 KiB] Thumbnail [60 KiB] tex code |

|
|
Numerical results of $b\bar{b}$- and $c \bar{c}$-dijet cross-sections, $c\bar{c}/b\bar{b}$ dijet cross-section ratios and their total uncertainties as a function of $\Delta y^*$. |
Table_5.pdf [74 KiB] HiDef png [132 KiB] Thumbnail [66 KiB] tex code |

|
|
Numerical results of $b\bar{b}$- and $c \bar{c}$-dijet cross-sections, $c\bar{c}/b\bar{b}$ dijet cross-section ratios and their total uncertainties as a function of the leading jet $ p_{\mathrm{T}} $. |
Table_6.pdf [68 KiB] HiDef png [54 KiB] Thumbnail [27 KiB] tex code |

|
|
Numerical results of $b\bar{b}$- and $c \bar{c}$-dijet cross-sections, $c\bar{c}/b\bar{b}$ dijet cross-section ratios and their total uncertainties as a function of $m_{jj}$. |
Table_7.pdf [76 KiB] HiDef png [78 KiB] Thumbnail [40 KiB] tex code |

|
|
Covariance matrix, corresponding to the total uncertainties, obtained between the leading jet $\eta$ intervals of the $b\bar{b}$-dijet differential cross sections. The unit of all the elements of the matrix is nb$^2$. |
Table_8.pdf [36 KiB] HiDef png [50 KiB] Thumbnail [21 KiB] tex code |

|
|
Covariance matrix, corresponding to the total uncertainties, obtained between the leading jet $\eta$ intervals of the $c\bar{c}$-dijet differential cross sections. The unit of all the elements of the matrix is nb$^2$. |
Table_9.pdf [36 KiB] HiDef png [56 KiB] Thumbnail [23 KiB] tex code |

|
|
Covariance matrix, corresponding to the total uncertainties, obtained between the leading jet $\eta$ intervals of the $b\bar{b}$ (horizontal) and $c\bar{c}$ (vertical) differential cross sections. The unit of all the elements of the matrix is nb$^2$. |
Table_10.pdf [50 KiB] HiDef png [66 KiB] Thumbnail [24 KiB] tex code |

|
|
Covariance matrix, corresponding to the total uncertainties, obtained between the $\Delta y^*$ intervals of the $b\bar{b}$-dijet differential cross sections. The unit of all the elements of the matrix is nb$^2$. |
Table_11.pdf [36 KiB] HiDef png [61 KiB] Thumbnail [25 KiB] tex code |

|
|
Covariance matrix, corresponding to the total uncertainties, obtained between the $\Delta y^*$ intervals of the $c\bar{c}$-dijet differential cross sections. The unit of all the elements of the matrix is nb$^2$. |
Table_12.pdf [36 KiB] HiDef png [66 KiB] Thumbnail [26 KiB] tex code |

|
|
Covariance matrix, corresponding to the total uncertainties, obtained between the $\Delta y^*$ intervals of the $b\bar{b}$ (horizontal) and $c\bar{c}$ (vertical) differential cross sections. The unit of all the elements of the matrix is nb$^2$. |
Table_13.pdf [50 KiB] HiDef png [65 KiB] Thumbnail [24 KiB] tex code |

|
|
Covariance matrix, corresponding to the total uncertainties, obtained between the leading jet $ p_{\mathrm{T}} $ intervals of the $b\bar{b}$-dijet differential cross sections. The unit of all the elements of the matrix is $\left( \frac{\mathrm{nb}}{\text{ Ge V /}c } \right)^2$ and the $ p_{\mathrm{T}} $ intervals are given in $\text{ Ge V /}c$ . |
Table_14.pdf [35 KiB] HiDef png [61 KiB] Thumbnail [29 KiB] tex code |

|
|
Covariance matrix, corresponding to the total uncertainties, obtained between the leading jet $ p_{\mathrm{T}} $ intervals of the $c\bar{c}$-dijet differential cross sections. The unit of all the elements of the matrix is $\left( \frac{\mathrm{nb}}{\text{ Ge V /}c } \right)^2$ and the $ p_{\mathrm{T}} $ intervals are given in $\text{ Ge V /}c$ . |
Table_15.pdf [35 KiB] HiDef png [63 KiB] Thumbnail [30 KiB] tex code |

|
|
Covariance matrix, corresponding to the total uncertainties, obtained between the leading jet $ p_{\mathrm{T}} $ intervals of the $b\bar{b}$ (horizontal) and $c\bar{c}$ (vertical) differential cross sections. The unit of all the elements of the matrix is $\left( \frac{\mathrm{nb}}{\text{ Ge V /}c } \right)^2$ and the $ p_{\mathrm{T}} $ intervals are given in $\text{ Ge V /}c$ . |
Table_16.pdf [49 KiB] HiDef png [66 KiB] Thumbnail [30 KiB] tex code |

|
|
Covariance matrix, corresponding to the total uncertainties, obtained between the $m_{jj}$ intervals of the $b\bar{b}$-dijet differential cross sections. The unit of all the elements of the matrix is $\left( \frac{\mathrm{nb}}{\text{ Ge V} } \right)^2$ and the mass intervals are given in $\text{ Ge V}$ . |
Table_17.pdf [36 KiB] HiDef png [68 KiB] Thumbnail [29 KiB] tex code |

|
|
Covariance matrix, corresponding to the total uncertainties, obtained between the $m_{jj}$ intervals of the $c\bar{c}$-dijet differential cross sections. The unit of all the elements of the matrix is $\left( \frac{\mathrm{nb}}{\text{ Ge V /}c^2 } \right)^2$ and the mass intervals are given in $\text{ Ge V /}c^2$ . |
Table_18.pdf [36 KiB] HiDef png [67 KiB] Thumbnail [29 KiB] tex code |

|
|
Covariance matrix, corresponding to the total uncertainties, obtained between the $m_{jj}$ intervals of the $b\bar{b}$ (horizontal) and $c\bar{c}$ (vertical) differential cross sections. The unit of all the elements of the matrix is $\left( \frac{\mathrm{nb}}{\text{ Ge V /}c^2 } \right)^2$ and the mass intervals are given in $\text{ Ge V /}c^2$ . |
Table_19.pdf [50 KiB] HiDef png [93 KiB] Thumbnail [35 KiB] tex code |

|
![HiDef png [134 KiB]](Directory_LHCb-PAPER-2020-018/hidef_Table_1.png)
![HiDef png [142 KiB]](Directory_LHCb-PAPER-2020-018/hidef_Table_2.png)
![HiDef png [41 KiB]](Directory_LHCb-PAPER-2020-018/hidef_Table_3.png)
![HiDef png [136 KiB]](Directory_LHCb-PAPER-2020-018/hidef_Table_4.png)
![HiDef png [132 KiB]](Directory_LHCb-PAPER-2020-018/hidef_Table_5.png)
![HiDef png [54 KiB]](Directory_LHCb-PAPER-2020-018/hidef_Table_6.png)
![HiDef png [78 KiB]](Directory_LHCb-PAPER-2020-018/hidef_Table_7.png)
![HiDef png [50 KiB]](Directory_LHCb-PAPER-2020-018/hidef_Table_8.png)
![HiDef png [56 KiB]](Directory_LHCb-PAPER-2020-018/hidef_Table_9.png)
![HiDef png [66 KiB]](Directory_LHCb-PAPER-2020-018/hidef_Table_10.png)
![HiDef png [61 KiB]](Directory_LHCb-PAPER-2020-018/hidef_Table_11.png)
![HiDef png [66 KiB]](Directory_LHCb-PAPER-2020-018/hidef_Table_12.png)
![HiDef png [65 KiB]](Directory_LHCb-PAPER-2020-018/hidef_Table_13.png)
![HiDef png [61 KiB]](Directory_LHCb-PAPER-2020-018/hidef_Table_14.png)
![HiDef png [63 KiB]](Directory_LHCb-PAPER-2020-018/hidef_Table_15.png)
![HiDef png [66 KiB]](Directory_LHCb-PAPER-2020-018/hidef_Table_16.png)
![HiDef png [68 KiB]](Directory_LHCb-PAPER-2020-018/hidef_Table_17.png)
![HiDef png [67 KiB]](Directory_LHCb-PAPER-2020-018/hidef_Table_18.png)
![HiDef png [93 KiB]](Directory_LHCb-PAPER-2020-018/hidef_Table_19.png)
Created on 20 April 2024.