Measurement of the CKM angle $\gamma$ in $B^\pm\to D K^\pm$ and $B^\pm \to D \pi^\pm$ decays with $D \to K_\mathrm S^0 h^+ h^-$
[to restricted-access page]Information
LHCb-PAPER-2020-019
CERN-EP-2020-175
arXiv:2010.08483 [PDF]
(Submitted on 16 Oct 2020)
JHEP 02 (2021) 169
Inspire 1823424
Tools
Abstract
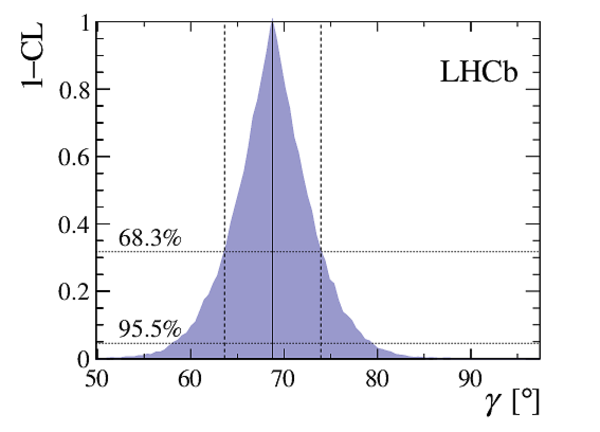
A measurement of $CP$-violating observables is performed using the decays $B^\pm\to D K^\pm$ and $B^\pm\to D \pi^\pm$, where the $D$ meson is reconstructed in one of the self-conjugate three-body final states $K_{\mathrm S}\pi^+\pi^-$ and $K_{\mathrm S}K^+K^-$ (commonly denoted $K_{\mathrm S} h^+h^-$). The decays are analysed in bins of the $D$-decay phase space, leading to a measurement that is independent of the modelling of the $D$-decay amplitude. The observables are interpreted in terms of the CKM angle $\gamma$. Using a data sample corresponding to an integrated luminosity of $9 \text{fb}^{-1}$ collected in proton-proton collisions at centre-of-mass energies of $7$, $8$, and $13 \text{TeV}$ with the LHCb experiment, $\gamma$ is measured to be $\left(68.7^{+5.2}_{-5.1}\right)^\circ$. The hadronic parameters $r_B^{DK}$, $r_B^{D\pi}$, $\delta_B^{DK}$, and $\delta_B^{D\pi}$, which are the ratios and strong-phase differences of the suppressed and favoured $B^\pm$ decays, are also reported.
Figures and captions
|
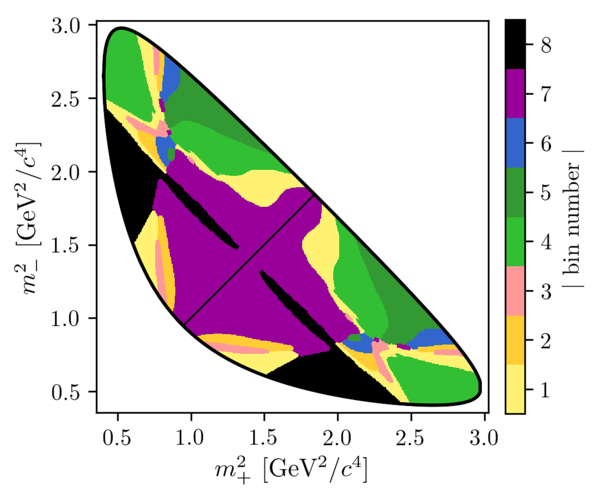
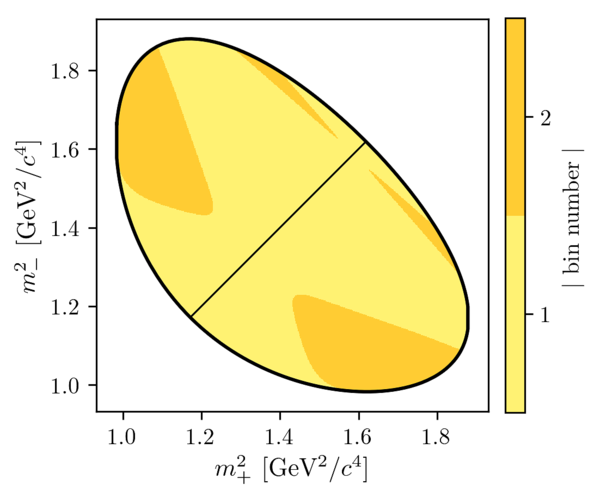
Binning schemes for (left) $ D \rightarrow K ^0_{\mathrm{S}} \pi ^+ \pi ^- $ decays and (right) $ D \rightarrow K ^0_{\mathrm{S}} K ^+ K ^- $ decays. The diagonal line separates the positive and negative bins, where the positive bins are in the region in which $ m^2_- > m^2_+ $ is satisfied. |
KsPiPi[..].png [75 KiB] HiDef png [155 KiB] Thumbnail [79 KiB] *.C file |
|
|
KsKK_2bins.png [65 KiB] HiDef png [118 KiB] Thumbnail [57 KiB] *.C file |
|
|
|
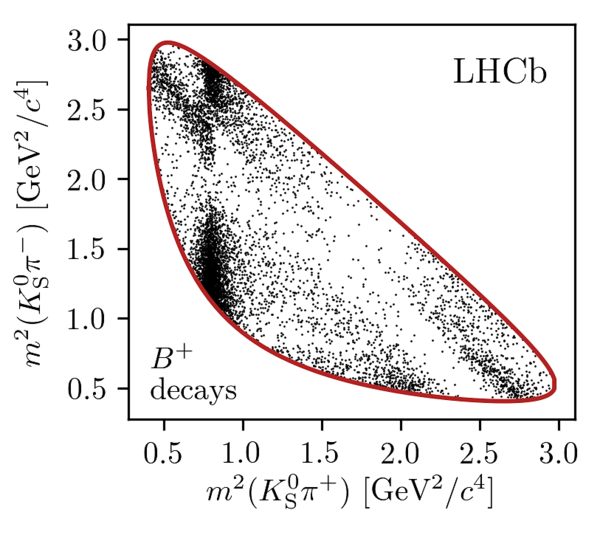
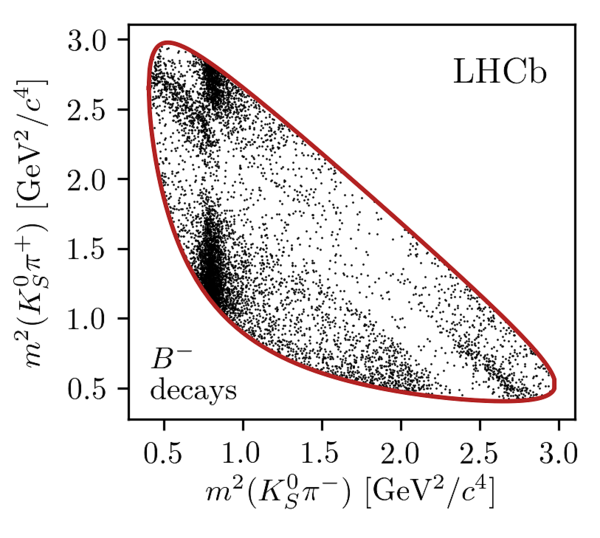
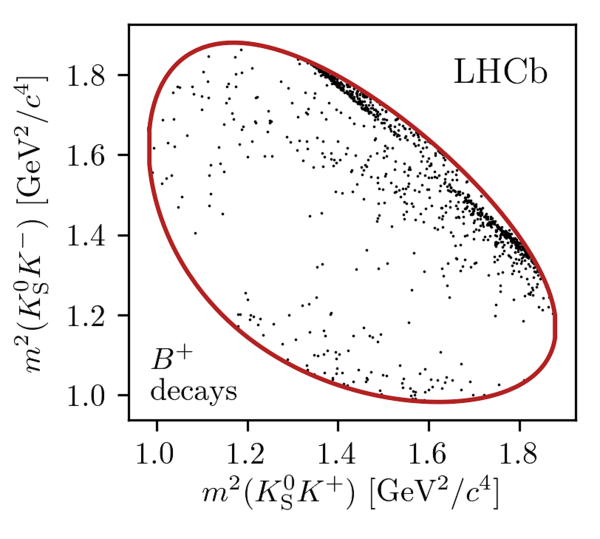
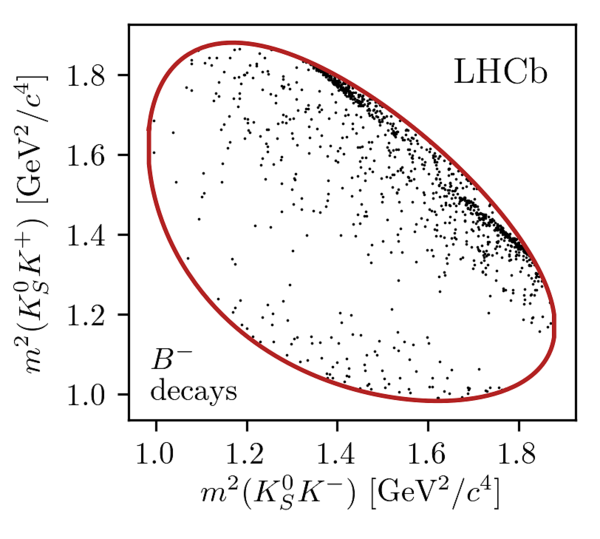
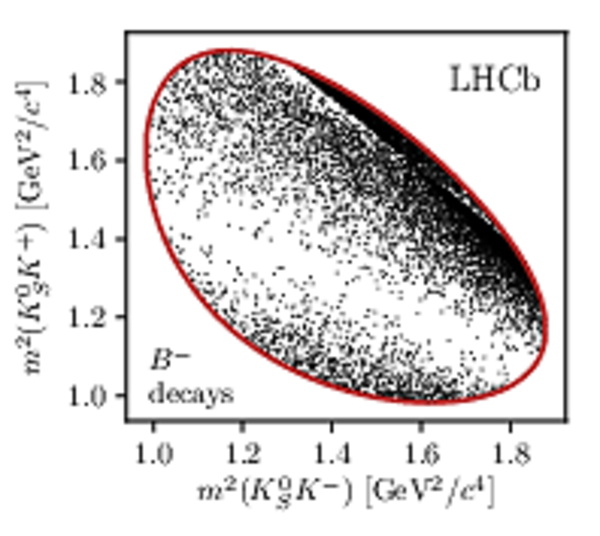
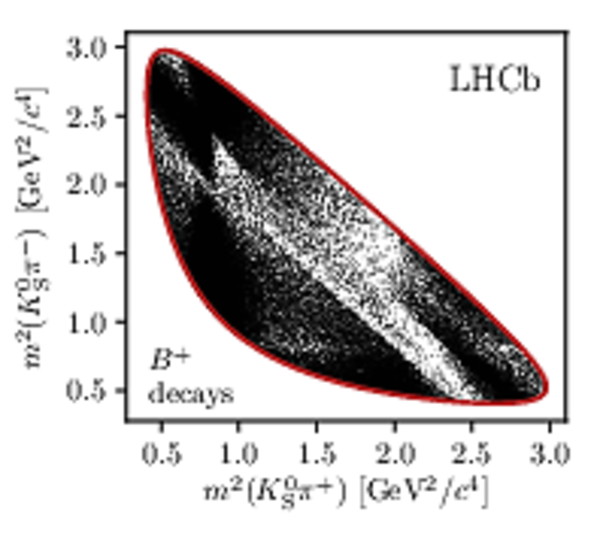
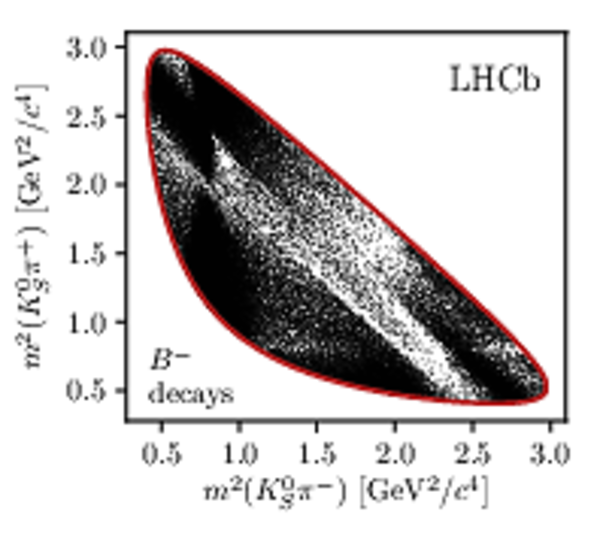
Dalitz plot for $ D $ decays of (left) $ B ^+ \rightarrow D K ^+ $ and (right) $ B ^- \rightarrow D K ^- $ candidates in the signal region, in the (top) $ D \rightarrow K ^0_{\mathrm{S}} \pi ^+ \pi ^- $ and (bottom) $ D \rightarrow K ^0_{\mathrm{S}} K ^+ K ^- $ channels. The horizontal and vertical axes are interchanged between the $ B ^+ $ and $ B ^- $ decay plots to aid visualisation of the $ C P$ asymmetries between the two distributions. |
single[..].png [90 KiB] HiDef png [344 KiB] Thumbnail [174 KiB] *.C file |
|
|
single[..].png [89 KiB] HiDef png [352 KiB] Thumbnail [179 KiB] *.C file |
|
|
|
single[..].png [72 KiB] HiDef png [223 KiB] Thumbnail [102 KiB] *.C file |
|
|
|
single[..].png [74 KiB] HiDef png [235 KiB] Thumbnail [108 KiB] *.C file |
|
|
|
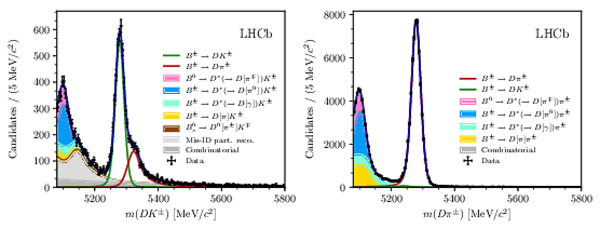
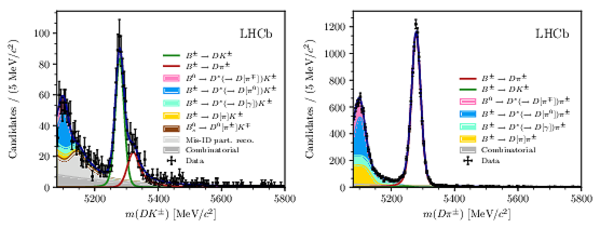
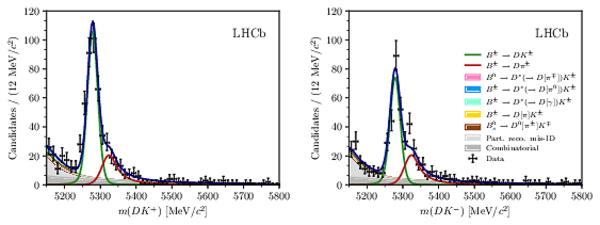
Invariant mass distributions for the (left) $ B ^\pm \rightarrow D K ^\pm $ channel and (right) $ B ^\pm \rightarrow D \pi ^\pm $ channel with $ D \rightarrow K ^0_{\mathrm{S}} \pi ^+ \pi ^- $ . The top (bottom) plots show data where the $ K ^0_{\mathrm{S}}$ candidate is long (downstream). Square brackets in the legend denote a particle that has not been reconstructed. |
pretty[..].pdf [269 KiB] HiDef png [278 KiB] Thumbnail [175 KiB] *.C file |
|
|
pretty[..].pdf [270 KiB] HiDef png [287 KiB] Thumbnail [183 KiB] *.C file |
|
|
|
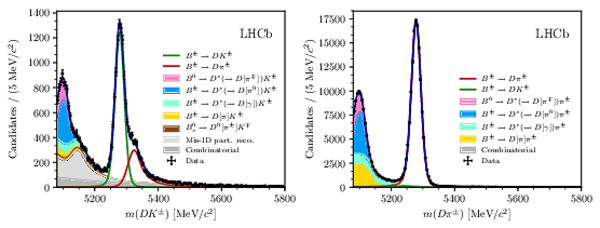
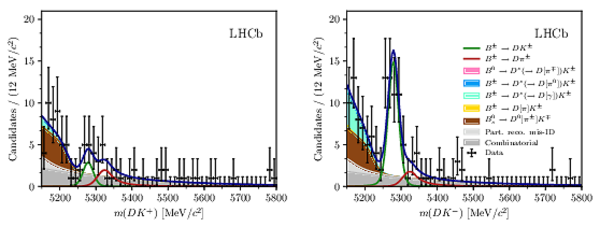
Invariant mass distributions for the (left) $ B ^\pm \rightarrow D K ^\pm $ channel and (right) $ B ^\pm \rightarrow D \pi ^\pm $ channel with $ D \rightarrow K ^0_{\mathrm{S}} K ^+ K ^- $ . The top (bottom) plots show data where the $ K ^0_{\mathrm{S}}$ candidate is long (downstream). Square brackets in the legend denote a particle that has not been reconstructed. |
pretty[..].pdf [267 KiB] HiDef png [284 KiB] Thumbnail [182 KiB] *.C file |
|
|
pretty[..].pdf [268 KiB] HiDef png [278 KiB] Thumbnail [176 KiB] *.C file |

|
|
|
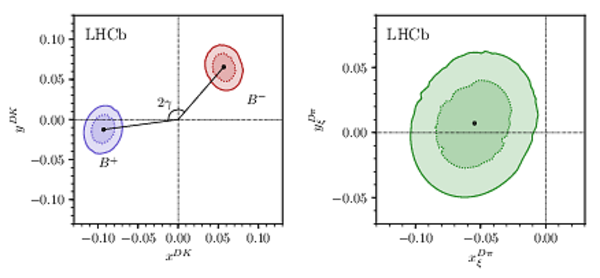
Confidence levels at 68.2 % and 95.5 % probability for (left, blue) $( x_+ ^{ D K ^\pm }, y_+ ^{ D K ^\pm })$, (left, red) $( x_- ^{ D K ^\pm }, y_- ^{ D K ^\pm })$, and (right, green) $(x_\xi^{ D \pi ^\pm },y_\xi^{ D \pi ^\pm }) $ as measured in $ B ^\pm \rightarrow D K ^\pm $ and $ B ^\pm \rightarrow D \pi ^\pm $ decays with a profile likelihood scan. The black dots show the central values |
likeli[..].pdf [186 KiB] HiDef png [194 KiB] Thumbnail [151 KiB] *.C file |
|
|
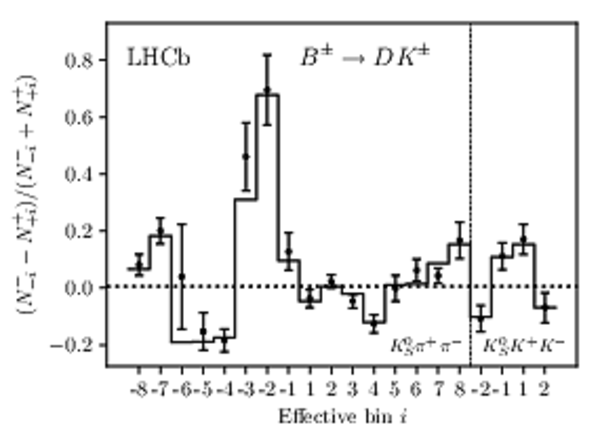
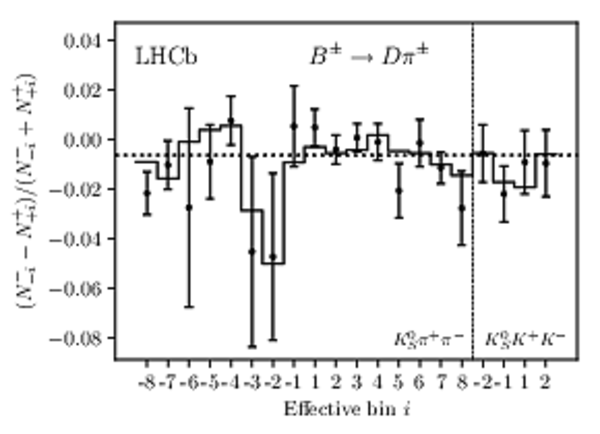
The bin-by-bin asymmetries $(N^-_{-i}-N^+_{+i})/(N^-_{-i}+N^+_{+i})$ for each Dalitz-plot bin number for (left) $ B ^\pm \rightarrow D K ^\pm $ decays and (right) $ B ^\pm \rightarrow D \pi ^\pm $ decays. The prediction from the central values of the $ C P$ -violation observables is shown with a solid line and the asymmetries obtained in fits with independent bin yields are shown with the error bars. The predicted asymmetries in a fit that does not allow for $ C P$ violation are shown with a dotted line. The vertical dashed line separates the $ K ^0_{\mathrm{S}} \pi ^+ \pi ^- $ and $ K ^0_{\mathrm{S}} K ^+ K ^- $ bins on the horizontal axis. |
paper_[..].pdf [340 KiB] HiDef png [114 KiB] Thumbnail [94 KiB] *.C file |
|
|
paper_[..].pdf [341 KiB] HiDef png [122 KiB] Thumbnail [100 KiB] *.C file |
|
|
|
Confidence limits for the CKM angle $\gamma$ obtained using the method described in Ref. [44]. |
g_1d_paper.pdf [14 KiB] HiDef png [166 KiB] Thumbnail [131 KiB] *.C file |
|
|
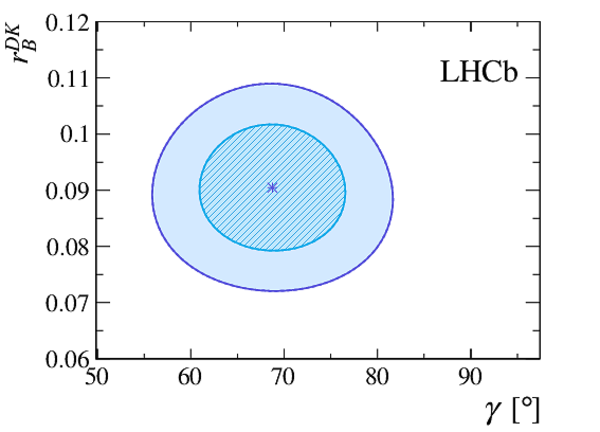
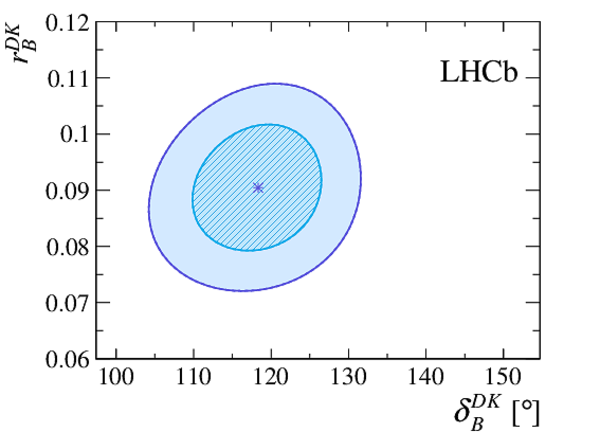
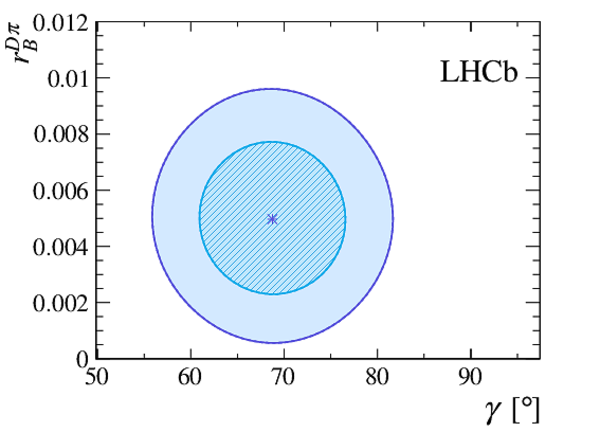
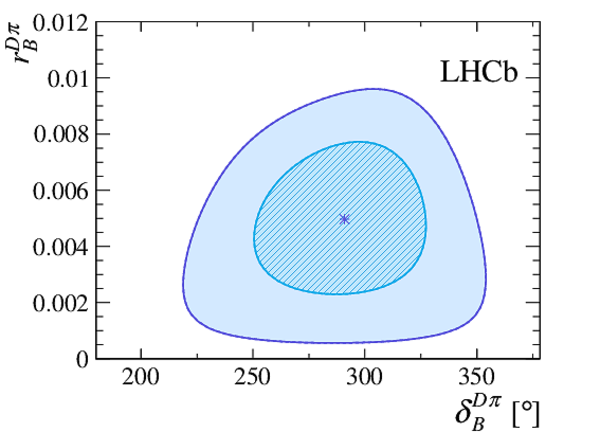
The 68 % and 95 % confidence regions for combinations of the physics parameters $(\gamma , r_ B ^{ D K } , \delta_ B ^{ D K } , r_ B ^{ D \pi} , \delta_ B ^{ D \pi} )$ obtained using the methods described in Ref. [44]. |
2d_g_r[..].pdf [14 KiB] HiDef png [320 KiB] Thumbnail [195 KiB] *.C file |
|
|
2d_d_d[..].pdf [14 KiB] HiDef png [306 KiB] Thumbnail [187 KiB] *.C file |
|
|
|
2d_g_r[..].pdf [14 KiB] HiDef png [369 KiB] Thumbnail [230 KiB] *.C file |
|
|
|
2d_d_d[..].pdf [15 KiB] HiDef png [415 KiB] Thumbnail [261 KiB] *.C file |
|
|
|
Animated gif made out of all figures. |
PAPER-2020-019.gif Thumbnail |

|
Tables and captions
|
The signal and background yields in the region $m_B\in[5249, 5309]\text{ Me V /}c^2 $ as obtained in the fit. For the $ B ^\pm \rightarrow D K ^\pm $ candidates, the yield of the partially reconstructed background includes the contributions from $ B ^0_ s $ decays and misidentified partially reconstructed backgrounds. |
Table_1.pdf [70 KiB] HiDef png [65 KiB] Thumbnail [30 KiB] tex code |

|
|
Overview of all sources of uncertainty, $\sigma$, on $ x_\pm^{ D K }$ , $ y_\pm^{ D K }$ , $ x_\xi^{ D \pi}$ , and $ y_\xi^{ D \pi}$ . All uncertainties are quoted $\times 10^{-2}$. |
Table_2.pdf [66 KiB] HiDef png [121 KiB] Thumbnail [51 KiB] tex code |

|
|
Statistical uncertainties, $\sigma$, and correlation matrix for $ x_\pm^{ D K }$ , $ y_\pm^{ D K }$ , $ x_\xi^{ D \pi}$ , and $ y_\xi^{ D \pi}$ . |
Table_3.pdf [69 KiB] HiDef png [72 KiB] Thumbnail [35 KiB] tex code |

|
|
Total LHCb -related systematic uncertainties, $\sigma$, for $ x_\pm^{ D K }$ , $ y_\pm^{ D K }$ , $ x_\xi^{ D \pi}$ , and $ y_\xi^{ D \pi}$ , and the corresponding correlation matrix. |
Table_4.pdf [69 KiB] HiDef png [76 KiB] Thumbnail [36 KiB] tex code |

|
|
Systematic uncertainties, $\sigma$, for $ x_\pm^{ D K }$ , $ y_\pm^{ D K }$ , $ x_\xi^{ D \pi}$ , and $ y_\xi^{ D \pi}$ due to strong-phase inputs, the corresponding correlation matrix. |
Table_5.pdf [69 KiB] HiDef png [73 KiB] Thumbnail [36 KiB] tex code |

|
Supplementary Material [file]


![KsPiPi[..].png [75 KiB]](Directory_LHCb-PAPER-2020-019/KsPiPi_optimal.png)
![HiDef png [155 KiB]](Directory_LHCb-PAPER-2020-019/hidef_KsPiPi_optimal.png)
![KsKK_2bins.png [65 KiB]](Directory_LHCb-PAPER-2020-019/KsKK_2bins.png)
![HiDef png [118 KiB]](Directory_LHCb-PAPER-2020-019/hidef_KsKK_2bins.png)
![single[..].png [90 KiB]](Directory_LHCb-PAPER-2020-019/single_DP_K_PiPi_LLandDD_plus.png)
![HiDef png [344 KiB]](Directory_LHCb-PAPER-2020-019/hidef_single_DP_K_PiPi_LLandDD_plus.png)
![single[..].png [89 KiB]](Directory_LHCb-PAPER-2020-019/single_DP_K_PiPi_LLandDD_minus.png)
![HiDef png [352 KiB]](Directory_LHCb-PAPER-2020-019/hidef_single_DP_K_PiPi_LLandDD_minus.png)
![single[..].png [72 KiB]](Directory_LHCb-PAPER-2020-019/single_DP_K_KK_LLandDD_plus.png)
![HiDef png [223 KiB]](Directory_LHCb-PAPER-2020-019/hidef_single_DP_K_KK_LLandDD_plus.png)
![single[..].png [74 KiB]](Directory_LHCb-PAPER-2020-019/single_DP_K_KK_LLandDD_minus.png)
![HiDef png [235 KiB]](Directory_LHCb-PAPER-2020-019/hidef_single_DP_K_KK_LLandDD_minus.png)
![HiDef png [278 KiB]](Directory_LHCb-PAPER-2020-019/hidef_pretty_fit_d2kspp_LL.png)
![HiDef png [287 KiB]](Directory_LHCb-PAPER-2020-019/hidef_pretty_fit_d2kspp_DD.png)
![HiDef png [284 KiB]](Directory_LHCb-PAPER-2020-019/hidef_pretty_fit_d2kskk_LL.png)
![HiDef png [278 KiB]](Directory_LHCb-PAPER-2020-019/hidef_pretty_fit_d2kskk_DD.png)
![HiDef png [194 KiB]](Directory_LHCb-PAPER-2020-019/hidef_likelihood_plot_paper.png)
![HiDef png [114 KiB]](Directory_LHCb-PAPER-2020-019/hidef_paper_asym_dk.png)
![HiDef png [122 KiB]](Directory_LHCb-PAPER-2020-019/hidef_paper_asym_dpi.png)
![HiDef png [166 KiB]](Directory_LHCb-PAPER-2020-019/hidef_g_1d_paper.png)
![HiDef png [320 KiB]](Directory_LHCb-PAPER-2020-019/hidef_2d_g_r_dk_paper.png)
![HiDef png [306 KiB]](Directory_LHCb-PAPER-2020-019/hidef_2d_d_dk_r_dk_paper.png)
![HiDef png [369 KiB]](Directory_LHCb-PAPER-2020-019/hidef_2d_g_r_dpi_paper.png)
![HiDef png [415 KiB]](Directory_LHCb-PAPER-2020-019/hidef_2d_d_dpi_r_dpi_paper.png)
![HiDef png [65 KiB]](Directory_LHCb-PAPER-2020-019/hidef_Table_1.png)
![HiDef png [121 KiB]](Directory_LHCb-PAPER-2020-019/hidef_Table_2.png)
![HiDef png [72 KiB]](Directory_LHCb-PAPER-2020-019/hidef_Table_3.png)
![HiDef png [76 KiB]](Directory_LHCb-PAPER-2020-019/hidef_Table_4.png)
![HiDef png [73 KiB]](Directory_LHCb-PAPER-2020-019/hidef_Table_5.png)
![HiDef png [269 KiB]](Directory_LHCb-PAPER-2020-019/supplementary/hidef_SupMat_Fig1.png)
![HiDef png [278 KiB]](Directory_LHCb-PAPER-2020-019/supplementary/hidef_SupMat_Fig2.png)
![HiDef png [825 KiB]](Directory_LHCb-PAPER-2020-019/supplementary/hidef_SupMat_Fig3bottomleft.png)
![HiDef png [826 KiB]](Directory_LHCb-PAPER-2020-019/supplementary/hidef_SupMat_Fig3bottomright.png)
![HiDef png [1 MiB]](Directory_LHCb-PAPER-2020-019/supplementary/hidef_SupMat_Fig3topleft.png)
![HiDef png [1 MiB]](Directory_LHCb-PAPER-2020-019/supplementary/hidef_SupMat_Fig3topright.png)
![HiDef png [269 KiB]](Directory_LHCb-PAPER-2020-019/supplementary/hidef_lhcb-logo.png)
![Thumbnail [142 KiB]](Directory_LHCb-PAPER-2020-019/supplementary/thumbnail_lhcb-logo.png)
Created on 19 April 2024.