A model-independent study of resonant structure in $B^+\to D^+D^-K^+$ decays
[to restricted-access page]Information
LHCb-PAPER-2020-024
CERN-EP-2020-158
arXiv:2009.00025 [PDF]
(Submitted on 31 Aug 2020)
Phys. Rev. Lett. 125 (2020) 242001
Inspire 1814318
Tools
Abstract
The only anticipated resonant contributions to $B^+\to D^+D^-K^+$ decays are charmonium states in the $D^+D^-$ channel. A model-independent analysis, using LHCb proton-proton collision data taken at centre-of-mass energies of $\sqrt{s}=7,8,$ and $13$ TeV, corresponding to a total integrated luminosity of 9 fb$^{-1}$, is carried out to test this hypothesis. The description of the data assuming that resonances only manifest in decays to the $D^+D^-$ pair is shown to be incomplete. This constitutes evidence for a new contribution to the decay, potentially one or more new charm-strange resonances in the $D^-K^+$ channel with masses around 2.9 GeV$/c^2$.
Figures and captions
|
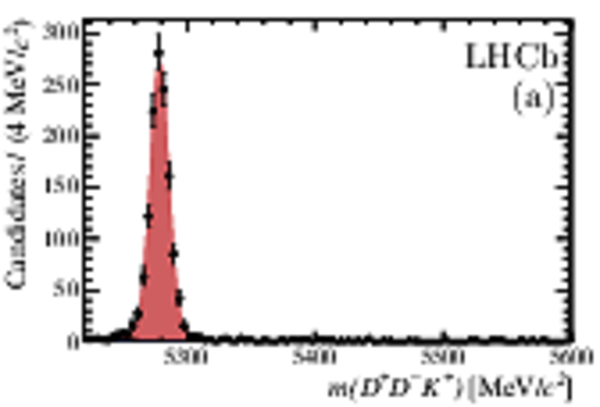
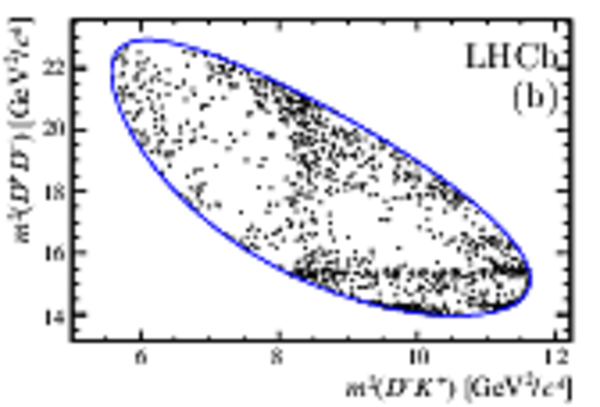
(a) Invariant-mass distribution for $ B $ candidates with the results of the fit superimposed, where the signal component is indicated in red and background (barely visible) in blue. (b) Dalitz plot for candidates with $m( D ^+ D ^- K ^+ )$ values in the signal window. |
fig1a.pdf [40 KiB] HiDef png [262 KiB] Thumbnail [301 KiB] |
|
|
fig1b.pdf [122 KiB] HiDef png [449 KiB] Thumbnail [464 KiB] |
|
|
|
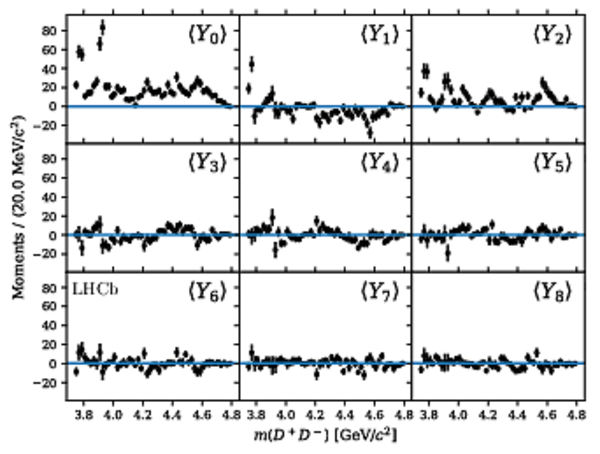
Distributions of the first nine unnormalised moments, $\langle Y_k^j\rangle$, defined in Eq. 2, as a function of $m( D ^+ D ^- )$ for the selected $ B ^+ \rightarrow D ^+ D ^- K ^+ $ candidates, after efficiency correction and background subtraction have been applied. |
fig2.pdf [50 KiB] HiDef png [314 KiB] Thumbnail [368 KiB] |
|
|
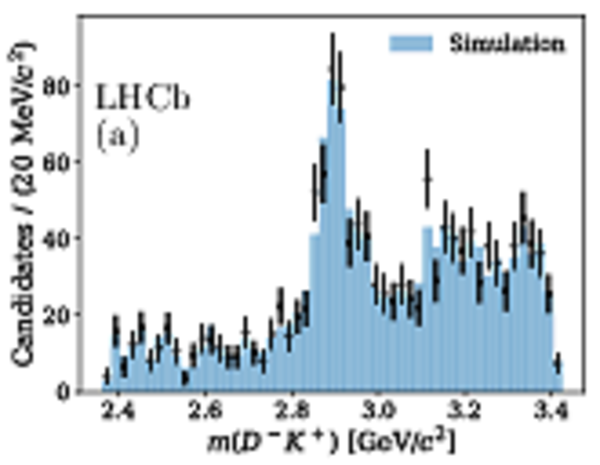
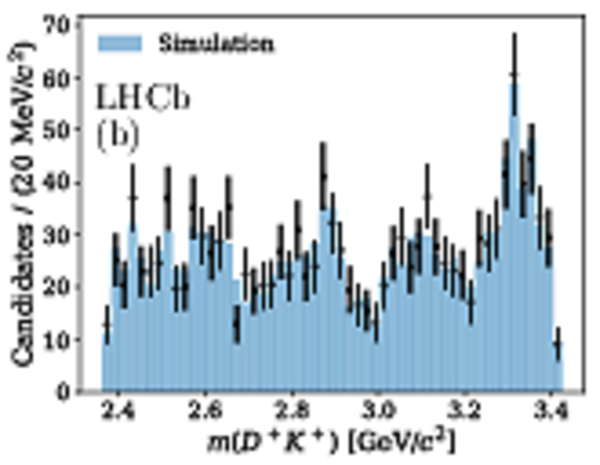
Comparison between data (points with error bars) and a weighted generated sample (filled histogram) as a function of (a) $m( D ^- K ^+ )$ and (b) $m( D ^+ K ^+ )$, where the weights account for the Legendre polynomial moments of order up to and including 29. |
fig3a.pdf [26 KiB] HiDef png [342 KiB] Thumbnail [418 KiB] |
|
|
fig3b.pdf [27 KiB] HiDef png [369 KiB] Thumbnail [475 KiB] |
|
|
|
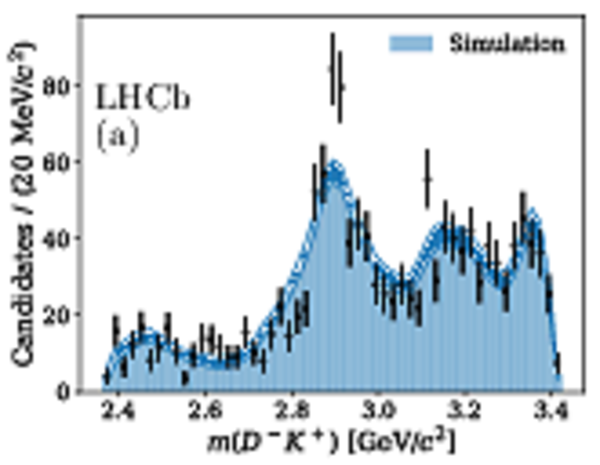
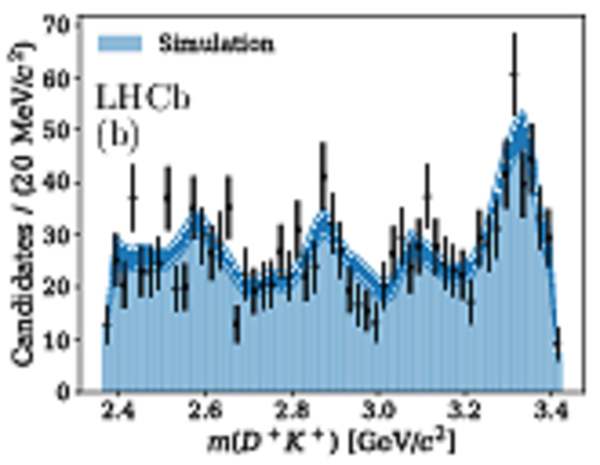
Comparison between data (points with error bars) and a weighted generated sample (filled histogram) as a function of (a) $m( D ^- K ^+ )$ and (b) $m( D ^+ K ^+ )$, where the weights account for the Legendre polynomial moments of order up to and including four. The uncertainty on the weighted shape (dark band) is also shown. |
fig4a.pdf [27 KiB] HiDef png [528 KiB] Thumbnail [444 KiB] |
|
|
fig4b.pdf [28 KiB] HiDef png [559 KiB] Thumbnail [506 KiB] |
|
|
|
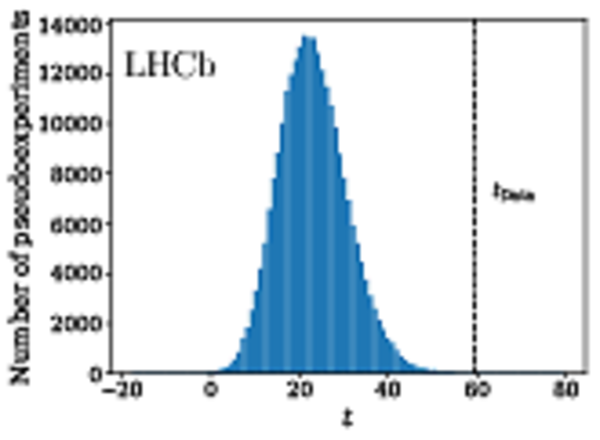
Comparison of the test statistic evaluated for the data (black dashed line) and for the ensemble of pseudoexperiments (blue histogram) generated according to the PDF constructed using the first four moments of the $h( D ^+ D ^- )$ distribution in data. |
fig5.pdf [21 KiB] HiDef png [218 KiB] Thumbnail [268 KiB] |
|
|
Animated gif made out of all figures. |
PAPER-2020-024.gif Thumbnail |

|
![HiDef png [262 KiB]](Directory_LHCb-PAPER-2020-024/hidef_fig1a.png)
![HiDef png [449 KiB]](Directory_LHCb-PAPER-2020-024/hidef_fig1b.png)
![HiDef png [314 KiB]](Directory_LHCb-PAPER-2020-024/hidef_fig2.png)
![HiDef png [342 KiB]](Directory_LHCb-PAPER-2020-024/hidef_fig3a.png)
![HiDef png [369 KiB]](Directory_LHCb-PAPER-2020-024/hidef_fig3b.png)
![HiDef png [528 KiB]](Directory_LHCb-PAPER-2020-024/hidef_fig4a.png)
![HiDef png [559 KiB]](Directory_LHCb-PAPER-2020-024/hidef_fig4b.png)
![HiDef png [218 KiB]](Directory_LHCb-PAPER-2020-024/hidef_fig5.png)
Created on 24 April 2024.